

HJBC
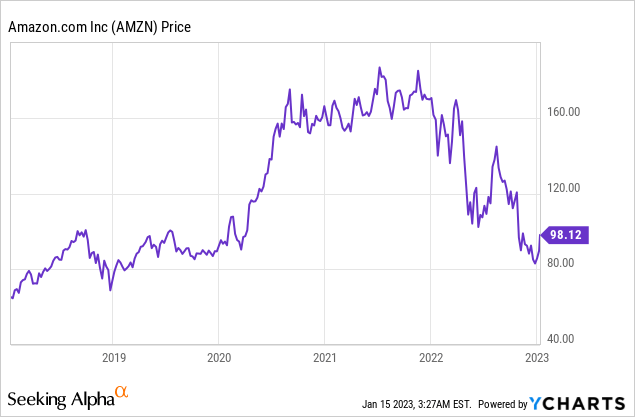
Amazon (NASDAQ:AMZN) is the world’s largest e-commerce company and a business that was deemed to be “untouchable” just a few short years ago. In November 2021, the stock price peaked before being butchered by over 46%. This was mainly driven by high inflation, rising interest rates, and a sharp increase in logistics costs. However, Amazon’s market position still remains solid and its large infrastructure investments in fulfillment centers should pay “dividends” in the years to come. In addition, its Cloud business is still rapidly growing and has the number one market share. Amazon’s technical chart is showing signs of bullish momentum and its stock is deeply undervalued. In this post, I’m going to break down its technicals in more detail, before revisiting its financials and my valuation model, let’s dive in.
Strong Technical Charts
Generally, I will invest in a company based purely on its fundamental indicators such as revenue and earnings. However, technical charts are a great tool that can be used to indicate prospective buy points and where investors have seen value historically. In this case, I have used an indicator called a “Fibonacci” retracement (the colored boxes/lines) which helps to identify support lines. I have identified an extremely strong support line, which I have labeled “Buy Point 1”, at ~$80/share. This aligns with March 2020, share price low of $80 per share at the last major “crash”. In addition, to a consolidation area in 2018 and 2019, where Amazon’s stock moved sideways. The beautiful thing about this example is it immediately proves that technical analysis does add value. For example, many people knew Amazon’s 2020 low but didn’t set up an automated buying trigger for this zone.
Amazon Technical Chart (created by author Deep Tech Insights)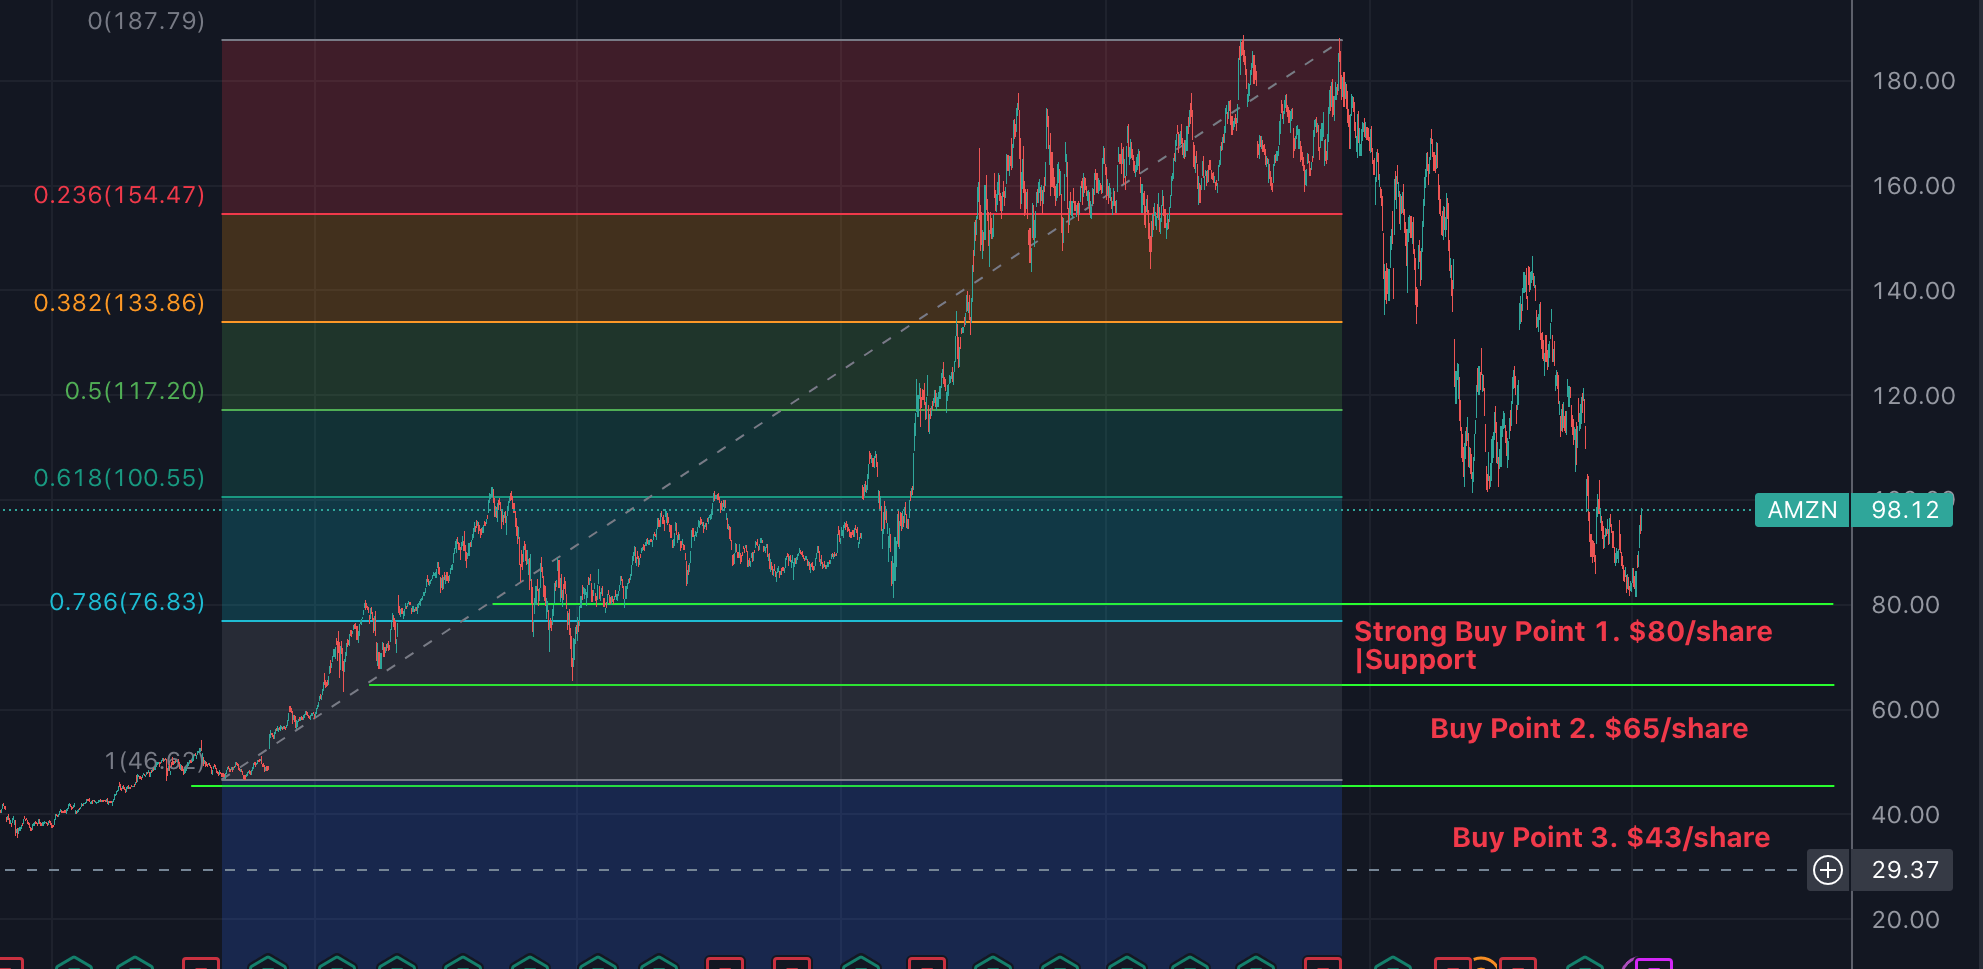
I would actually like to see Amazon’s stock to pull back again, from the ~$98/share to the $80/share support, as that will be a strong buying opportunity. I personally would write that buy point down, although this is not financial advice. A pullback is possible given the general market volatility or if more bad news comes out about Amazon. However, if its Q4 earnings report (February 2nd), is extremely bad then there is a chance its stock price may break through the Buy Point 1, support line. I deem this scenario to be unlikely, but if it did, the stock price could drop to a $65/share support line, “Buy Point 2”. Then if it continues to fall, it could drop to $43/share, or “Buy Point 3”.
For extra data points, I have a few other technical charts which are quite interesting. For example, Amazon has broken its ~20-year trend line, shown by the white line below. This line stems from 1998 to 2023. Many people will see the fact it has broken the trend line as a “bearish” sign. However, I believe trendlines indicate a “zone” and thus I would say it is only slightly over the trend line. Thus, this will be an interesting one to watch moving forward.
Amazon 20 Year Trend Line (BearcoinXBT)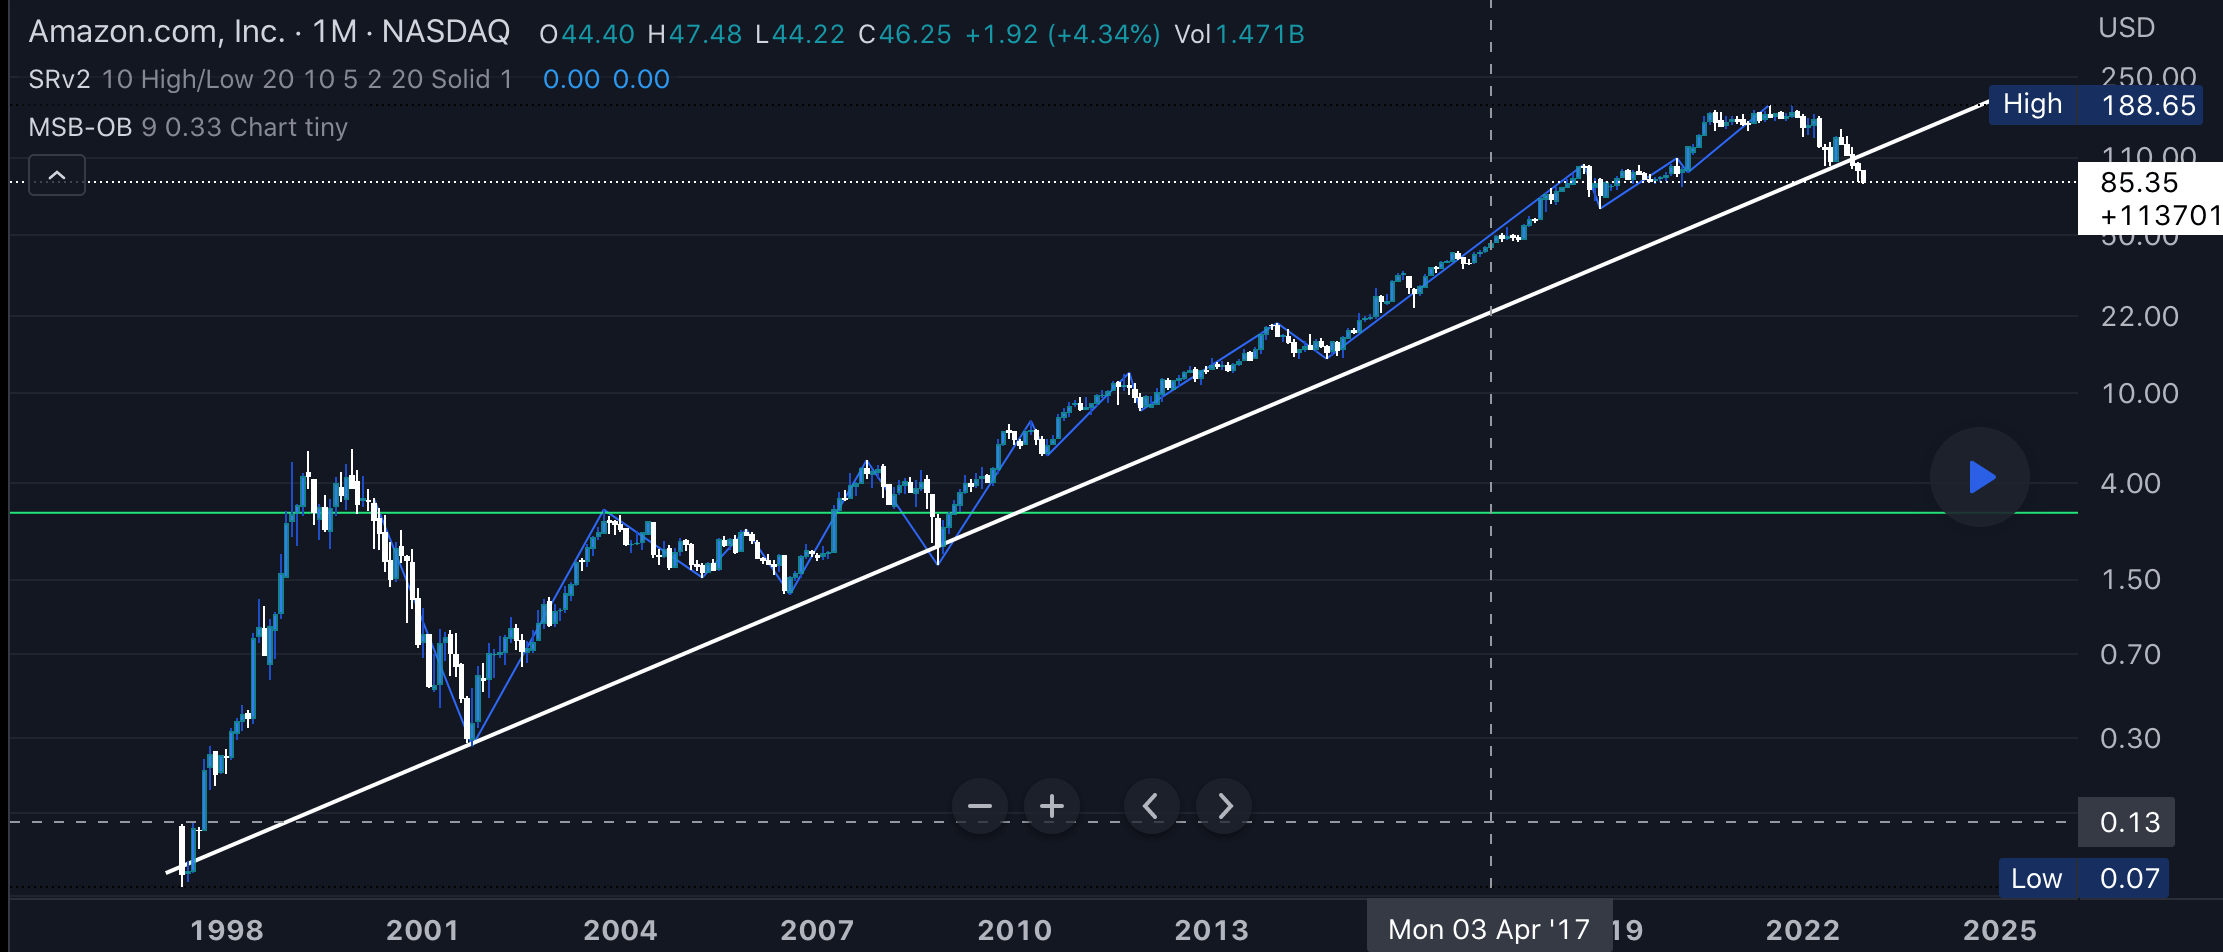
On the below chart, I have outlined its 50-day moving average (light green line) and 200-day moving average (blue line). Amazon is now above its 50-day moving average, and thus this could act as support if the stock drops below $98 per share. In addition, the stock price is still well below its 200-day moving average. Therefore, if the stock price continues on its bullish rebound, it is likely to hit this line at ~$118/share. If you look at the two previous share price peaks, you can see it hit the blue line (200 day moving average), thus this trend seems likely again.
Below 50 day and 200 day moving average (Created by author Deep Tech Insights)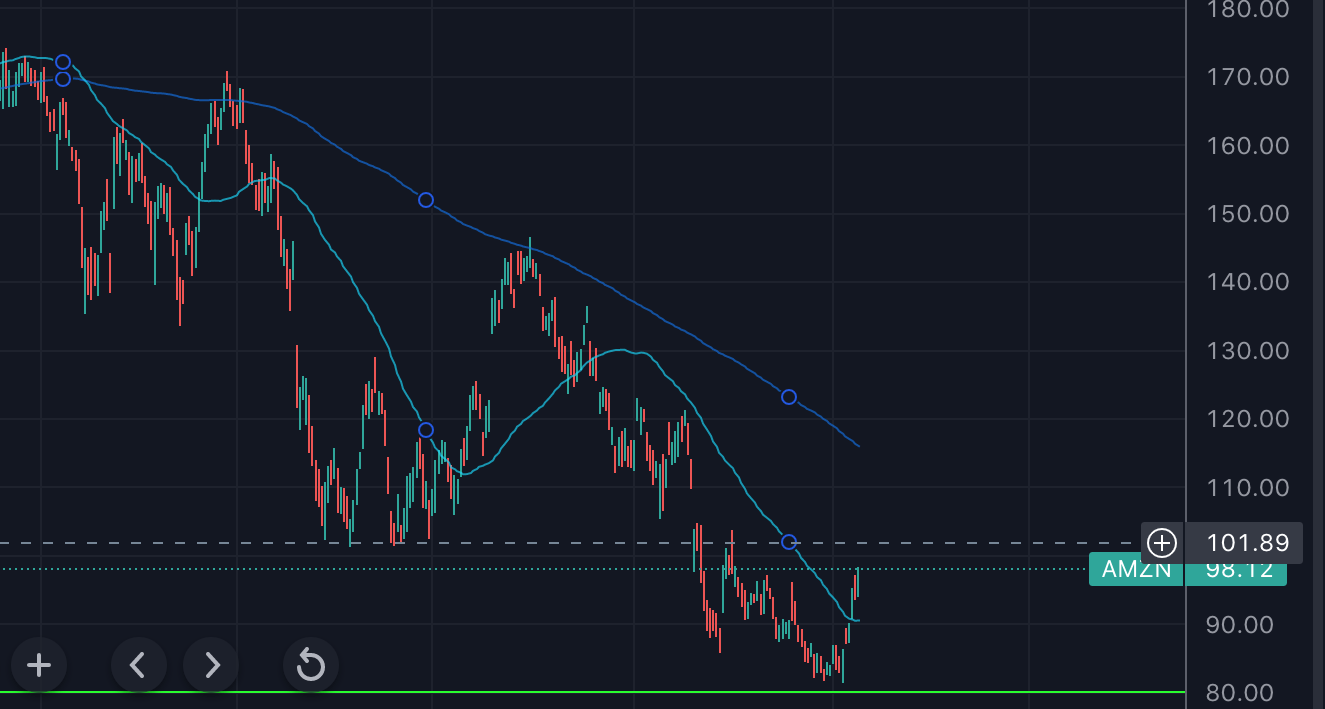
Financial Recap and Advanced Valuation
In previous posts on Amazon, I have covered its financials in great detail, so here is a very brief recap. Amazon reported volatile financial results for the third quarter of 2022. Its revenue was $127.1 million, which increased by 15% year over year, but missed analyst estimates by $370 million. This was mainly driven by foreign exchange rate headwinds and a tepid e-commerce environment. Its cloud business [AWS] was still solid with $20.5 billion in revenue reported, which rose by a rapid 28% year over year.
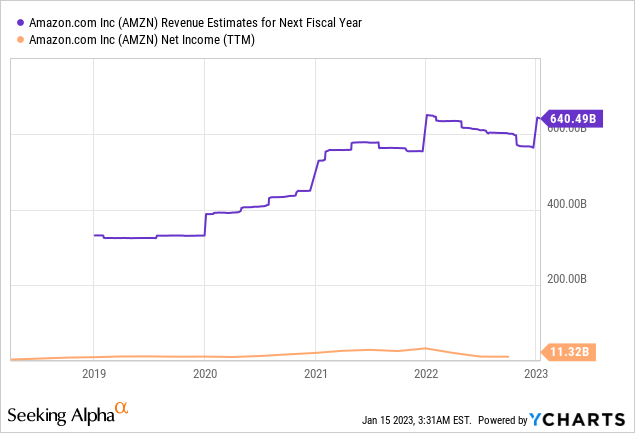
Amazon’s profitability was the main issue in the third quarter. The company reported an eye-watering 48% decline in net income to $2.5 billion. This was driven by the high inflation environment, which resulted in higher freight, oil, and labor costs. Its fulfillment expenses rose by 11% year over year to $20.6 billion.
A positive for Amazon (and many companies) is the latest inflation numbers show the consumer price index [CPI] is still falling. In the latest report just announced in 2023, the inflation rate in December 2022 was just 6.5%, which is the lowest level since October 2021. This is down from 7.1% in the prior month and its 9.1% peak in June 2022. This was driven by a continued fall in energy prices, namely oil, which has dropped from its $120/barrel peak in May 2022, to ~$80/barrel in December 2022. This positive news should directly improve Amazon’s operating margin, as it will likely result in lower logistics costs for its fulfillment.
Inflation rate CPI (Trading Economics)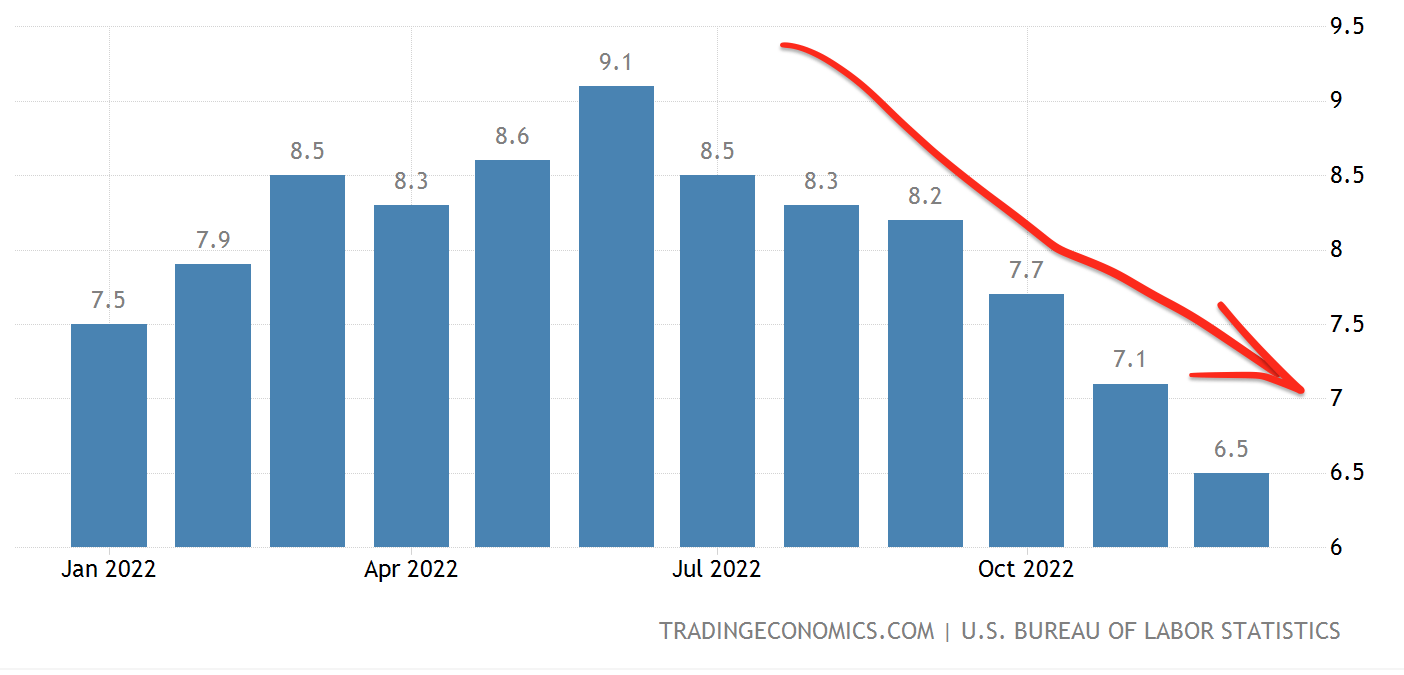
In order to value Amazon, I have plugged its latest financials into my discounted cash flow valuation model. I have forecast a 10% revenue growth rate for next year. This is fairly conservative as less than the prior 15% growth rate. I am forecasting this lower growth due to tough economic conditions and an expected recession. In years 2 to 5, I have forecast an 11% growth rate per year, as economic conditions improve.
Amazon stock valuation 1 (created by author Deep Tech Insights)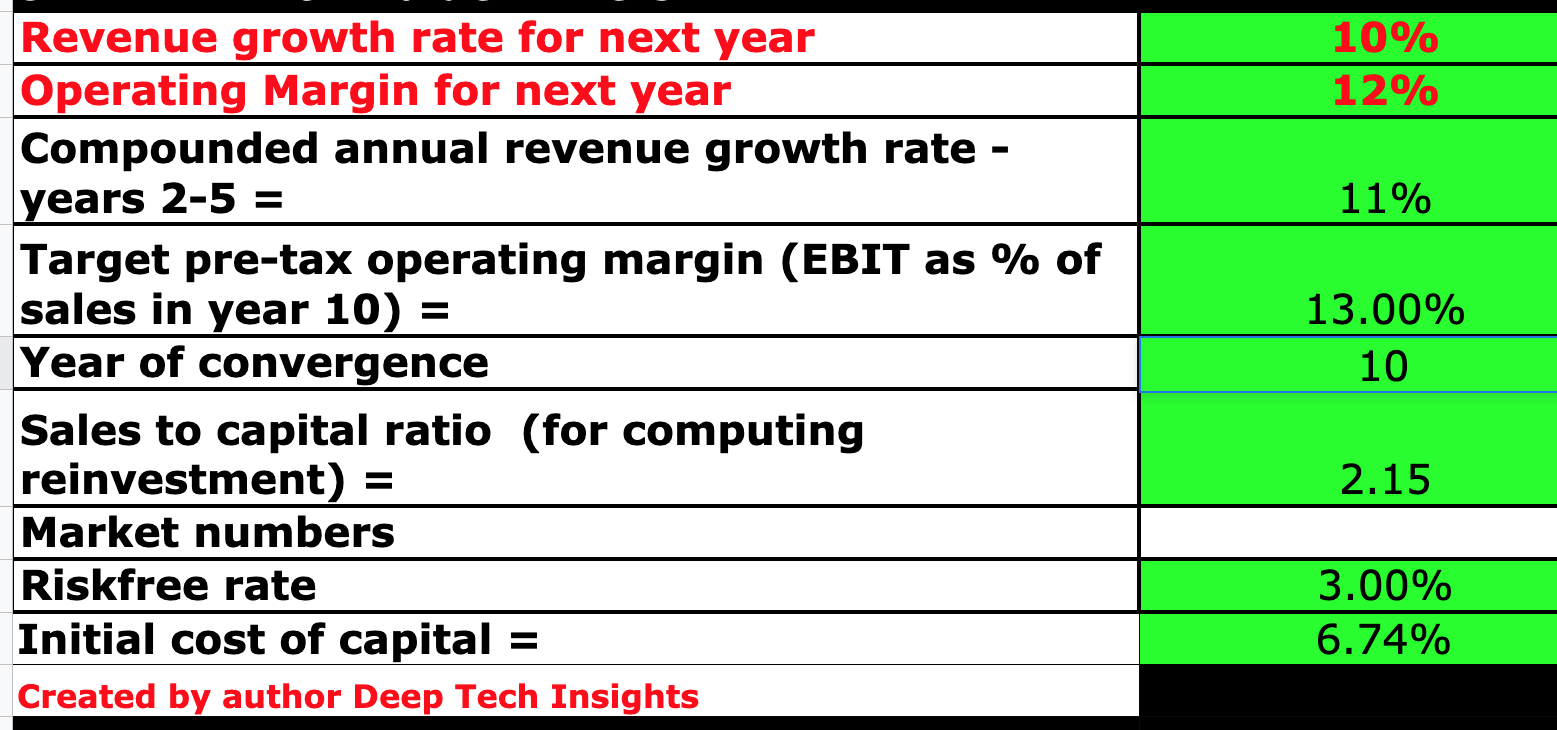
To increase the accuracy of the model, I have capitalized R&D expenses, which has lifted the operating margin. In addition, I have forecast a pre-tax operating margin of 13% over the next 10 years. I expect this to be driven by the continued decline in inflation and growth in its cloud segment as per the current trend.
Amazon stock valuation 2 (created by author Ben at Motivation 2 Invest)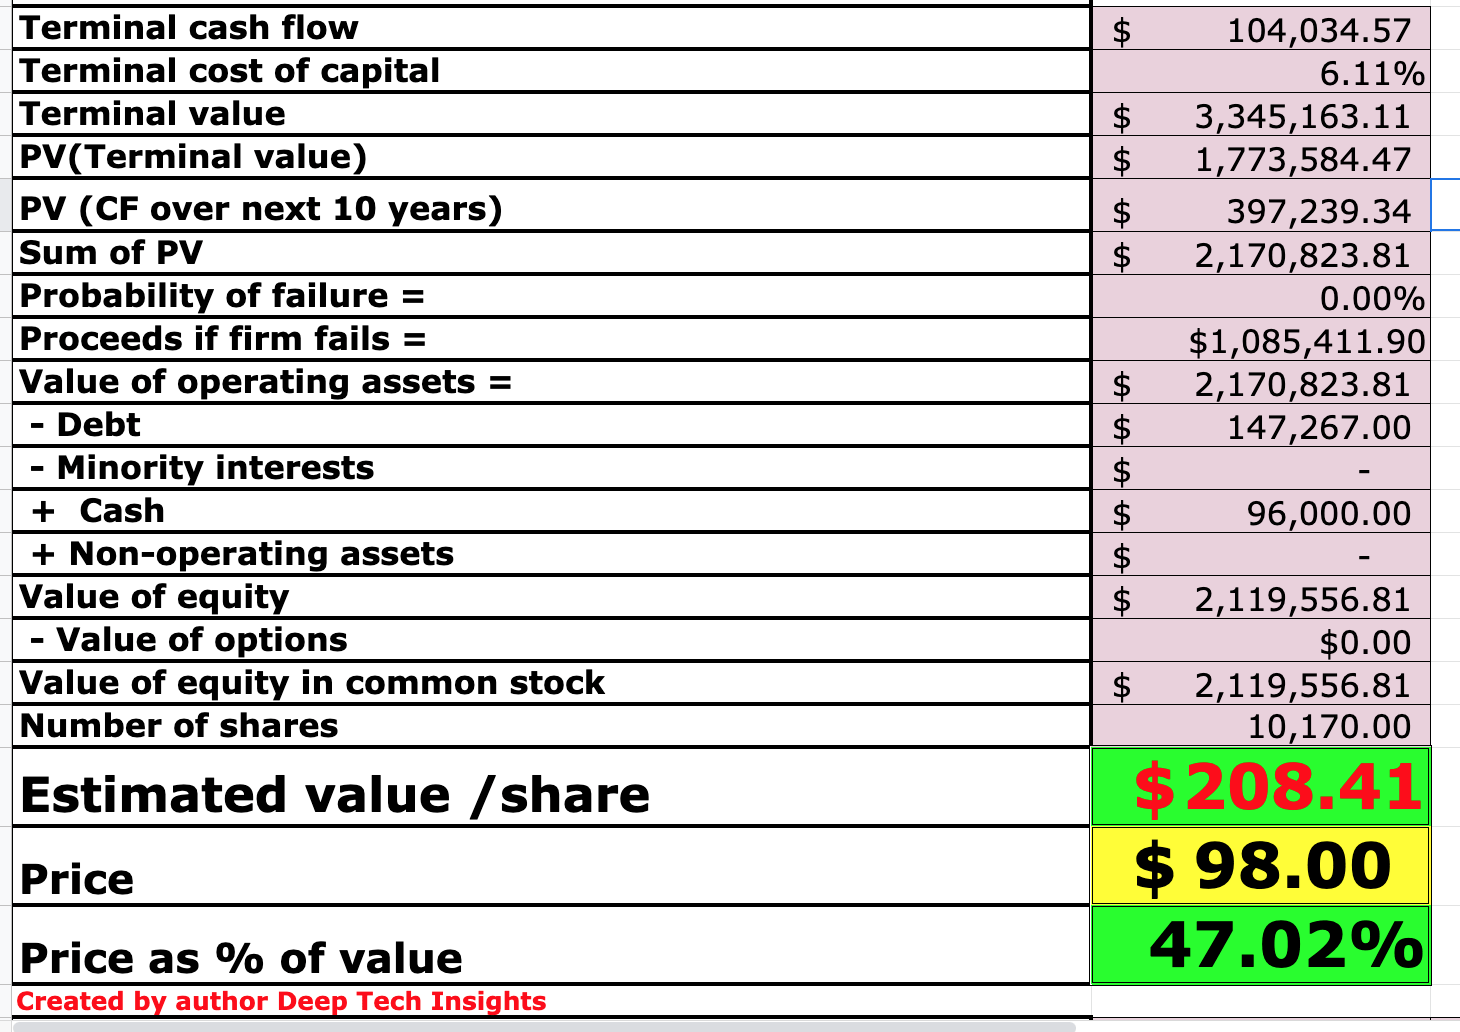
Given these factors I get a fair value of $208 per share, its stock is currently trading at $89 per share, thus the stock is over 50% undervalued or “deeply undervalued”.
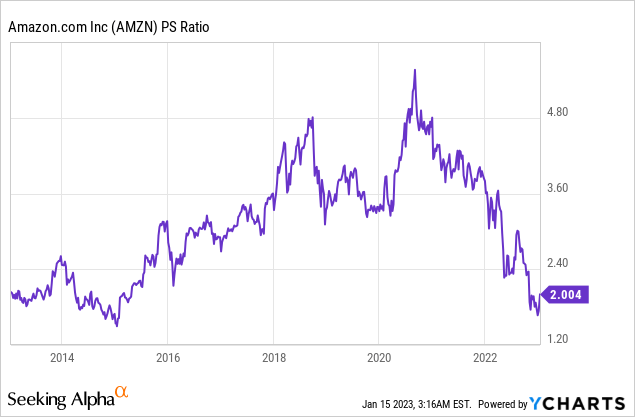
Amazon also trades at a price-to-sales ratio = 2, which is 40% cheaper than its 5-year average.
Risks
Recession/Lower Consumer demand
Many analysts have forecast a recession in 2023, this is expected to be driven by the rising interest rate environment and high inflation environment. We are seeing a positive decline in inflation, but it is still well above the Fed’s 2% target. In addition, the rising interest rate environment increases debt servicing costs for variable mortgages, which means the consumer has less cash in their pocket. This directly impacts companies such as Amazon, which benefit from a consumer which regularly spends.
Final Thoughts
Amazon is the king of e-commerce, with a strong company culture and a vast fulfillment footprint. The company has many competitive advantages, from its sheer scale to its best-in-class technology. I forecast its cloud business will continue to grow rapidly, driven by digital transformation tailwinds. Its technical chart is looking tasty, and its stock is undervalued. Thus, Amazon looks to be a great long term investment.
Be the first to comment