

ablokhin/iStock Editorial via Getty Images
Price Action Thesis
We follow up on our previous update of Amazon (NASDAQ:AMZN) with a detailed price action analysis, as we observed significant developments in its price action.
In late May, AMZN formed a validated bear trap (significant rejection of selling momentum) and set up its near-term support. However, the market resolved that bear trap with a bull trap (significant rejection of buying momentum) in June, forming its near-term resistance.
Notably, the series of lower high bull traps don’t augur well to recover its medium-term uptrend, as AMZN remains deeply mired in a bearish bias. Also, we have not observed a double bottom bear trap (a form of potent bear trap) that could help stanch its bearish momentum and turn the tide to recover its bullish bias subsequently.
As a result, we believe the risk/reward profile on AMZN is still not attractive enough, even though it should be at a near-term bottom. Therefore, we urge investors to be patient and wait for a deeper retracement to its intermediate support ($80) before considering adding exposure.
Our reverse cash flow model indicates that AMZN’s valuation is better balanced. However, given its bearish bias and relatively weak free cash flow (FCF) profitability, we believe asking for a higher margin of safety is appropriate.
As such, we reiterate our Hold rating on AMZN stock.
AMZN – We Missed Its Double Top And Paid The Price
AMZN price chart (monthly) (TradingView)
An unmistakable double top bull trap formed in July 2021 that we missed as we didn’t pay sufficient attention to its price action previously. Because if we did, we would never have missed it. The growth stocks collapse has taught us valuable lessons never to dismiss the prowess of the market, and to respect early warning signals from the market when significant bull/bear traps form.
AMZN price chart (weekly) (TradingView)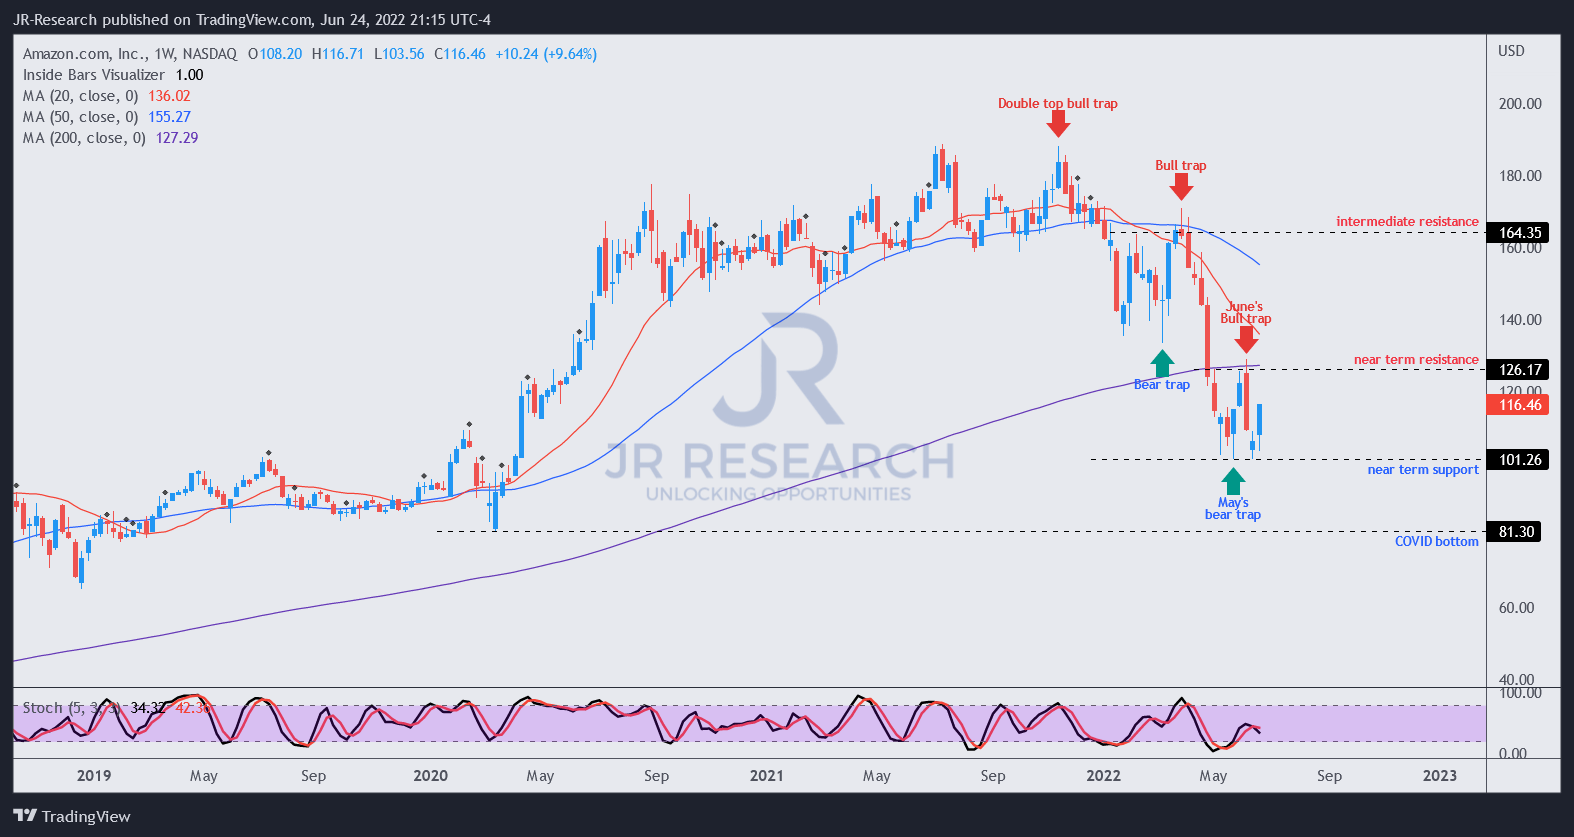
A series of lower high bull traps then dominated AMZN’s price action. But, the double top decisively ended its distribution phase (market selling slowly to prevent steep falls).
Accordingly, the market started to force rapid liquidations in AMZN stock. But, the adverse price action had preceded the revelations of its internal and macro headwinds impacting its e-commerce business. Therefore, price action provides investors with a forward-looking perspective of what the market is thinking.
Notably, its May bear trap has been resolved by another lower high bull trap in June (which is not constructive). If the market had intended for AMZN to retake its bullish bias, such lower high bull traps should not occur, and therefore, confirming its bearish momentum.
Given the forward-looking perspective of the market, we believe its e-commerce and macro headwinds have been priced in. The critical question is, to what extent? And whether its current valuation represents an attractive entry point for investors to consider.
We believe AMZN is at a near-term bottom. However, its June bull trap is unconstructive for its recovery, and we would prefer to watch how the price action re-tests its near-term resistance ($126) and assess the outcome before revising our rating. Also, given the proximity of its resistance level, we don’t think the risk/reward profile of adding exposure here is attractive enough.
AMZN – Valuation Is More Well-Balanced
Despite its massive sell-off over the past six months, AMZN still delivered a 5Y CAGR of 18.31% (Vs. 10Y CAGR of 26.46%), and above the Invesco QQQ ETF’s (QQQ) 5Y CAGR of 15.82%. Therefore, if we zoom out to its 5Y average performance, it’s far from a disaster but a relatively healthy mean reversion from its frothy valuation levels.
| Stock | AMZN |
| Current market cap | $1.18T |
| Hurdle rate (CAGR) | 18% |
| Projection through | CQ2’26 |
| Required FCF yield in CQ2’26 | 2.9% |
| Assumed TTM FCF margin in CQ2’26 | 7.5% |
| Implied TTM revenue by CQ2’26 | $888.28B |
AMZN reverse cash flow valuation model. Data source: S&P Cap IQ, author
We can parse how the market has valued AMZN over time using a reverse cash flow model. We applied a hurdle rate equivalent to its 5Y CAGR of 18%. As such, we also used the 5Y mean of its FCF yield of 2.9%. However, we used a lower TTM FCF margin of 7.5% (compared to the Street’s consensus) to provide some margin of safety.
Investors need to carefully consider AMZN’s FCF profitability, which has impacted its valuation over the past year. Due to the size of its lower-margin retail model, it markedly affects its higher-margin AWS and advertising business. Therefore, investors cannot just consider AWS as the critical driver but accord less significance to its retail business. Notably, due to its weak FCF profitability, its valuation is highly sensitive to changes in its FCF margins, as seen in FY21 (-3.1%) and FY22 estimates (2.7%).
Therefore, some authors have cautioned that Amazon is highly susceptible to operating leverage/deleverage, which is spot on. As a result, Amazon’s move to improve its fixed costs leverage due to its past two years of excesses is commendable. But, it also highlighted a significant risk that investors may not have considered carefully before (including us): investing in its massive lower-margin retail business. Hence, investors should not just consider the upside of leverage but also the downside of deleverage and adjust their estimates of its FCF profitability accordingly.
Therefore, we think AMZN stock seems more well-balanced, but its risk/reward profile is not attractive enough. Moreover, the market is unlikely to re-rate it higher, given slower topline growth expectations. For instance, if we adjusted our entry level to its near-term resistance of $126, we would require AMZN to deliver a TTM revenue of $961B by CQ2’26, which is unlikely. Therefore, the bull trap seen at its near-term resistance is apt. As such, we posit that AMZN is unlikely to recover its medium-term bullish bias for some time.
Is AMZN Stock A Buy, Sell, Or Hold?
We reiterate our Hold rating on AMZN stock. Its price action indicates a near-term bottom. However, we believe the significant bull trap in June will continue to keep AMZN mired in a bearish bias for a while.
Our valuation analysis also corroborates our price action. Therefore, we believe the risk/reward profile of adding AMZN stock at the current levels is not attractive enough.
We urge investors to be patient and consider a possible re-test of its intermediate support ($80) before adding more positions.
Be the first to comment