

Getty Images/Getty Images Entertainment
From the humble beginnings of its early days to now being one of the most influential enterprises of our day, Amazon’s (NASDAQ:NASDAQ:AMZN) journey has been a long story of success.
However, extrapolating past share price performance into the future is one of the biggest mistakes an investor could make, especially as we enter a pivotal point in the level of intervention in the financial markets.
During such periods narratives around growth stocks usually get increasingly stronger with lots of bells and whistles attached to long-term expected growth and total addressable markets.
Amazon Project Kuiper (www.aboutamazon.com)
While there’s nothing inherently wrong with an exciting narrative around a highly successful and high-growth enterprise, Amazon’s business fundamentals do not appear to be in the driver’s seat of its share price anymore. Moreover, the company also faces significant idiosyncratic risks that other tech giants are not subject to.
Seeking Alpha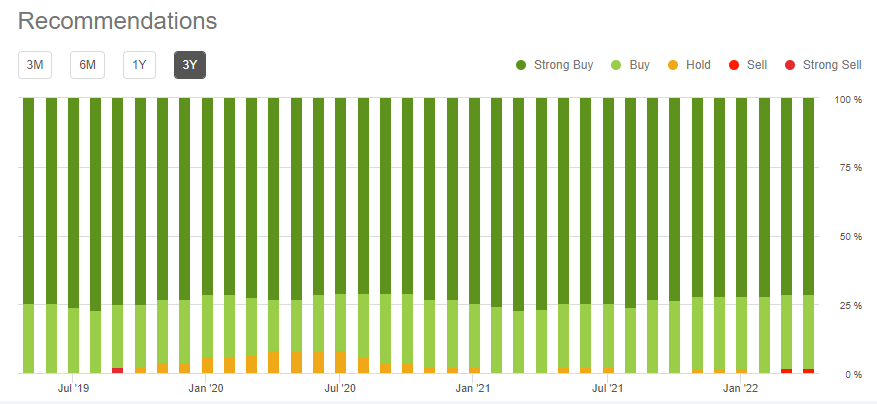
To properly understand this highly controversial thesis for a company that gets nothing but positive ratings about its future, we first need to have a closer look at the heavily distorted equity market and why past performance is a poor reference about the future. Then we will look at how momentum trade impacts the performance of each of the top 10 largest U.S. publicly listed companies. Lastly, we will bring everything together in the context of Amazon’s business fundamentals and I will show you why I believe the company faces poor future expected returns, even if it continues to deliver on its strategy.
The Winners Of A Heavily Distorted Equity Market
The past decade was marked by the total dominance of the tech giants that now occupy the top in terms of market cap. On one hand, these companies disrupted many industries through technological innovation and on the other their high-growth profile benefited from the significant reduction in cost of capital.
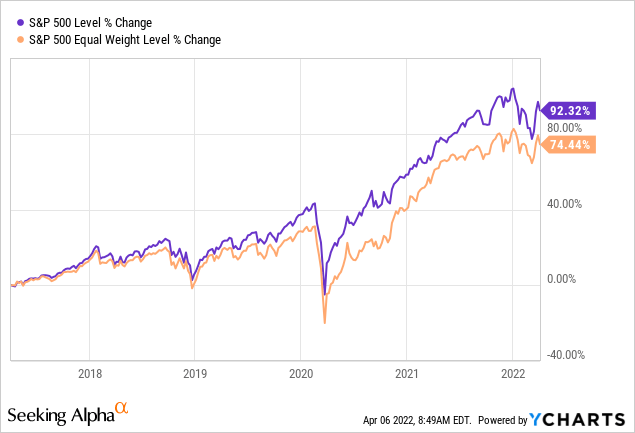
The pandemic and the followed fiscal and monetary response accelerated this trend even further, with the S&P 500 significantly outperforming its equal weighted counterpart.
As a matter of fact, one could have easily beaten the market on an absolute basis, with a very wide margin, by just buying the 10 largest companies of the S&P 500.
Prepared by the author, using public data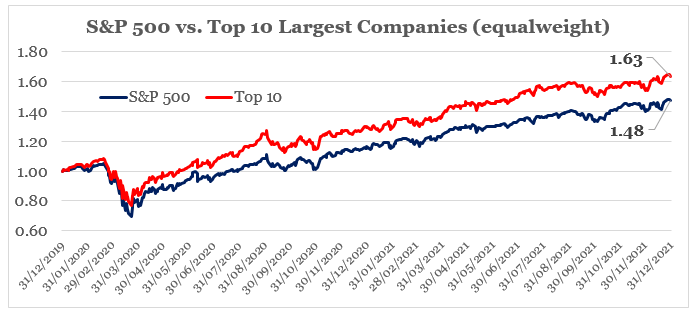
* Top 10 companies as of end of 2019
The problem of blindly following such a strategy is twofold. Firstly, it does not work over the long-term as the equal-weighted S&P 500 has actually been a more sound investment over the long run (see below).
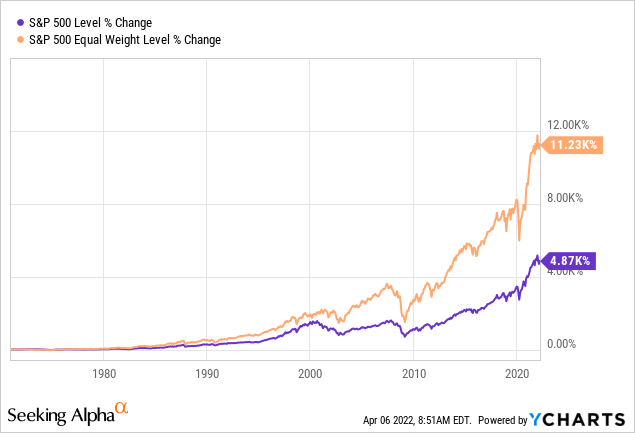
Secondly, the level of monetary and fiscal intervention that we saw during the past decade is unsustainable. Of course, trying to time the market on when a policy shift would occur is futile exercise, however, blindly extrapolating recent trends is a more foolish concept in my view.
fred.stlouisfed.org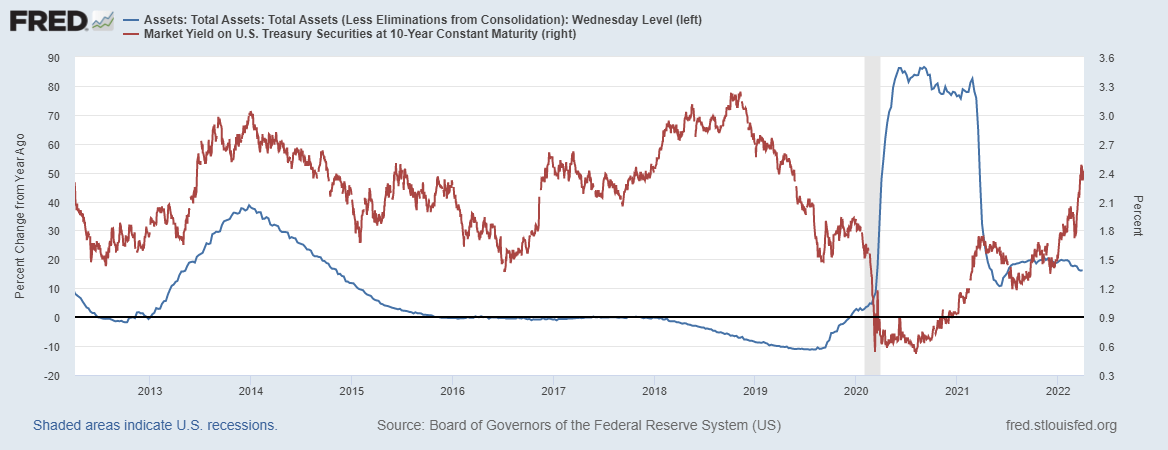
Implications For Growth Companies
One way to quantify the impact of the extremely loose monetary and fiscal policy is to look at the relative performance of iShares Edge MSCI USA Momentum Factor ETF (MTUM) versus iShares Edge MSCI USA Value Factor ETF (VLUE).
The reason why an index taking a long position in MTUM and a short position in VLUE is a good measure of the level of intervention in the equity market is that high-growth momentum companies are usually high duration as well, while the less attractive value companies are on the opposite side.
Therefore, as the level of interest rates is kept superficially low and risk-seeking behavior has been incentivized through extraordinary amount of liquidity, we would expect the former to significantly outperform the latter. This is illustrated in the graph below where the daily excess returns of MTUM over VLUE are indexed to 100 as of April of 2013.
Prepared by the author, using public data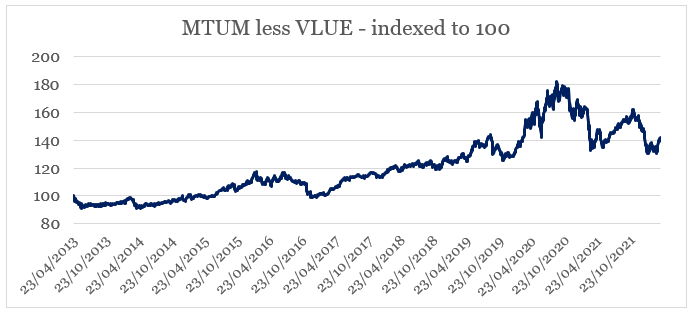
Having said all that, it should come as no surprise that the level of treasury yields is one of the key drivers of momentum stocks’ outperformance over value stocks.
Prepared by the author, using public data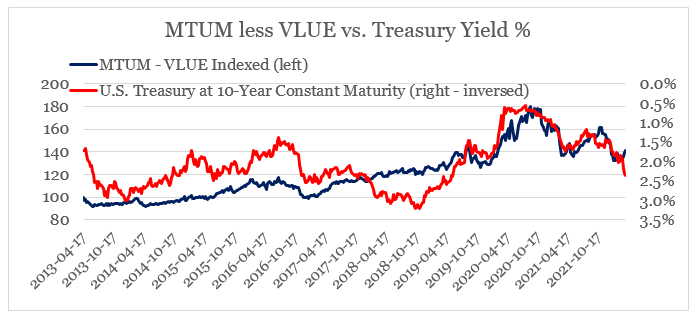
Therefore, it is not unreasonable to expect that as pandemic tailwinds for digital oriented businesses subside and monetary tightening is upon us, that the gap between momentum and value would most likely narrow down.
Another consequence of these events has been the extreme concentration of the U.S. equity market around a handful of companies that benefited from this unprecedented monetary intervention. At the moment, the 10 largest companies in the S&P 500 make up roughly 30% of the index and historically such extreme levels of concentration have not been sustainable and have also been a predecessor to sharp reversals in equity market returns.
Share Prices Detaching From Business Fundamentals
To properly understand the risk involved, we should quantify the degree to which each of those companies will be affected by a potential narrowing gap between value and momentum.
Down below are plotted the daily returns of each of the 10 largest S&P 500 companies relative to the returns of the MTUM less VLUE index over the past 6-months.
Prepared by the author, using public data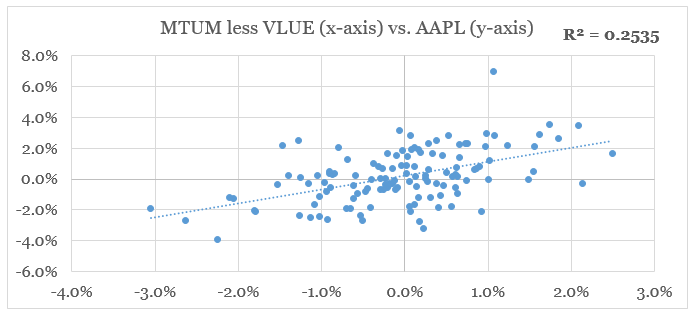
Prepared by the author, using public data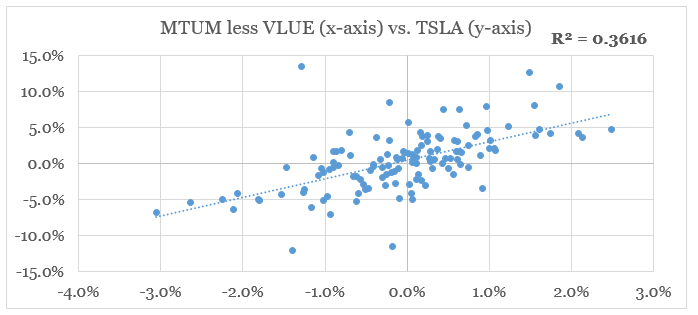
Prepared by the author, using public data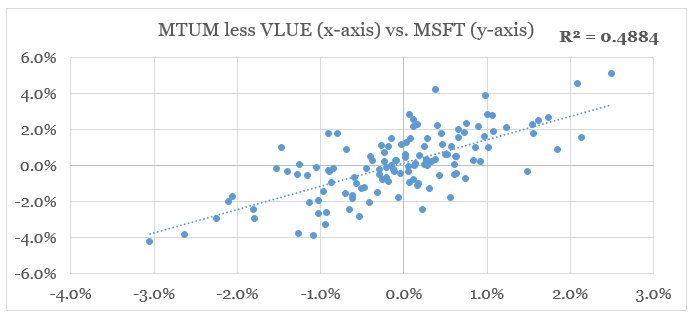
Prepared by the author, using public data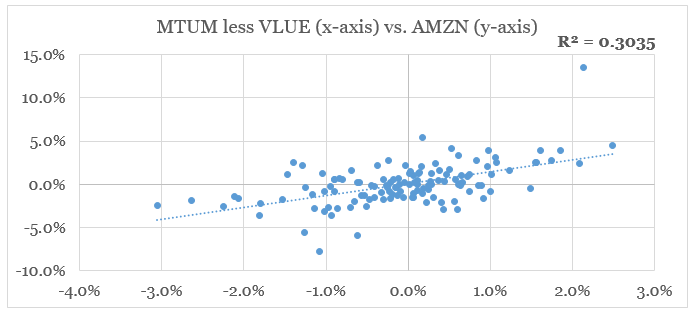
Prepared by the author, using public data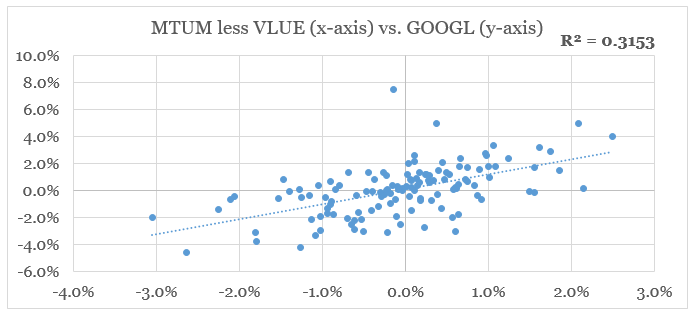
Prepared by the author, using public data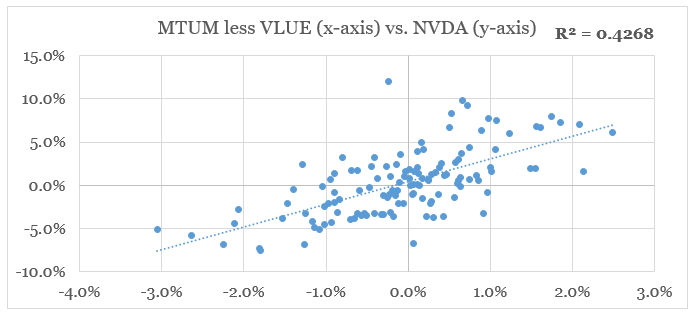
Prepared by the author, using public data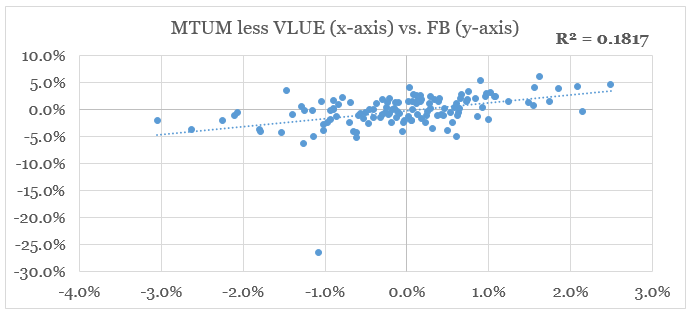
The other three companies do not exhibit a significant relationship with the MTUM less VLUE index.
- Berkshire Hathaway (BRK.B)
Prepared by the author, using public data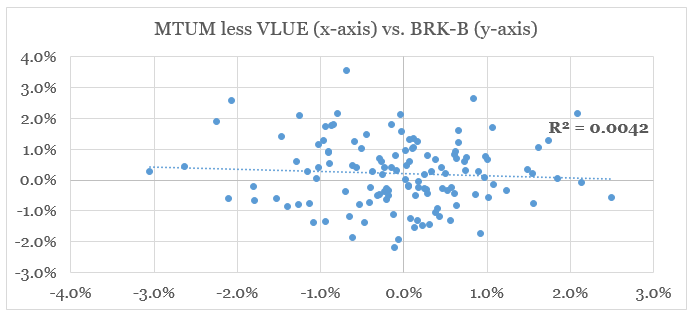
Prepared by the author, using public data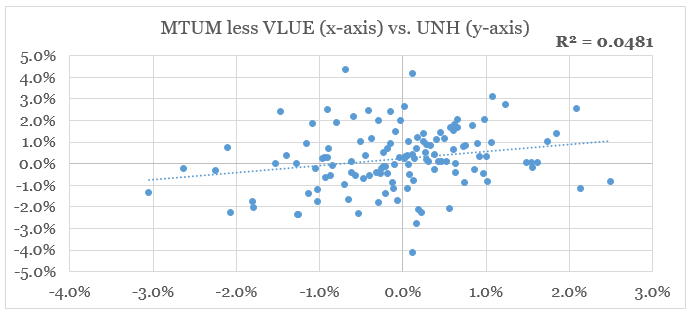
Prepared by the author, using public data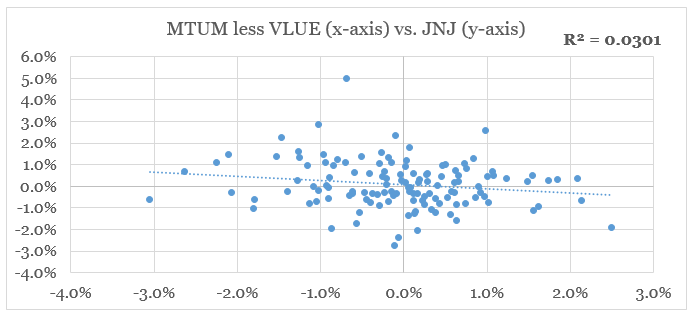
By ranking all these companies by their R-squared with the index, we could see that Microsoft, Nvidia and Tesla were by far the biggest beneficiaries of the momentum trade, while UnitedHealth, Johnson & Johnson and Berkshire Hathaway did not experience significant uplift.
Prepared by the author, using public data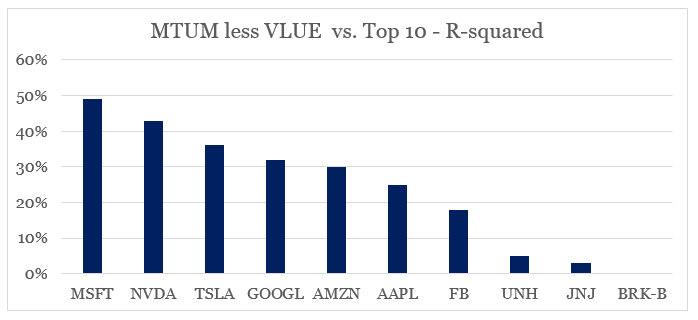
Last year I showed why these developments are causing Nvidia and Tesla stock prices to become detached from their fundamentals in two thought pieces called: “Nvidia: Fundamentals Matter Less Than Ever” and “Tesla: The Narrative Bias“.
Microsoft, on the other hand, is the most heavily exposed to this momentum trade, but as we will see down below Amazon’s positioning appears far more riskier at the moment.
Amazon Stands Out
Firstly, we should mention that Tesla, Microsoft and Nvidia (and even Alphabet) are among the largest holdings of the Momentum Factor ETF (MTUM).
iShares MSCI USA Momentum Factor ETF Holdings (ishares.com)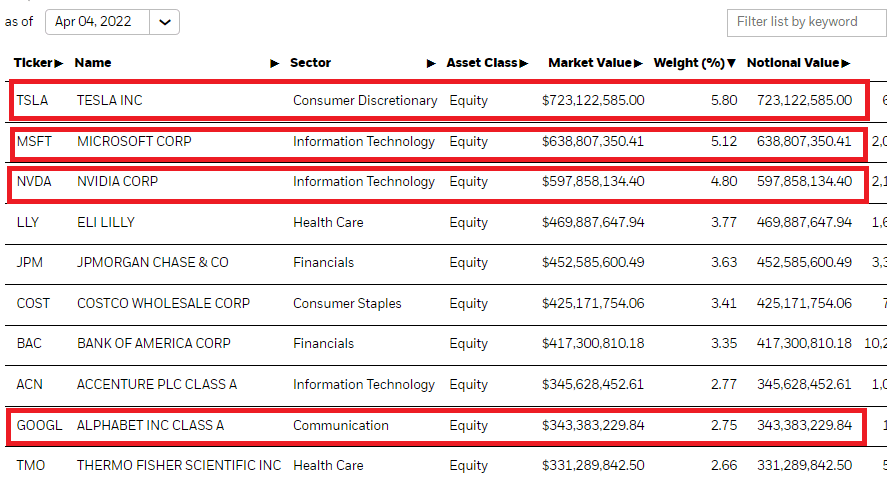
Naturally, this will cause these three companies to exhibit a far stronger relationship with the MTUM less VLUE index than the rest of the enterprises listed above. What is surprising, however, is that the R-squared of AMZN is quite high even though the company does not appear among the MTUM holdings.
Moreover, the six-month rolling correlation of Amazon daily returns vs. the index is also extremely high. In the graph below, we could see that the massive increase in Amazon’s share price following the pandemic was also accompanied by a significant increase in correlation as well.
Prepared by the author, using public data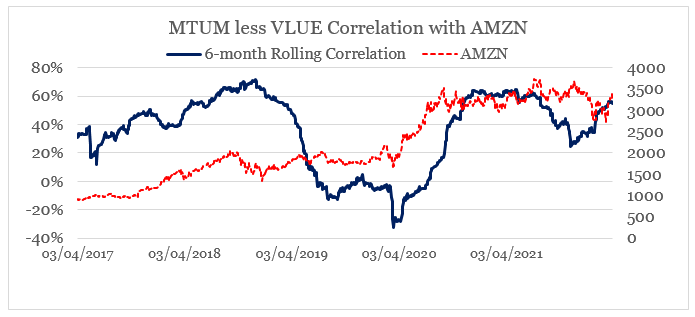
Business Fundamentals
On a cross-sectional basis, the top 10 companies of the S&P 500 exhibit a strong relationship between their forward P/E earnings ratios and their topline expected growth. While valuations of Tesla and Nvidia both are highly dependent on them achieving their ambitious growth plans, Amazon’s P/E ratio is significantly higher than what its projected growth would suggest.
Prepared by the author, using data from Seeking Alpha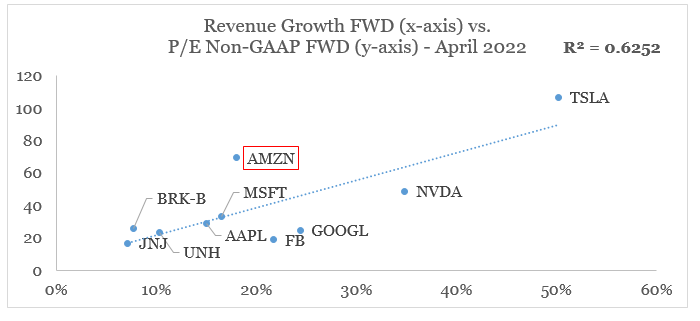
When comparing Amazon to Microsoft, for example, both companies have similar expected topline growth rates, while AMZN forward earnings multiple is nearly twice that of MSFT.
This matter is made worse when looking at these companies achieved profitability. Amazon is among the least profitable businesses on a gross margin basis, which is less impacted by size as operating and net income margins are.
Prepared by the author, using data from Seeking Alpha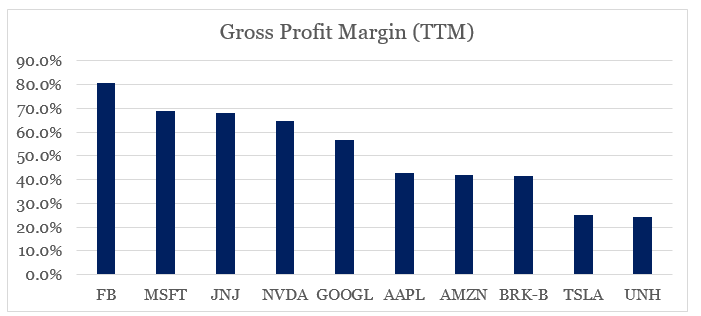
This brings us to the other area where Amazon appears far more risky than most of its big tech peers. Although all tech companies in the peer group above are almost equal in size, the size of Amazon’s workforce is enormous. In terms of human capital, Amazon is far more capital intensive than all other tech giants combined.
Prepared by the author, using data from various sources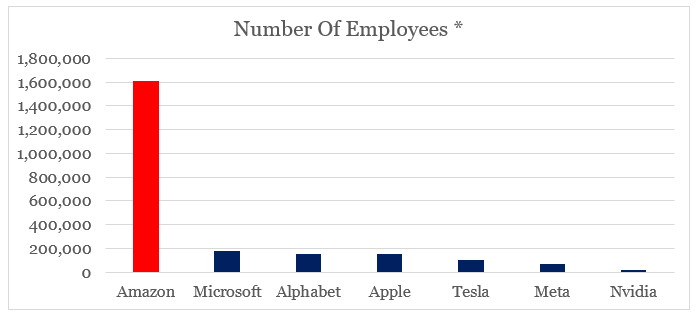
* based on the latest available information
This makes AMZN significantly more exposed to wage inflationary pressures (see below) and political risk as it is currently the second largest employer in the U.S. following Walmart (WMT).
fred.stlouisfed.org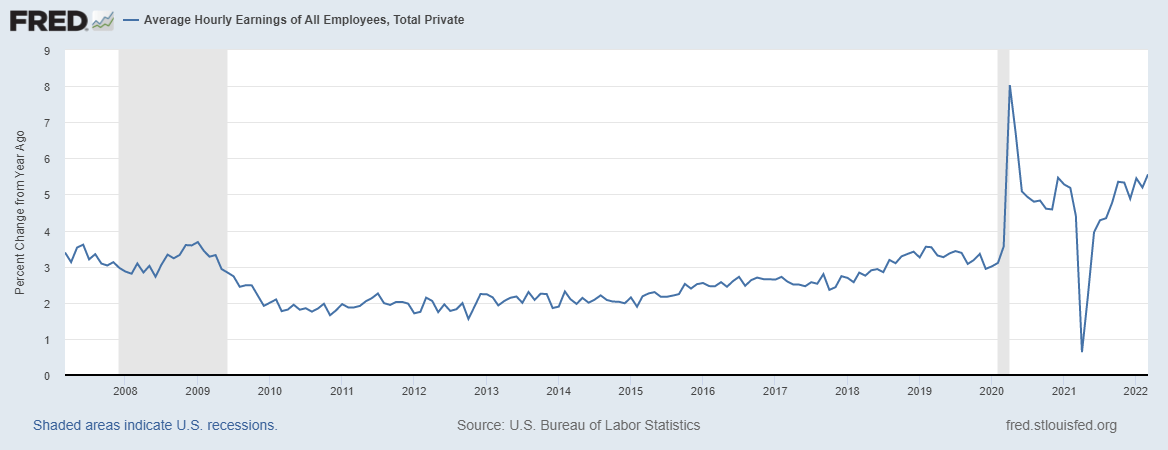
Excluding the AWS segment, Amazon sales increased significantly following the pandemic as more consumers opted for online shopping. While this trend is unlikely to reverse, one would expect that such a tailwind will also be accompanied by higher margins.
Prepared by the author, using data from Amazon 10-K SEC Filings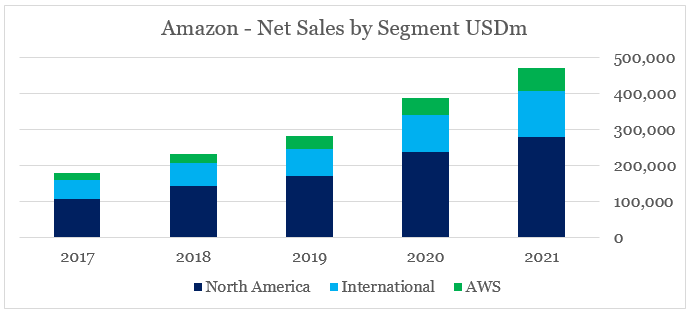
Unfortunately, this was not the case with profitability in North America and International segments already falling in 2021, while AWS continuing to be the sole driver of profitability.
Prepared by the author, using data from Amazon 10-K SEC Filings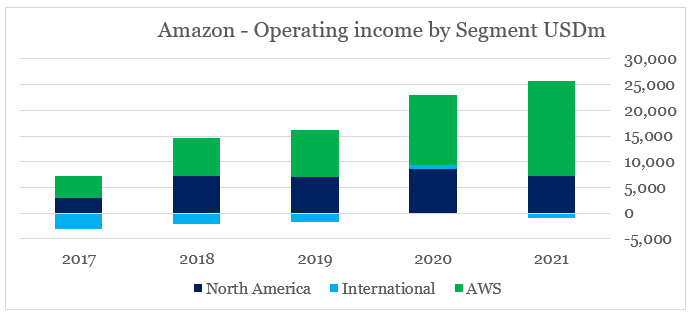
This symbiotic relationship has worked extremely well so far, however, it also highlights the idiosyncratic risks associated with subsidizing capital intensive retail operations through a highly profitable cloud business that will likely face intensified competition and possibly slowing topline growth. This is also in stark contrast with the likes of Microsoft and Nvidia, for example, which have problems of their own but are also pure plays in their respective industries.
Conclusion
Amazon’s strong competitive positioning and industry tailwinds would allow the company to achieve or even surpass the current revenue growth expectations. However, the company will need to improve its bottom line at an even faster pace, in order to justify its exceptionally high earnings multiple. So far, AWS remains the sole driver of profitability and even the pandemic tailwinds failed to provide a significant boost for the retail segment bottom line. When compared to the other tech giants, Amazon’s capital intensive business model also puts it at a disadvantage during inflationary periods and political risks should not be ignored either. Last but not least, Amazon’s share price is heavily exposed to the fading momentum trade which makes future upside dependent on ongoing monetary interventions.
Be the first to comment