

HJBC
Amazon (NASDAQ:AMZN) is the king of ecommerce with approximately 57% of U.S online sales being attributed to the company. The company benefited massively from the brick and mortar retail lockdown in 2020, and used this opportunity to aggressively expand both its employee count and operations. Since November 2021, Amazon has faced a tumultuous time as it has had to absorb higher fulfilment costs, as we entered a high inflation environment. In addition, rising interest rates compressed the valuation multiples of many “growth stocks” and decimated the on paper valuation of EV maker Rivian (an Amazon investment). Despite these factors, Amazon’s ecommerce market position remains unchallenged and the company has continued to lead the cloud market with AWS, that has consistently grown at a solid rate. I believe many people are still underestimated the cloud business of Amazon, as it is operates at a ~24% operating margin which makes it the key profit engine for the company. Amazon also has a strong culture, which focuses on a “day 1” mentality, frugality, customer obsession and the ability to experiment. Most companies just have a poster of the “culture principles” on the wall but Amazon lives and breathes this, by embracing it in its daily decisions. I had first hand experience of this as I did a contract with Amazon’s HQ many years ago. I believe this is a competitive advantage many investors overlook. In this post I’m going to breakdown Amazon’s latest financial report, as well as its cloud business before revealing my valuation model for the company, let’s dive in.
Mixed Financials
Amazon reported mixed financial results for the fourth quarter of 2022. Its revenue was $149.2 billion which beat analyst expectations by $3.43 billion and increased by ~8.59% year over year. Amazon has experienced a $5 billion foreign exchange rate headwind, thus on a constant currency basis revenue would have growth at a greater ~12% year over year. Its growth rate is lower than Q3,22 YoY level of 14.7%, but this was expected given the macroeconomic environment.
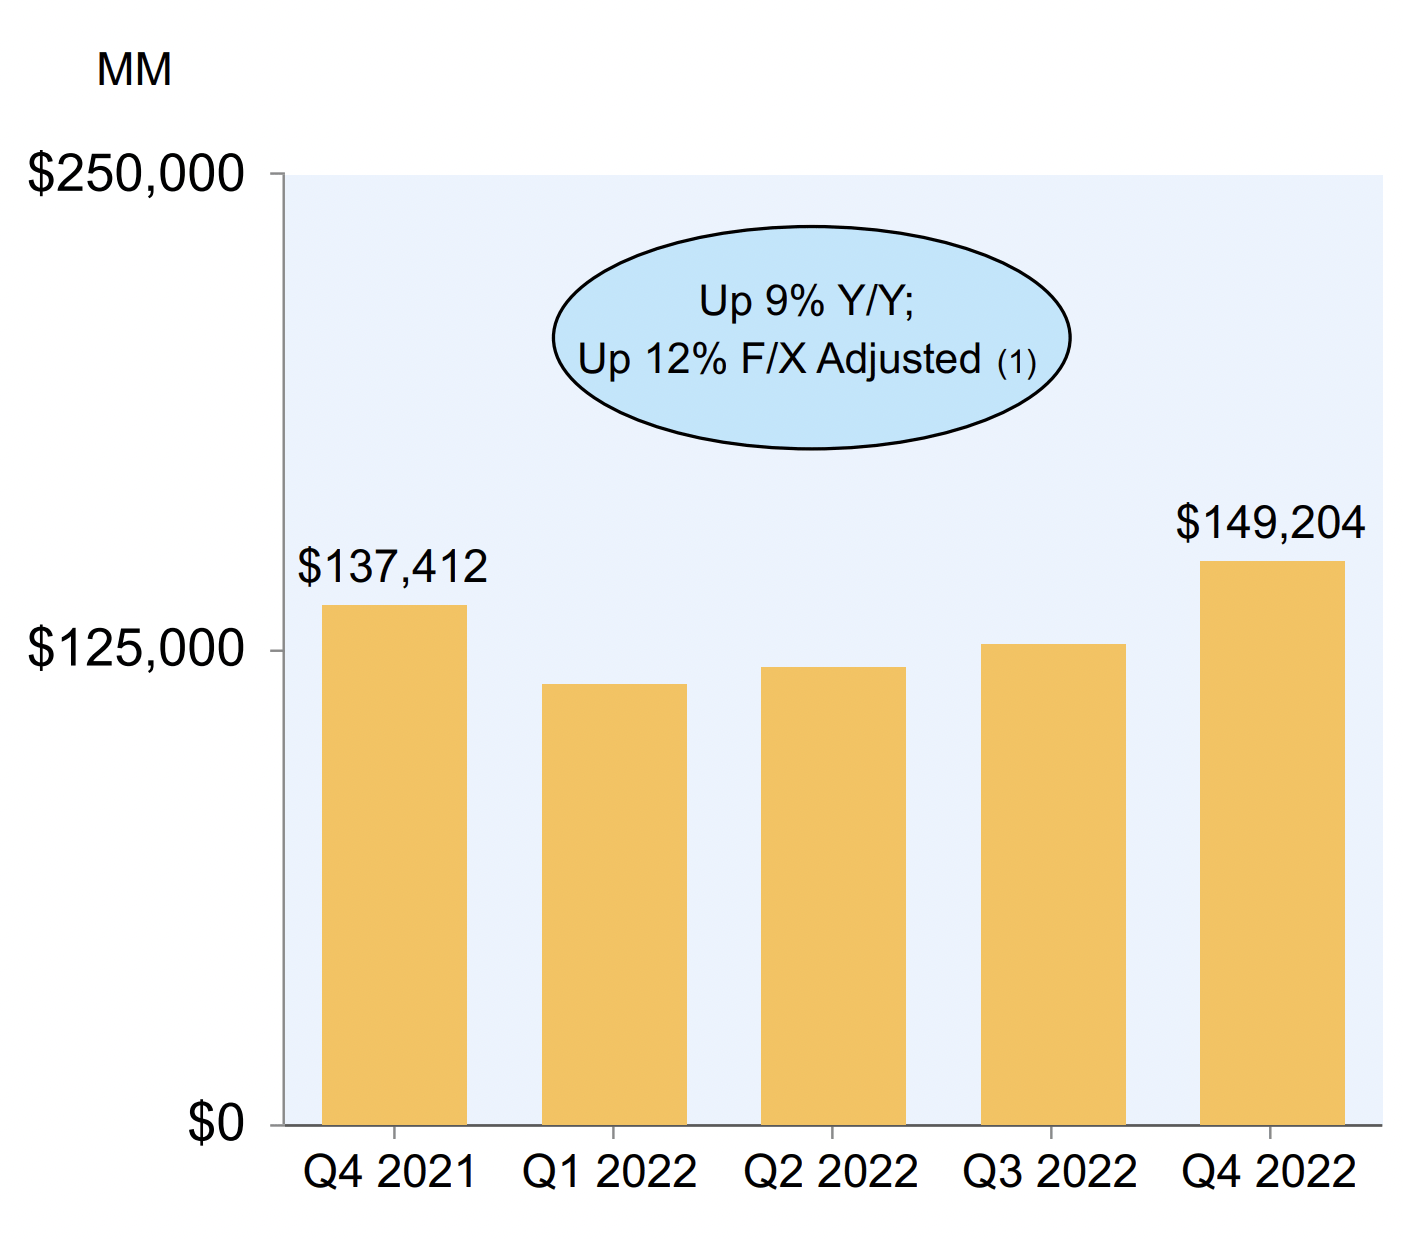
Revenue (Q4,22 presentation)
Breaking revenue down by region North America reported solid revenue growth of 13% year over year to $93.4 billion.
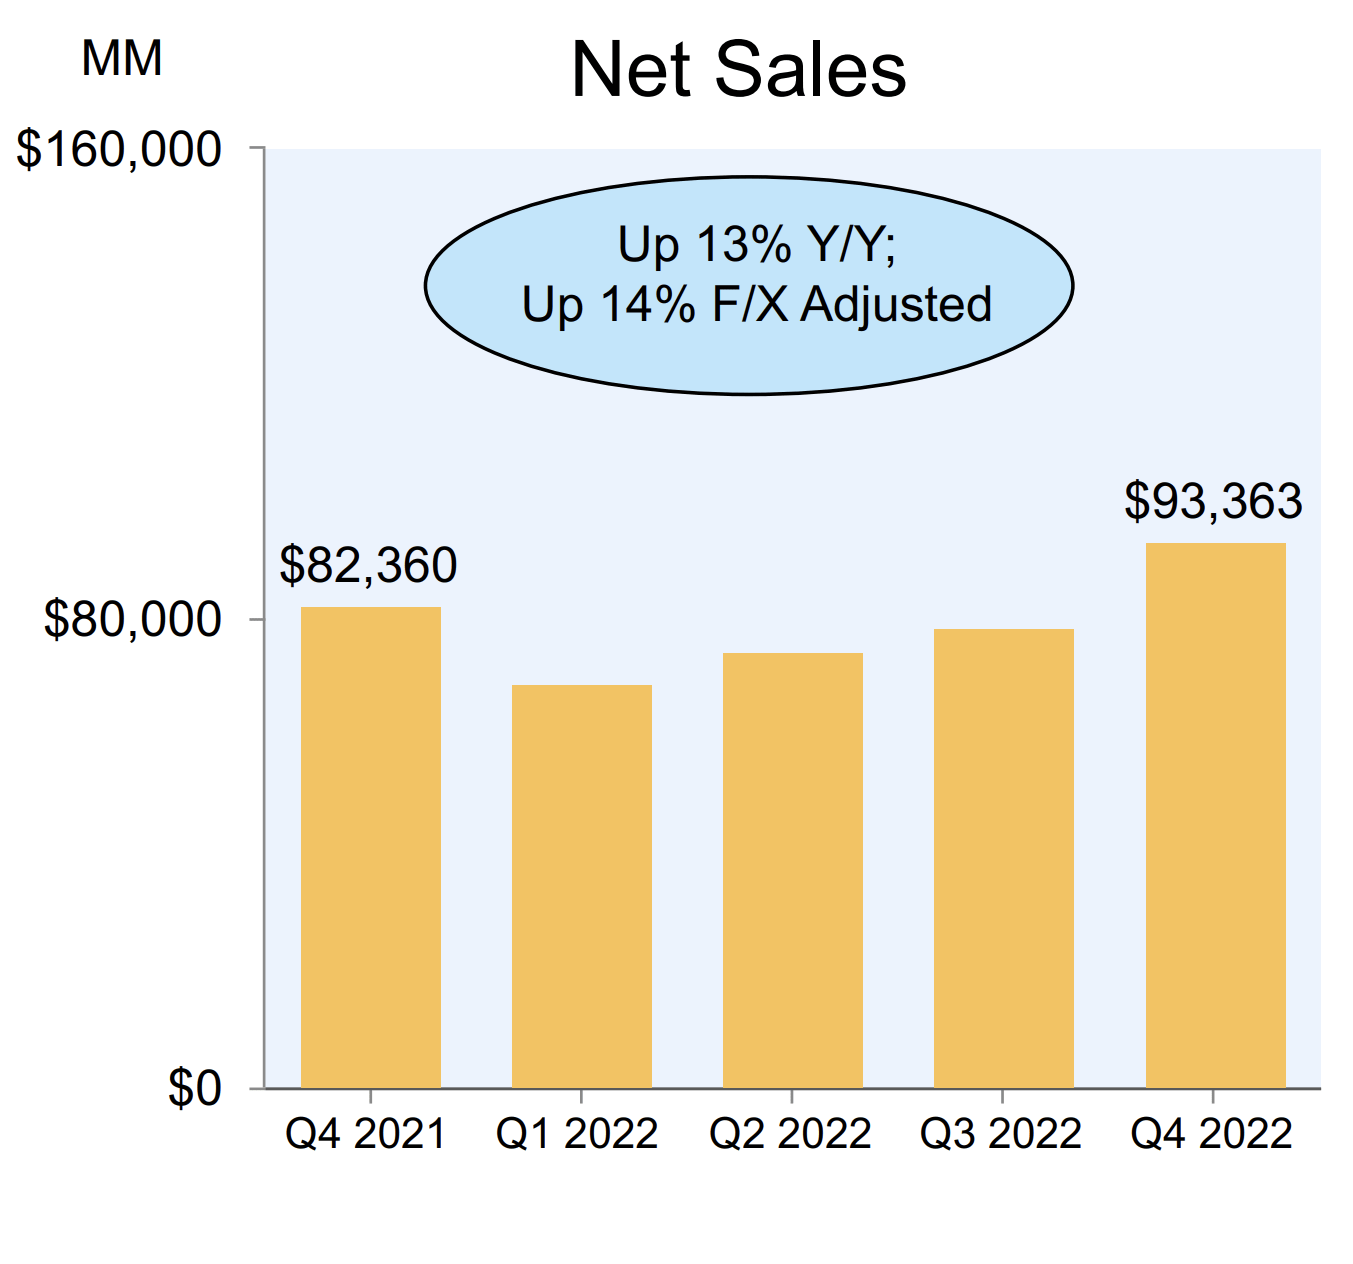
North America revenue (Q4,22 report)
The issue for Amazon was its International revenue which declined by 8% year over year to $34.5 billion. This was mainly driven by the aforementioned headwinds regarding foreign exchange rates due to a strong U.S dollar. In my previous post on Alphabet (Q4,22 results) I discussed a similar dynamic and also that I believe foreign exchange would correct as they tend to be cyclical by nature. Therefore on a constant currency basis Amazon actually reported +5% International revenue growth year over year.
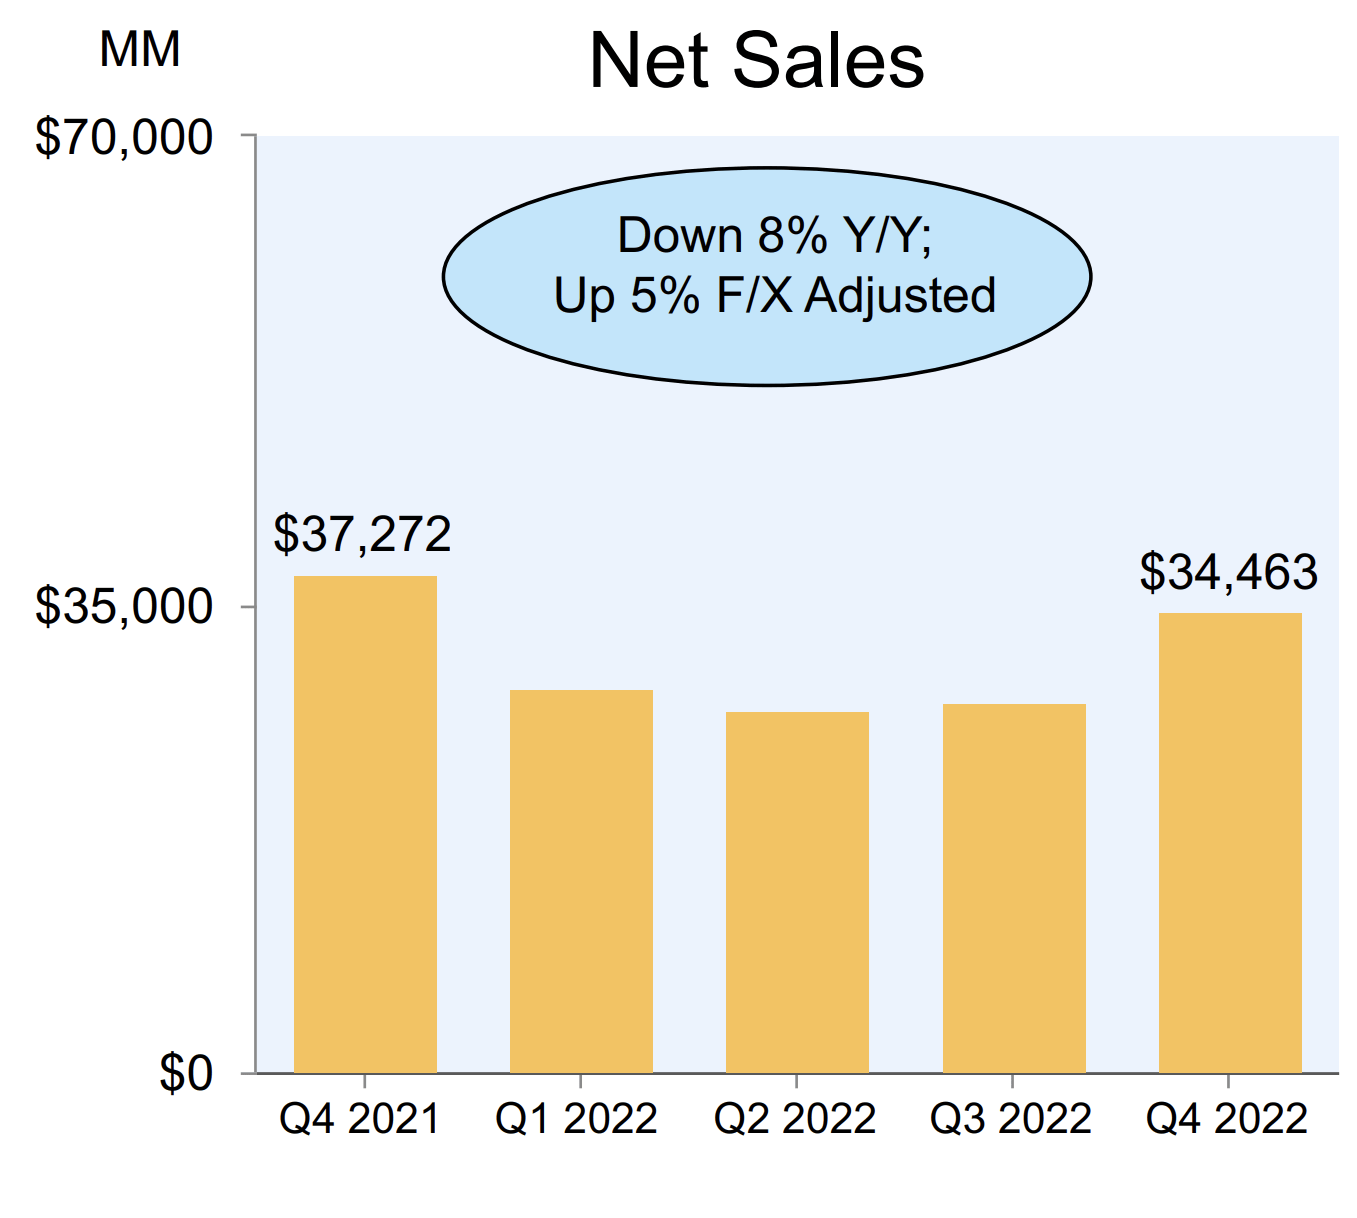
International Revenue (Q4,22 report)
Cloud is the Growth Engine
Amazon’s cloud business, AWS is my favorite part of the company and this is for a few reasons. AWS has consistently reported solid revenue growth and in Q4,22 it increased by 20% year over year to a solid $21.4 billion. AWS now contributes approximately 14% of Amazon’s total revenue and I expect to see this metric increasing in the future. AWS is the largest cloud infrastructure provider and had ~34% market share according to latest data online from Statista, which is from Q2,22.
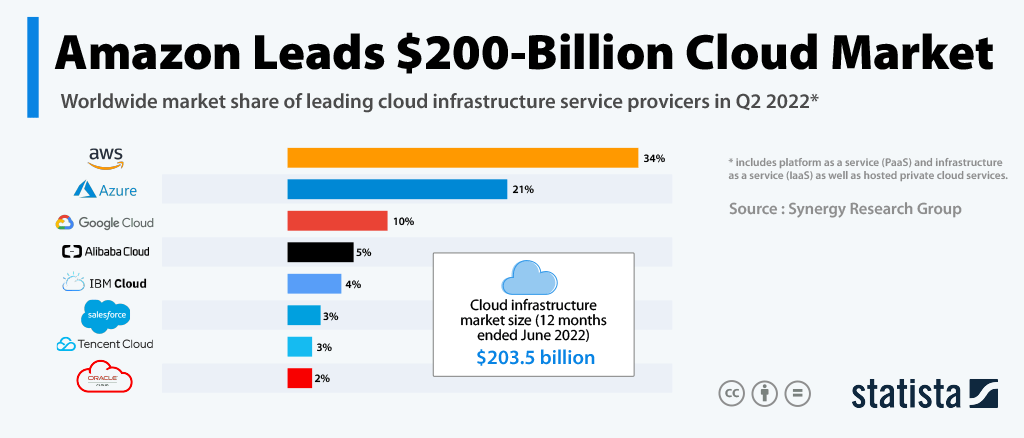
Cloud infrastructure providers (Statista)
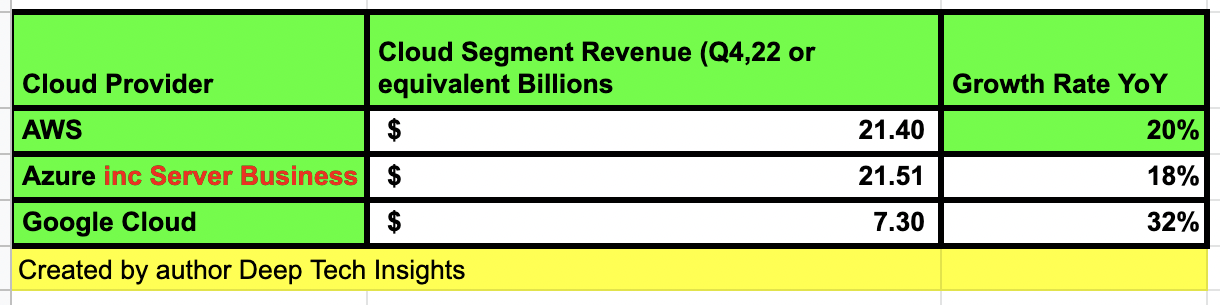
For more up to date information, I have created a unique table and graph in which I’ve extracted segment revenue from the most recent earnings reports. We can see Microsoft’s “Intelligent Cloud” segment reported $21.51 billion in revenue. This may look greater than AWS, but this figure includes an unknown amount related to Microsoft’s core server business, thus this is not a direct or fair comparison, as Microsoft doesn’t report extra details. However, we can use the chart to see AWS is growing at a slightly faster rate on an aggregate basis at 20% versus 18%.
Cloud Provider Sales Q4,22 data (Created by author Deep Tech Insights)
The comparison with Google Cloud is the best way to see how far AWS (and possibly Microsoft) are ahead of others. Google Cloud reported $7.3 billion in cloud revenue in Q4,22, whereas AWS reported nearly 3 times (2.9x) greater revenue than Google Cloud at $21.4 billion. I have created a unique graph below to show this scale. The observant among you will notice that Google Cloud is growing at a “faster” rate of 32%. However, as this is off a much smaller base revenue, I wouldn’t say its revenue growth is greater on a net dollar basis.
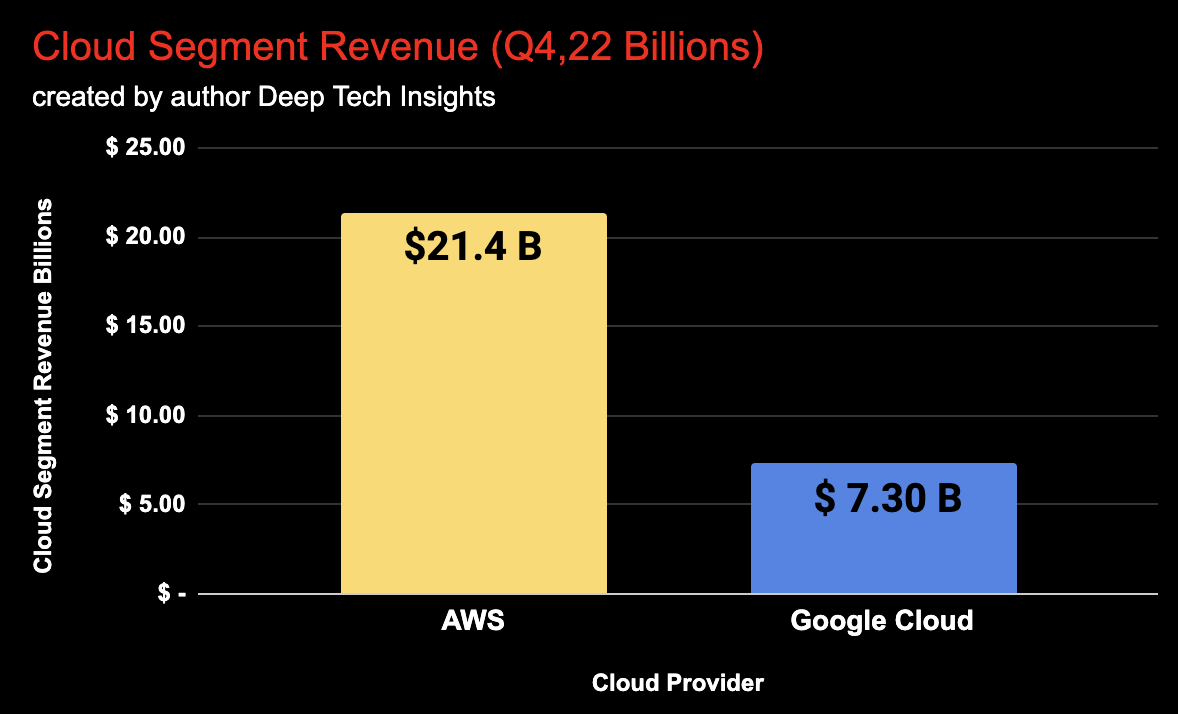
Cloud AWS Versus Google Cloud (Created by author Deep Tech Insights)
So why is Amazon the leader in Cloud? This is for a few reasons firstly we know AWS had a “first mover” advantage as it was founded in 2006, versus Azure in 2008 and Google Cloud in 2011. In addition, Amazon had to develop cloud infrastructure at a rapid rate originally to help its own thriving ecommerce business grow.
I believes Amazon’s “customer centric” culture has been a key driver to the businesses success. I often joke that AWS has a service for almost everything from of course your standard “compute” and “storage” to AI, Machine Learning and even satellites as a service. AWS has recently launched Amazon DataZone, a data management service, AWS Clean Rooms for data AWS Supply Chain to help mitigate supply chain risk. The number services may seem overwhelming but Amazon carefully listens to customer feedback and iterates rapidly. For example, Supply chain disruption as been a hot topic on the minds of organizations and AWS has a service to help companies solve this.
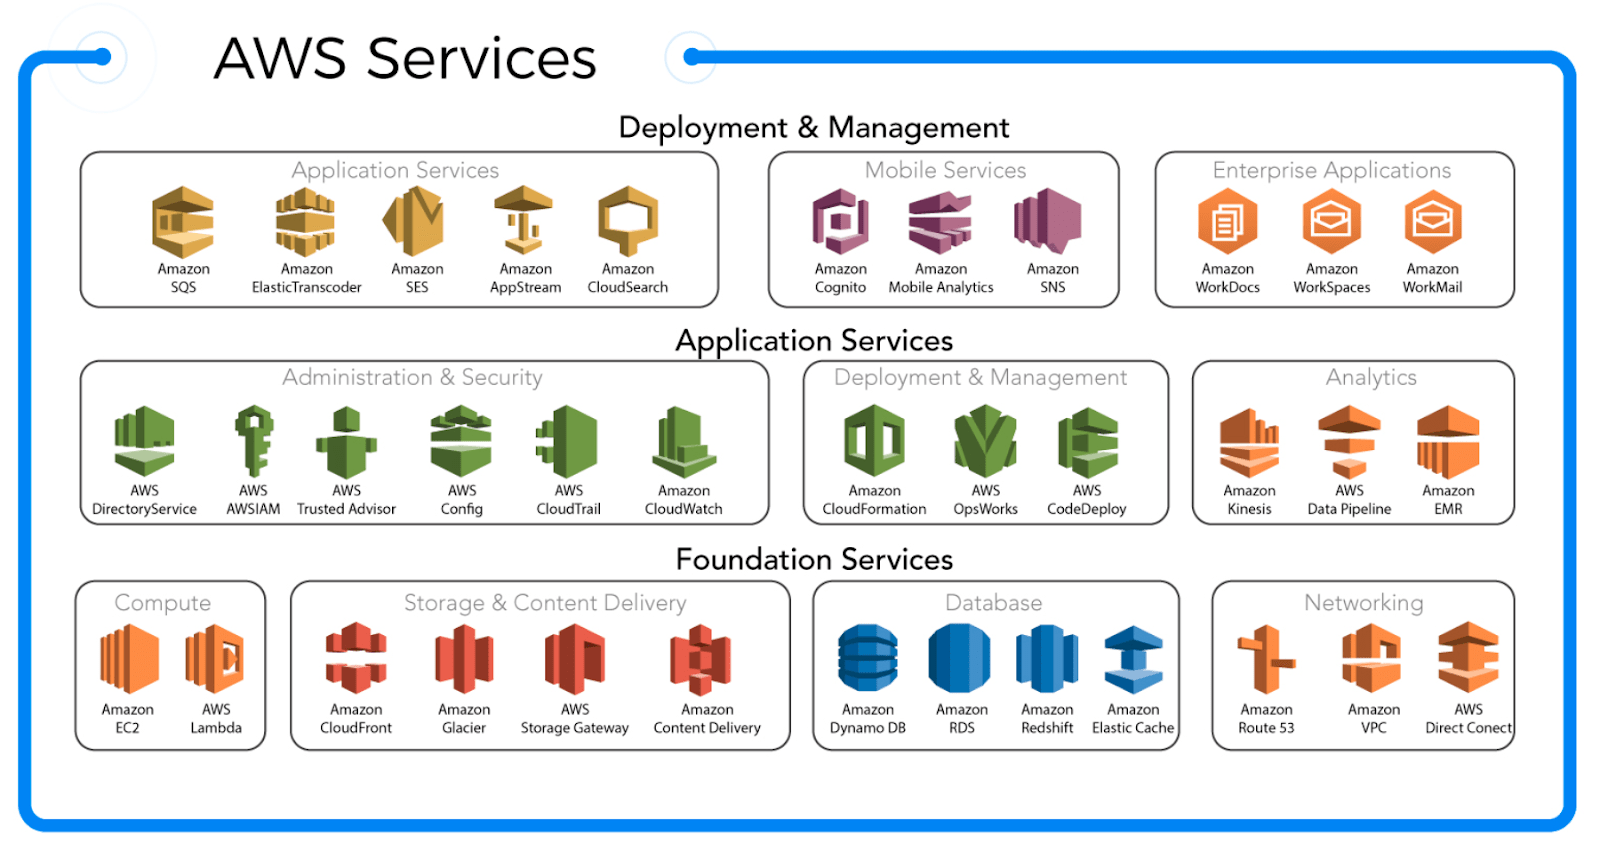
AWS Services (AWS)
Its culture of “invention” has also helped the company to stay ahead of the competition. For example, the business invented the “snowmobile”, which is a truck that can be used to help organizations migrate vast sums of data to the cloud. If you have ever tried to download a movie, you will know internet connection speed can be limiting. A movie is usually around 5GB, where AWS’s Snowmobile can transfer up to “100 petabytes” which is astonishing.
In my opinion as a former Digital Marketing agency owner and (AWS certified), AWS has much stronger and more value focused marketing, than competitors which has definitely helped with driving growth and more sales in my opinion.
The overall value proposition for the cloud is strong, outsource your IT to a data center and benefit from near unlimited scalability which benefits both performance while also enabling cost savings. Thus it is no surprise that the cloud industry is forecast to grow at a 19.9% compounded annual growth rate [CAGR] and reach an estimated value of $1.7 trillion by 2029.
Profitability and Expenses
Amazon reported operating income of $2.7 billion which declined by an eye watering 21% year over year or 27% on an FX neutral basis. Its earnings per share [EPS] was negative $0.03, which missed analyst estimates by negative $0.13.
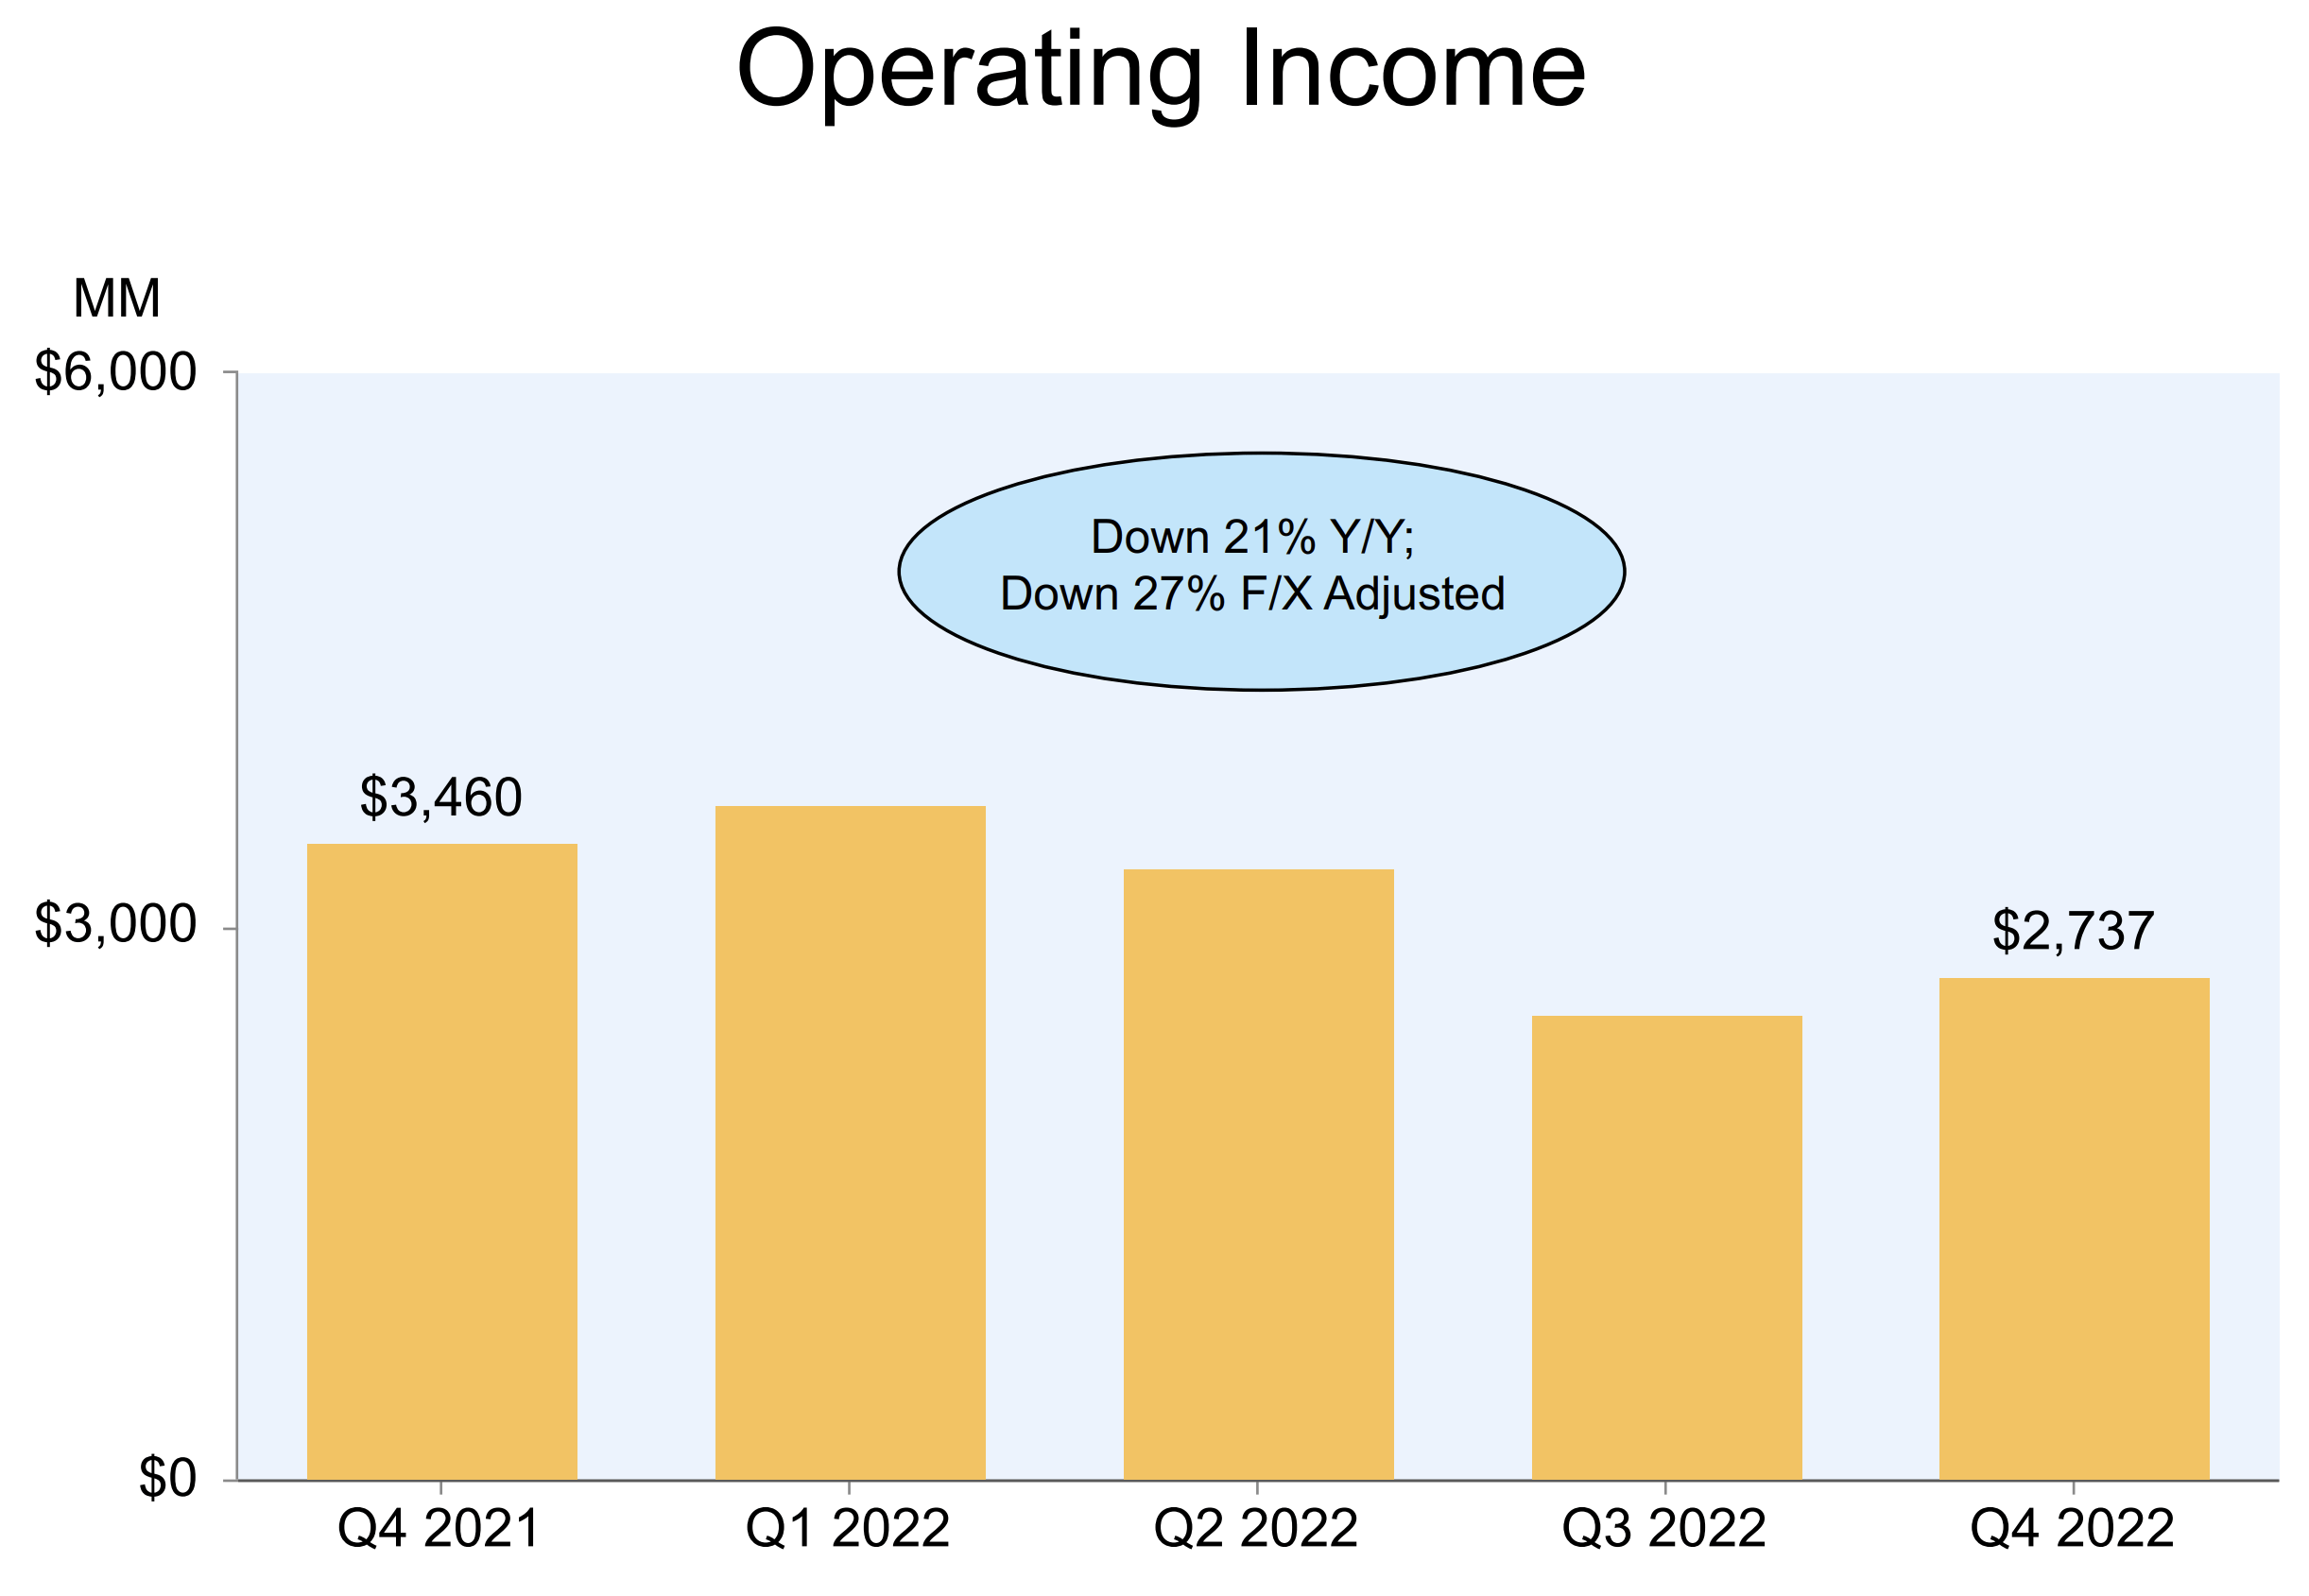
Operating Income (Q4,22 report)
The main reason we have seen a decline in operating income is due to a sharp 9.34% increase in operating expenses to $146.467 billion. The main increase was driven by 3 large items which equates to ~$2.7 billion in extra costs for Q4,22. This included employee severance costs, operations lease changes and insurance liabilities. A positive is the majority of these look to be one off expenses and I don’t imagine they will impact the business negatively long term. For example, Amazon has recently announced lay offs which aim to effect up to 18,000 people and cost the company $640 million in severance packages. This may seem like a terrible sign for the company and I really feel for those affected. However, if we zoom out this isn’t really a panic cut for Amazon but more an adjustment to “normal levels”. Amazon had 798,000 employees in the fourth quarter of 2019. Then by the end of 2021, the company increased this to over 1.6 million employees, which is close to double year over year. Therefore a “trim” of 18,000 employees is mealy prudent after excessive hiring to meet demand. Although I don’t think it’s great for a business’s culture when they drop employees. Breaking expenses down by line item, its cost of sales increased by 3.42% to $85.64 billion. In addition, to a 2.9% increase in its fulfilment costs to $23.1 billion. Amazon has announced plans to close three U.K fulfilment centers and reported “improved” efficiency in its supply chain, thus I imagine this cost will start to fall over the next few quarters.
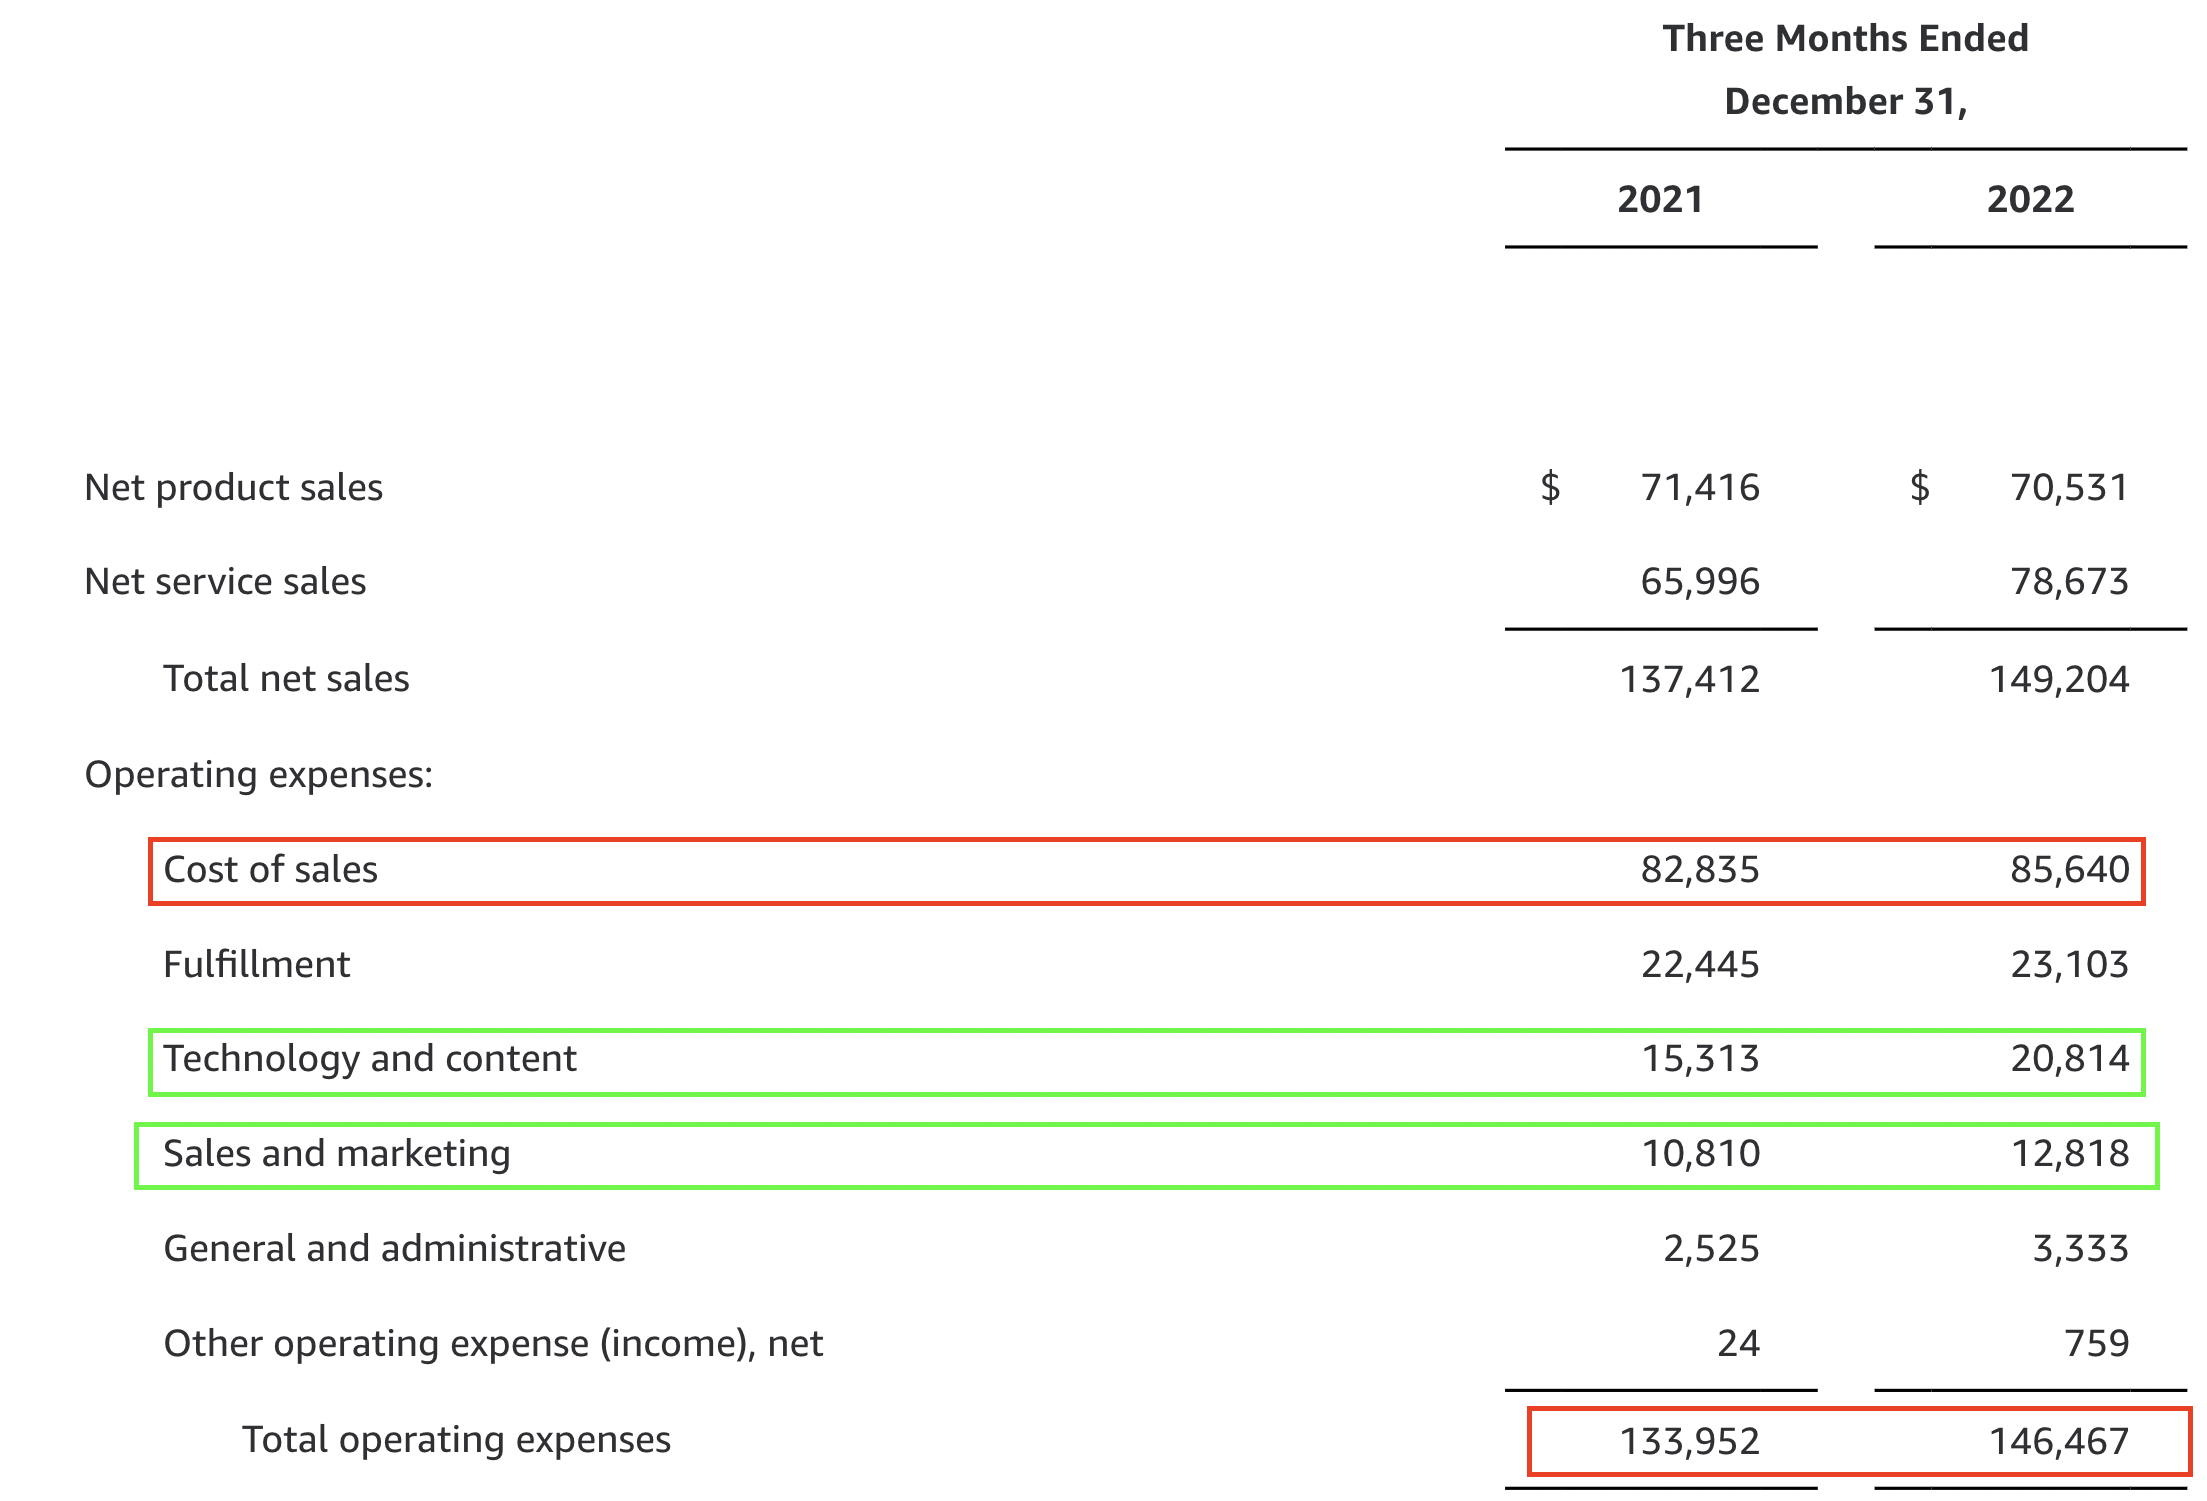
Amazon Expenses (Q4,22 report)
Amazon also reported it has “exited” certain physical stores such as Amazon Go and Amazon Fresh and reported $720 million in operating lease impairments. I personally believe this is a smart move as physical brick and mortar retail seems necessary for a technology first company such as Amazon. I also find the company isn’t really solving a major problem with its “Amazon Go” stores. As the whole idea is that you can walk in and walk out without having to use the checkout. This sounds great on paper but most market supermarkets (at least here in the U.K) have a self checkout function and even a similar no checkout required tool. In addition, I recently visited an Amazon Go store in London for market research and found the process to be clunky for a “off the street” visitor. As you have to log on to your Amazon account to purchase even for a small item like a pack of gum. Of course my experience is just a single datapoint, so feel free to comment your experiences below.
Amazon also reported a 35.9% increase in its technology and content expenses to $20.8 billion. Overall I don’t believe this to be a major negative as the company must continually invest and innovate to stay ahead, thus I deem this as the equivalent of R&D expenses. For “content” investments Amazon invested $7 billion in 2022, up from $5 billion in 2021. Amazon looks to have achieved positive results so far with its Lord of the Rings (Rings of Power) series searching over 100 million viewers and increasing prime sign ups substantially. The company also reported a positive increased 11% viewership in the prized 18 to 34 demographic for its NFL Football package.
Sales and Marketing expenses also increased by 18.5% year over year to $12.8 billion. Again, i don’t deem this as a major negative as this is classed as an investment to help with new product launches etc.
Amazon’s overall net income reported a substantial decline by 98% year over year to $278 million. This may seem atrocious but really this is an “on paper” decline. Amazon reported a pre tax valuation loss of $2.3 billion its EV investment into Rivian, which is down substantially from the $11.8 billion value in Q4,2021. This has been mainly driven by the rising interest rate environment which has “compressed” the valuation multiples of many “growth stocks”. I don’t deem this to be a permanent issue and it has affected the entire growth stock market. This doesn’t mean Rivian’s stock will “bounce back” but I believe valuation multiples will expand again by the end of 2023, as inflation is on a downward trend and the Fed will likely lower rates, which I turn lowers the discount rate for valuation. In addition, Rivian is really a strategic investment for the company as Amazon plans to have the company manufacture 100,000 Amazon branded EV delivery vans by 2030. Amazon has already gotten off to a strong start and delivered its 10 millionth package using Rivian EVs.
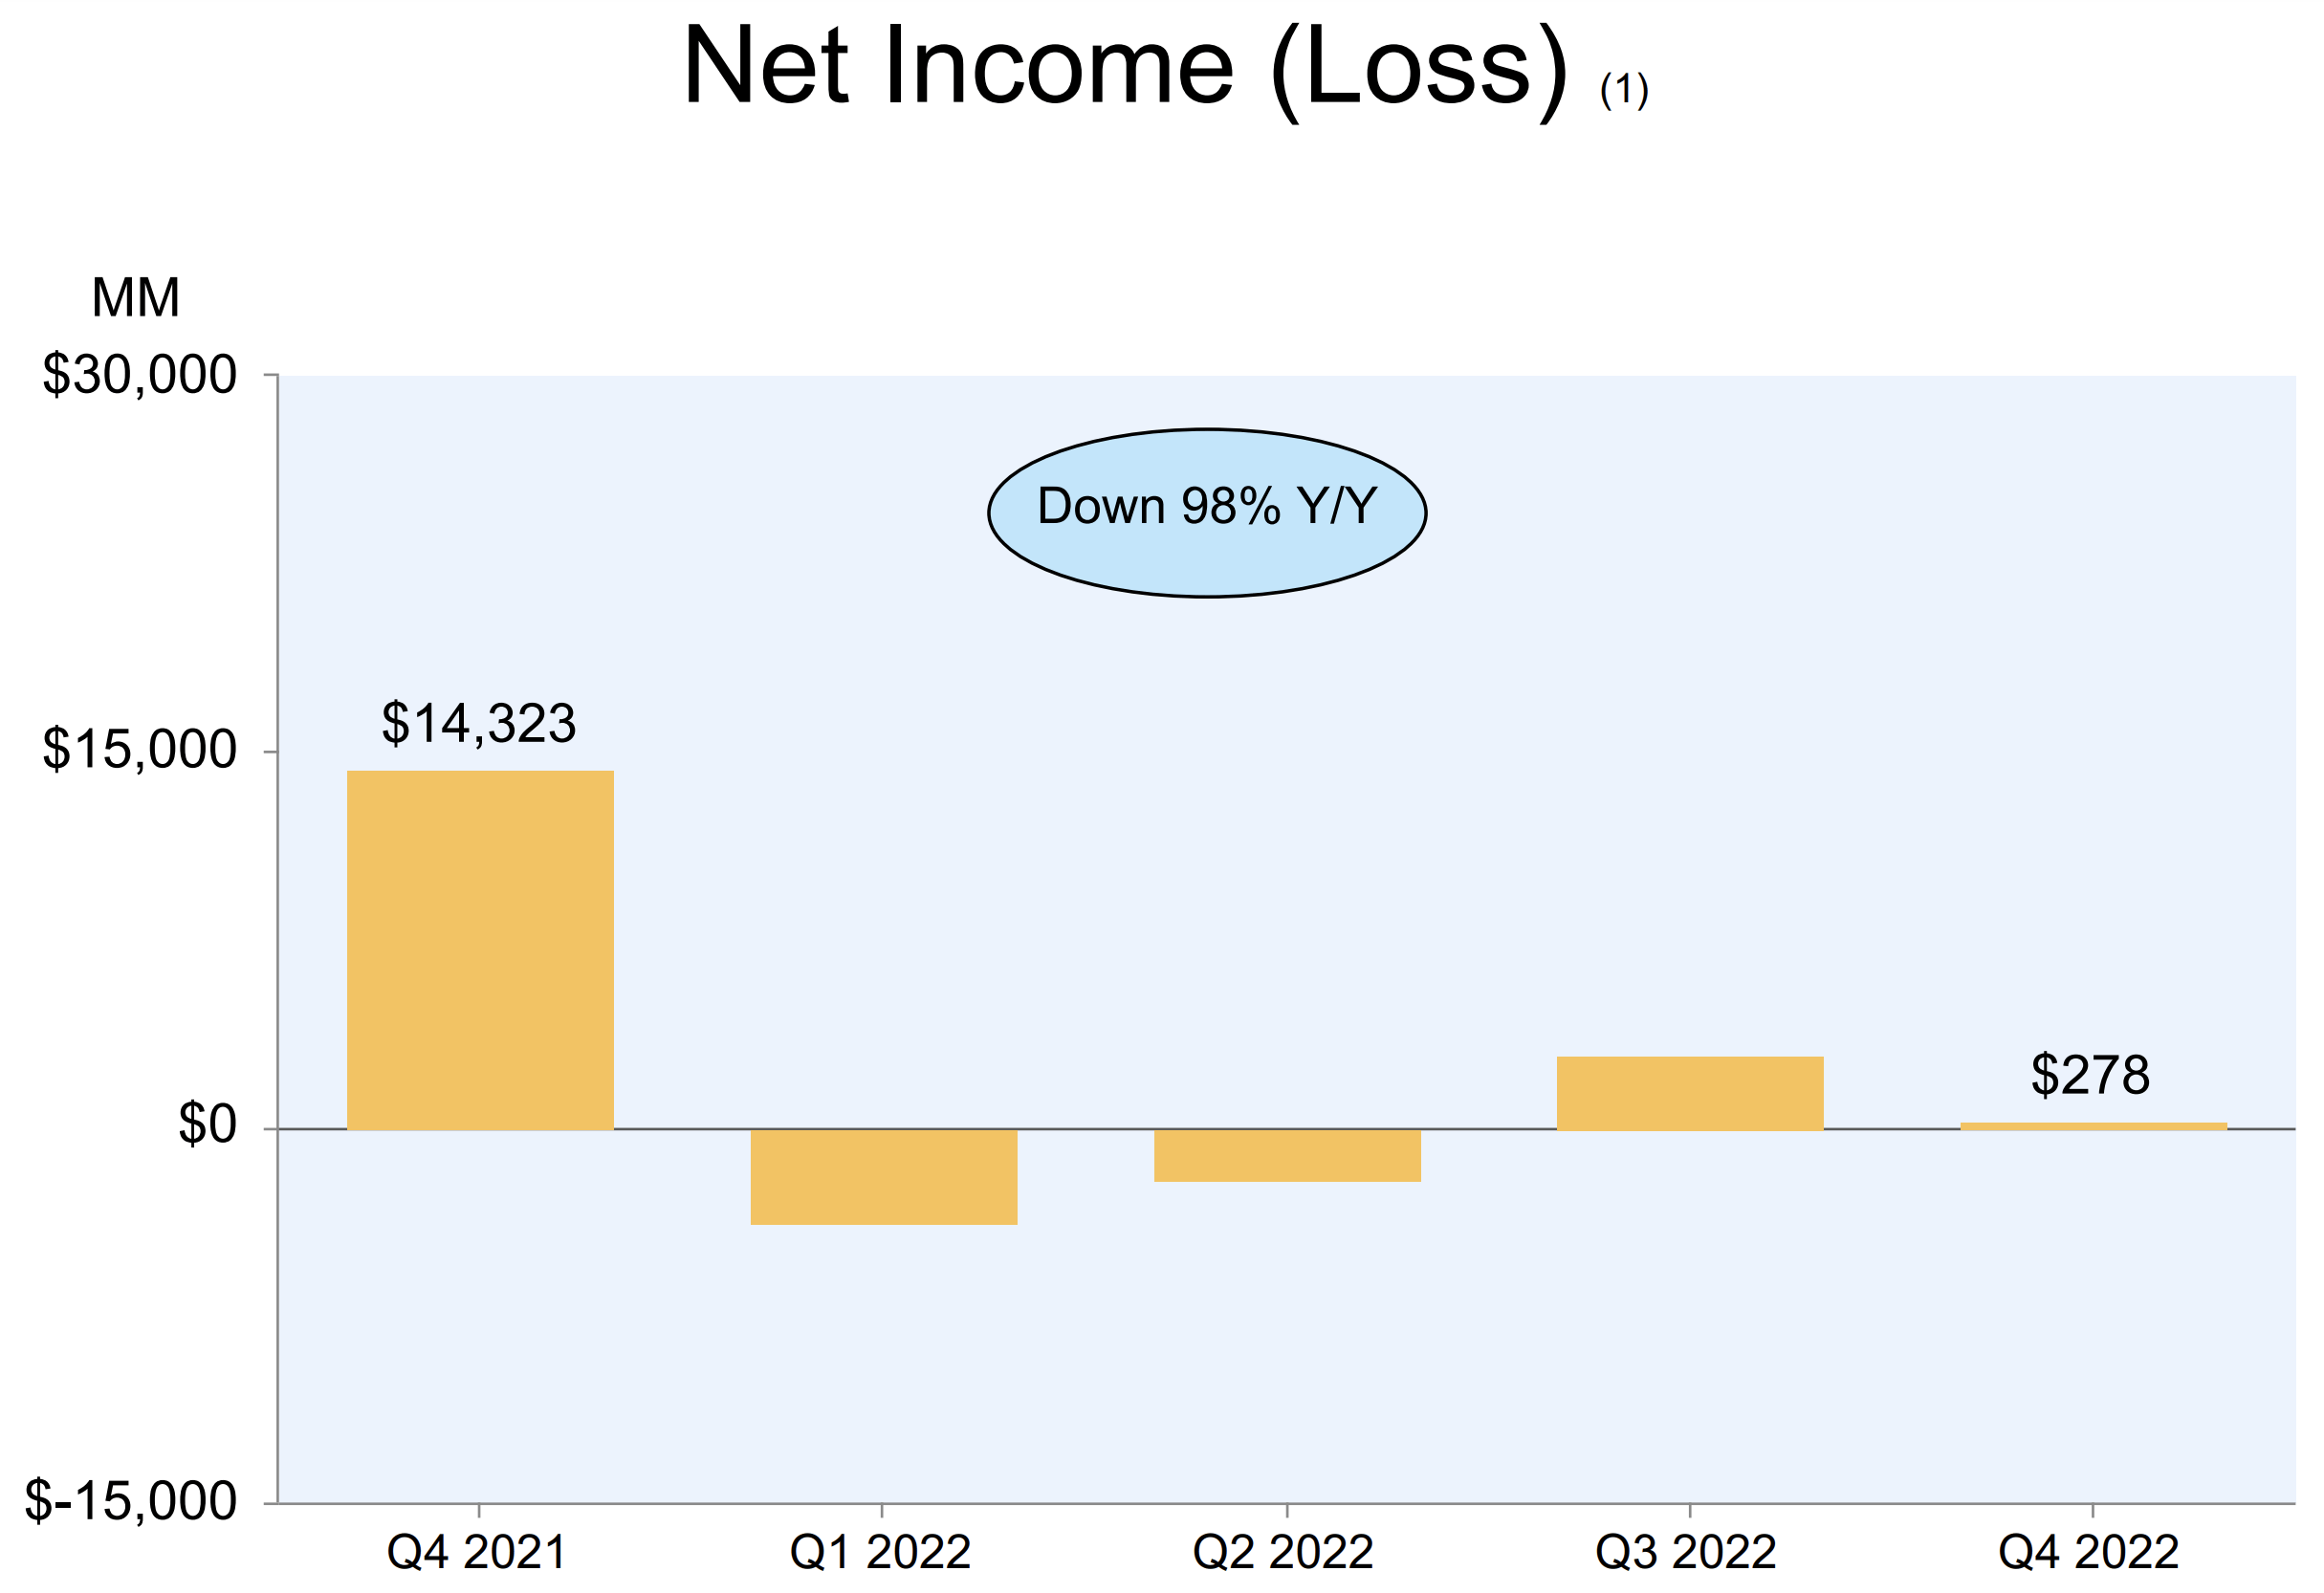
Net Income (Q4,22 report)
Amazon has a solid balance sheet with $53.8 billion in cash and cash equivalents, and $16.1 billion in marketable securities. The company does have fairly high long term debt of $67.1 billion, but is not due within the next two years which is positive.
Valuation?
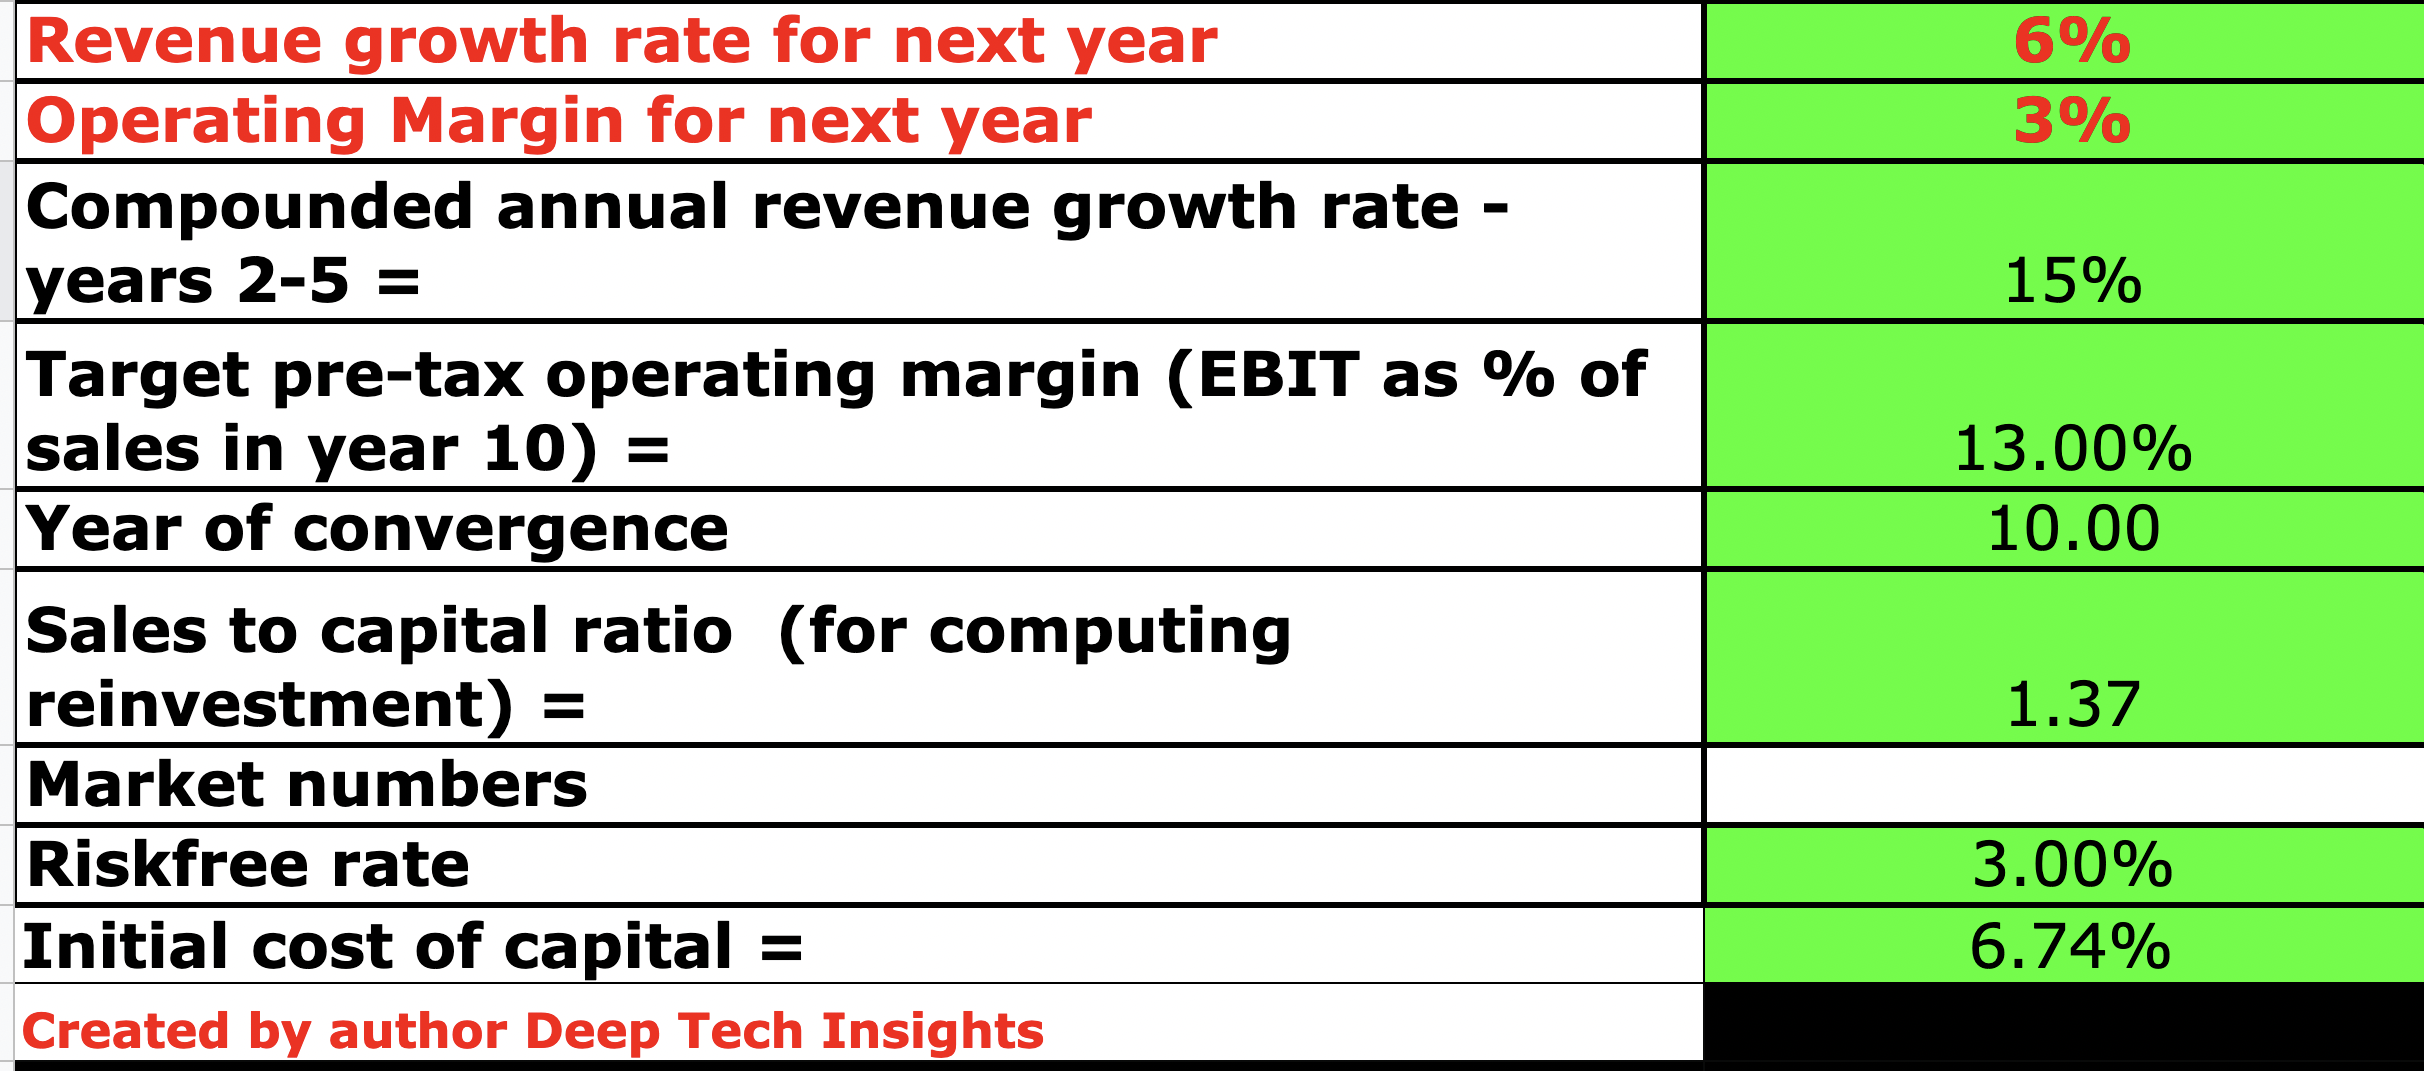
In order to value Amazon, I have plugged its latest financial data into my discounted cash flow valuation model. I have forecast 6% revenue for “next year” which is the full year of 2023 in my model. This estimate is based upon an extrapolation of managements guidance of between 4% and 8% growth in Q1,23. I have taken the mid range of that level. In years 2 to 5, I have forecast a faster 15% growth rate per year. This is based upon a cyclical rebound in ecommerce as economic conditions are likely to improve. In addition to a likely adjustment in foreign exchange headwinds, as the currency market also tends to be cyclical. I have also forecast continued and accelerated growth in AWS cloud, which previously grew at a 20% YoY rate. As a comparison, I noticed Microsoft’s cloud business generated around 39% of its total revenue in the most recent quarter (Q2,FY23). While AWS contributed ~14% of Amazon’s total revenue. Given the huge total addressable market for the cloud I see no reason why Amazon cannot continue to grow AWS to make up a larger portion of revenue.
Amazon stock valuation 2 (Created by author Deep Tech Insights)
To increase the accuracy of the valuation, I have capitalized the company’s R&D expenses which has lifted net income slightly. I have forecast just a 3% operating margin for “next year” (2023). This is based upon an extrapolation of managements guidance of between $0 and $4 billion in operating income for Q1,2023. I have taken the high end of this range and calculated a 3.17% margin, then applied this to the entire year. The reason I have used the high end of the guidance, is I believe Amazon’s margin should improve throughout 2023, as it absorbs the cost efficiencies from a reduction in fulfilment centers, employees and shakes off “one off” expenses. Over the next 10 years, I have forecast a 13% operating margin. This may seem optimistic but let’s remember Amazon’s core business is ecommerce which should effectively be scalable and relatively high margin. U.S industry data from New York University indicates the average operating margin of an ecommerce company is ~9.28%. Amazon also reported a 8.17% operating margin Q1,21. In the following quarters Amazon’s operating margin has sat in the range between 1.99% and 6.81%. This was mainly due to the aforementioned costs and expenses covered in the prior section. However, we also should remember Amazon operates with a “virtuous cycle” in which it reinvests its cost saving and profits in order to enhance the customer experience. In the short term this means low margins, but long term Amazon can capture the value created. I also forecast an increase in operating margin over the next decade as AWS continues to grow. AWS is the key profit driver for Amazon and operates at an astounding 24% operating margin in Q4,22. As AWS grows to become a larger segment of Amazon’s business it should expand overall margins organically.
Amazon stock valuation 2 (created by author Deep Tech Insights)
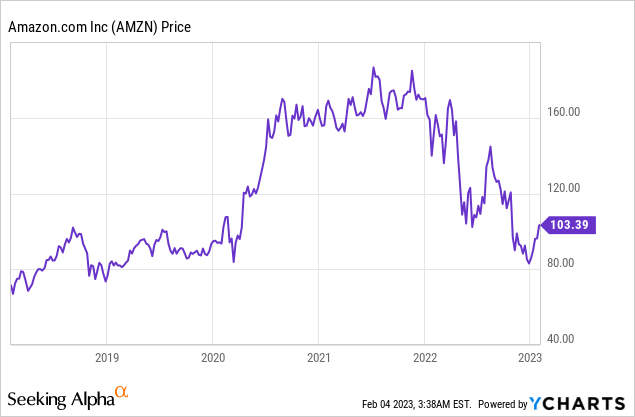
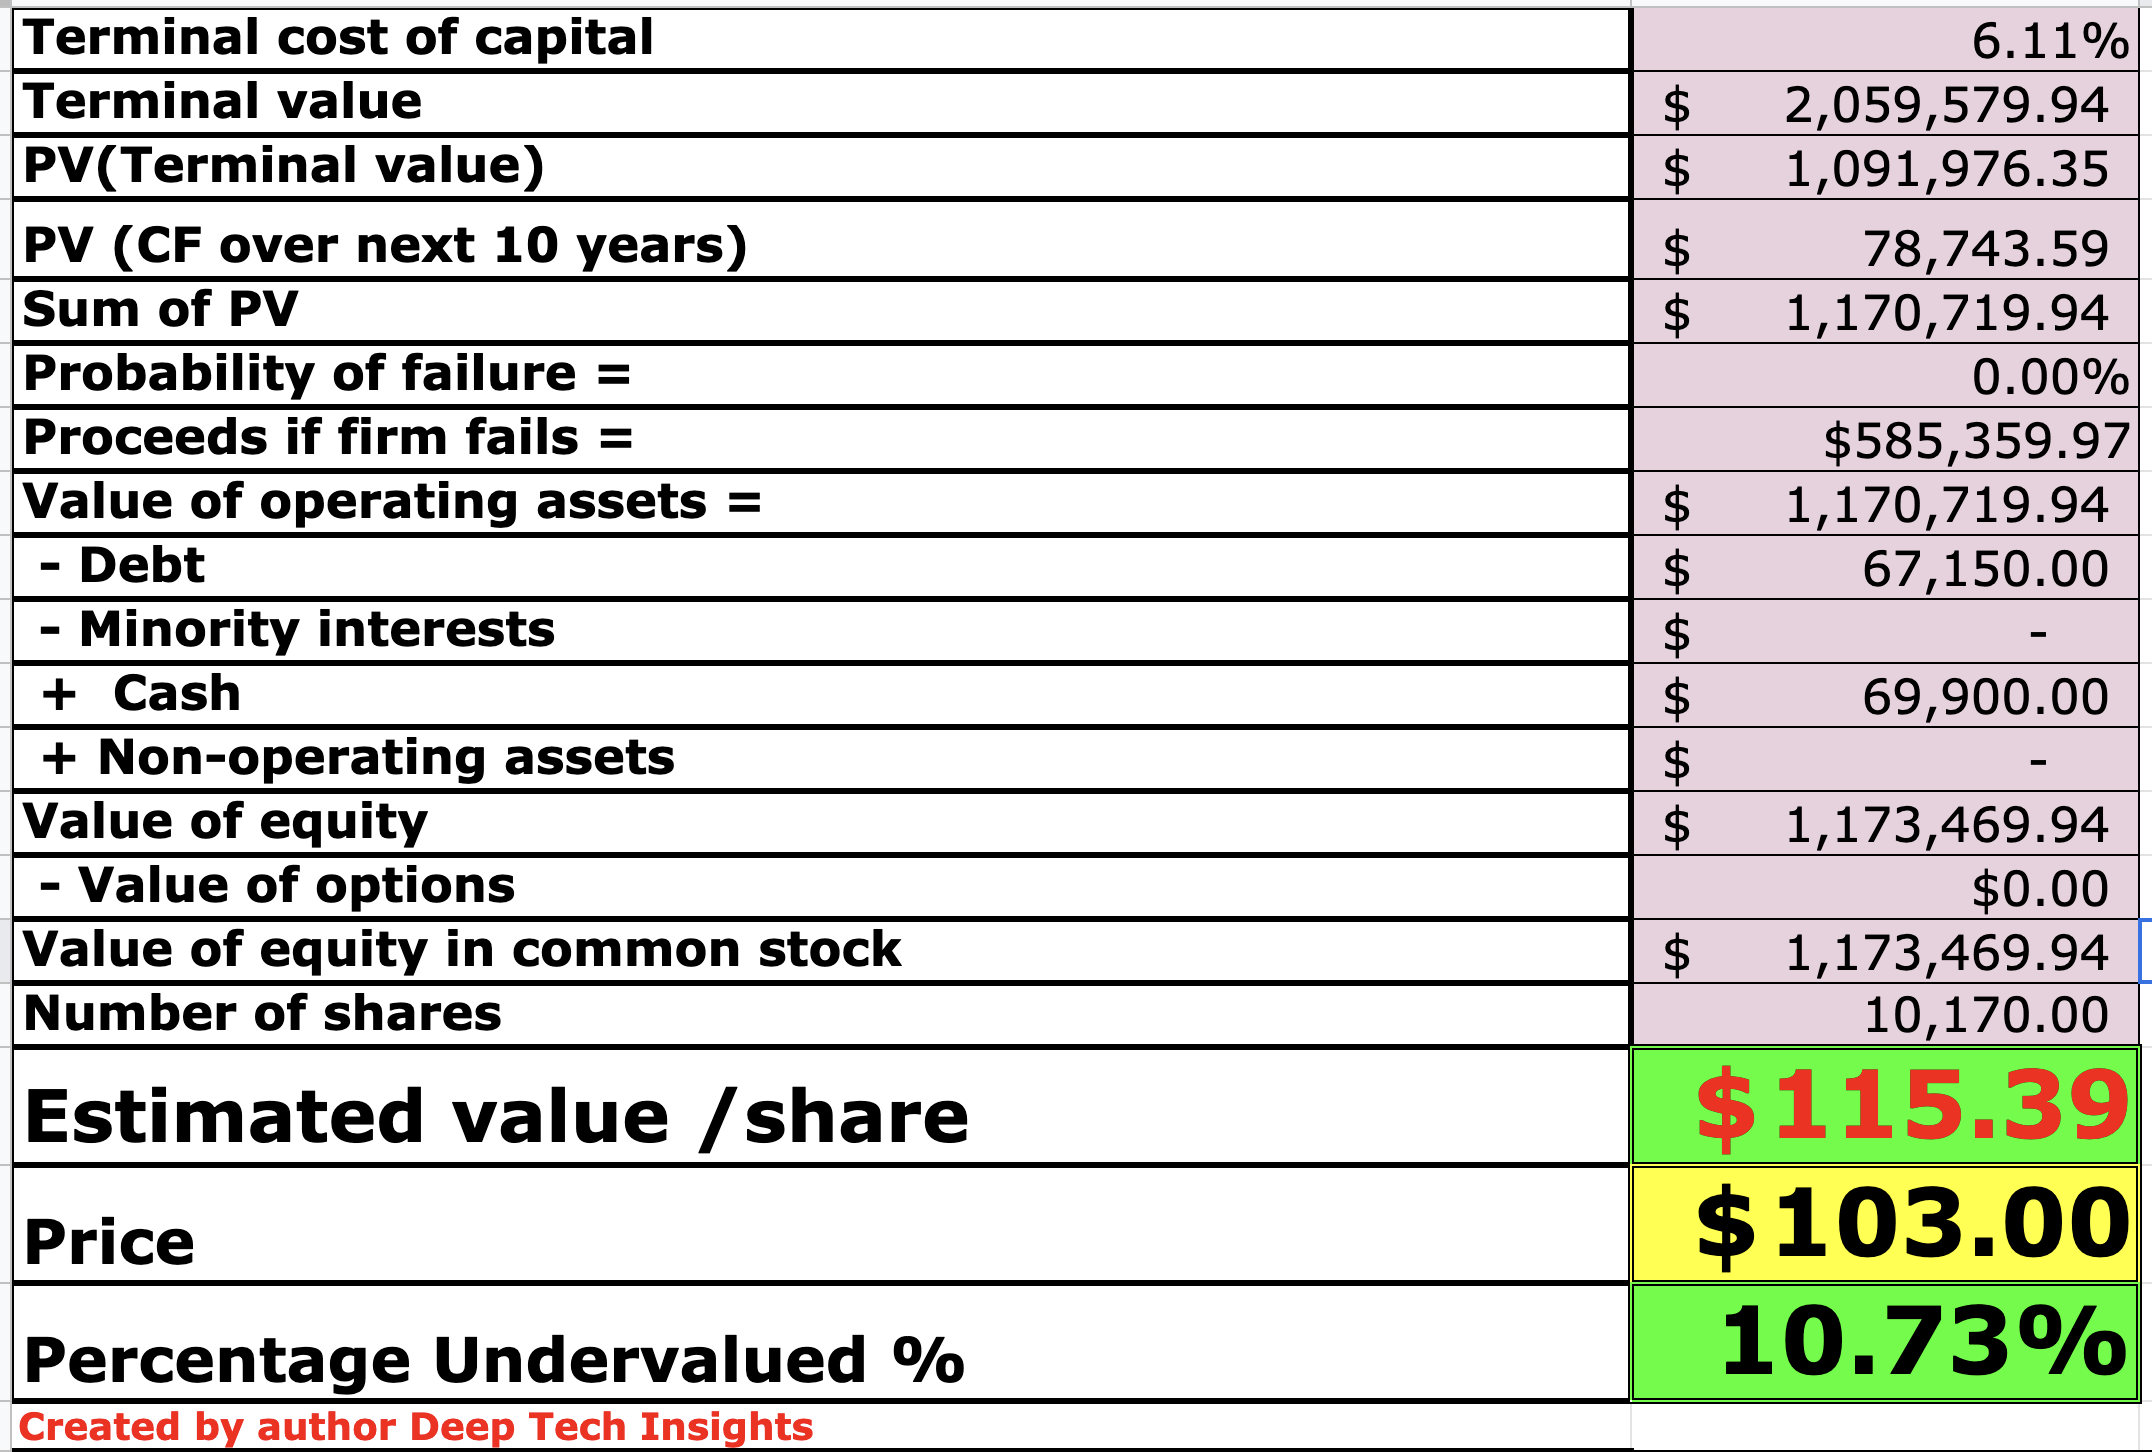
Given these factors I get a fair value of $115 per share, the stock is trading at approximately $103/share at the time of writing and thus is ~10.73% undervalued according to my forecasts and model.
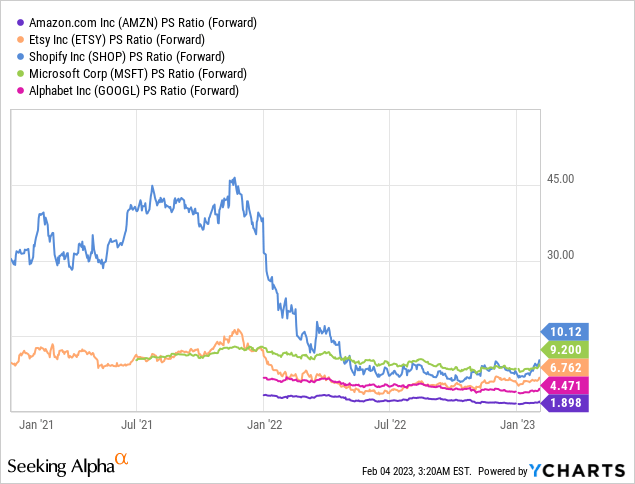
As an extra datapoint, Amazon trades at a forward PS ratio = 1.89, which is ~39% cheaper than its 5 year average. On the below chart I have compared Amazon to rival technology giants, as well as small ecommerce players. Interestingly enough this is a testament to the dominance of Amazon in the ecommerce market. Amazon trades at a cheaper PS ratio than Shopify (SHOP), P/S ratio = 10x and Etsy (ETSY) P/S ratio = 6.7x. In addition, Amazon trades at a cheaper P/S ratio then Microsoft’s (MSFT) P/S of 9.2x and Alphabet’s (GOOGL), P/S = 4.47x. Of course a Price to sales ratio doesn’t take into account “profitability”, but that is why I focus mostly on the discounted cash flow model above.
Risks
Recession/Cost Inflation
Many analysts have forecast a recession in 2023 and thus lower ecommerce demand would be expected. We may also see longer sales cycles in the purchases of AWS, as large organizations decide to delay their movement to the cloud, but I believe this won’t impact the long term secular growth in digital transformation.
Final Thoughts
Amazon may have “over invested” in 2020 and thought the “good times” would last forever. It is now facing a number of challenges but its market leadership is still solid across ecommerce and the cloud. Lower demand is expected in 2023 and it will take time for Amazon to absorb the benefit of its cost cutting initiatives. However, its stock is undervalued intrinsically and relative to historic multiples and thus I believe it could be a great long term investment.
Be the first to comment