

Ibrahim Akcengiz
One may think that inflation-protected Treasuries (TIPS) are precisely a suitable investment during a time of high inflation. How do these bonds work, and what is the best way to invest in TIPS?
On September 11, I published “Amazing 9+% Yields In Inflation-Protected Treasuries” (“previous post”). This sequel is motivated by the discussion that followed the publication.
How Do TIPS Work?
In the previous post, my description was rather laconic. Let me correct my mistake.
Most investors know that TIPS are government bonds currently offered in 5-, 10-, and 30-year maturities. Like all Treasuries, they do not carry credit risks and are not taxed at a state level. The coupon rate is fixed at the time of issuance, but the principal is being adjusted in line with changes in the Consumer Price Index (CPI). However, the process of this adjustment is not so straightforward.
Between several types of CPI issued by the Government, TIPS are adjusted based on the so-called Consumer Price Index for All Urban Consumers (CPI-U) seasonally unadjusted (you can check the latest report for August here). Historical results for this index and its year-over-year change are shown below copied from a Government site.
Historical inflation (US Government)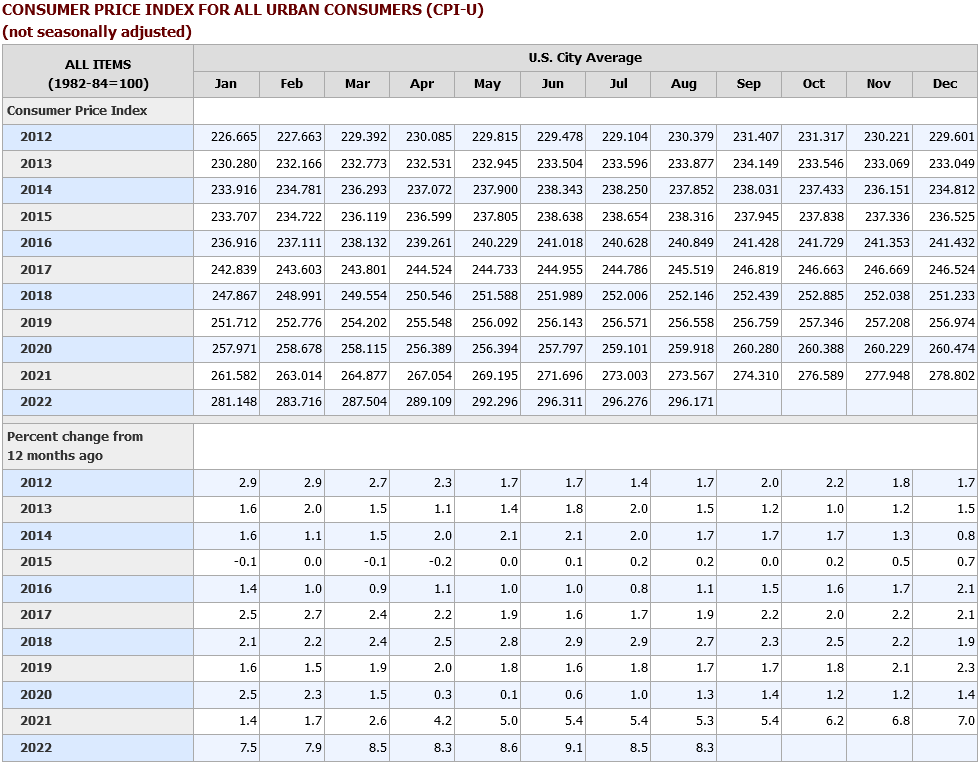
In October, the price of TIPS will be adjusted based on the August results, i.e., with a two-month lag. The Treasury has already published the table according to which the inflation factor will change daily in October.
The right column on the image below shows the inflation factor for the bond maturing on Jan 15, 2023 (CUSIP 912828UH1) that we highlighted in the previous post. The data for this and other bonds are available on the TreasuryDirect government site.
Inflation factor (TreasuryDirect)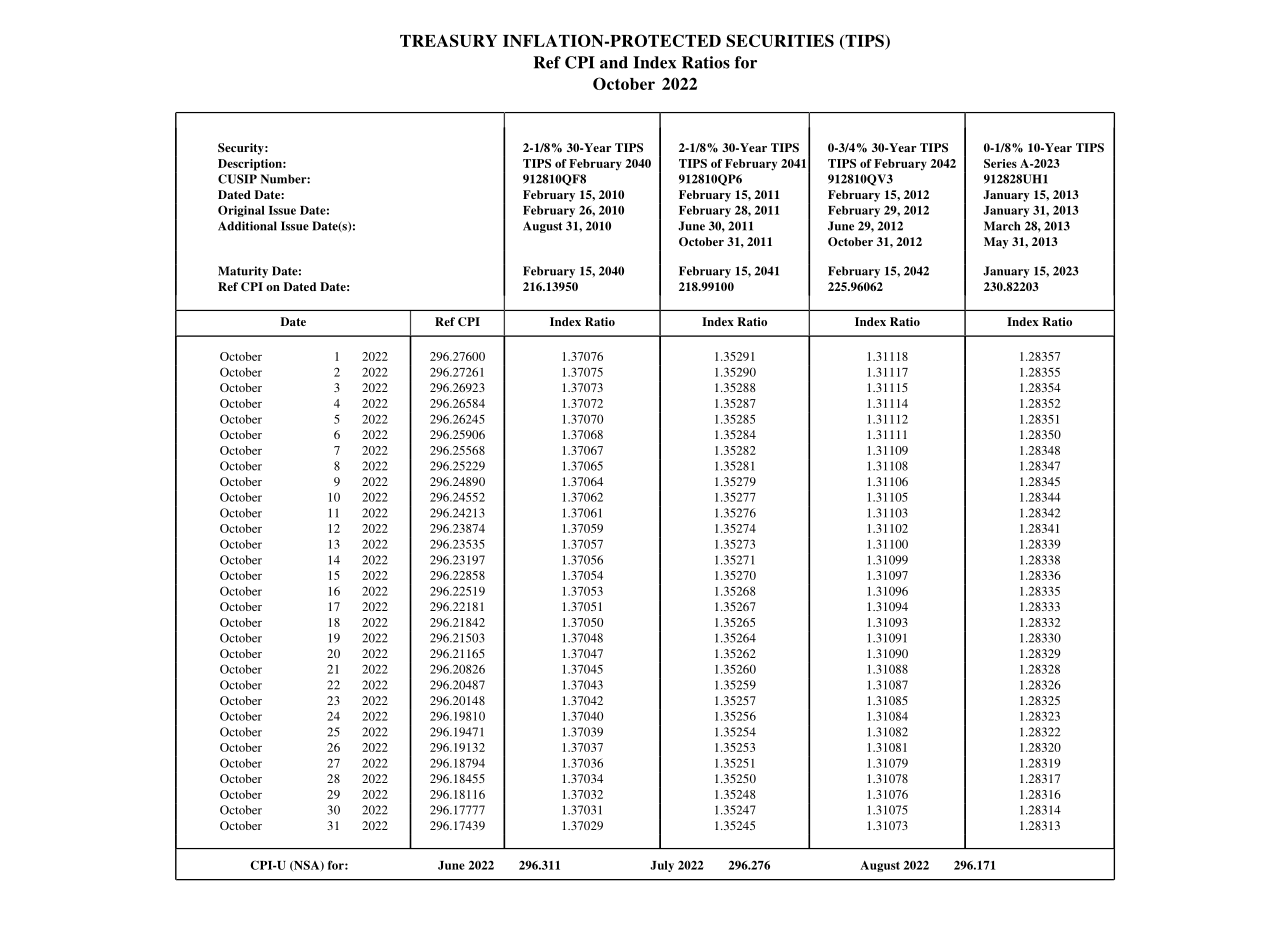
The figures in the table may be too small, but please take a closer look at the right column. Here is something that might surprise you: the inflation factor is slightly declining from Oct 1 to Oct 31 despite high annual inflation in August of 8.3%. How come?
From our first table, the CPI numbers were 296.276 and 296.171 this July and August, correspondingly. This minor downtick in the seasonally unadjusted inflation number trickles down to the inflation factor for all TIPS in October.
For better understanding, let us go to real-life quotes. The table below is copied from Fidelity on Sep 16. The colored two rows are the bonds recommended in the previous post (they jumped one day after my publication and are not that attractive any longer). The Jan 15 bond is in the first row. On Sep 16, its inflation factor was 1.28363 on Fidelity but according to our table, it will be only 1.28357 on October 1.
TIPS quotes, Sep 16 (Fidelity)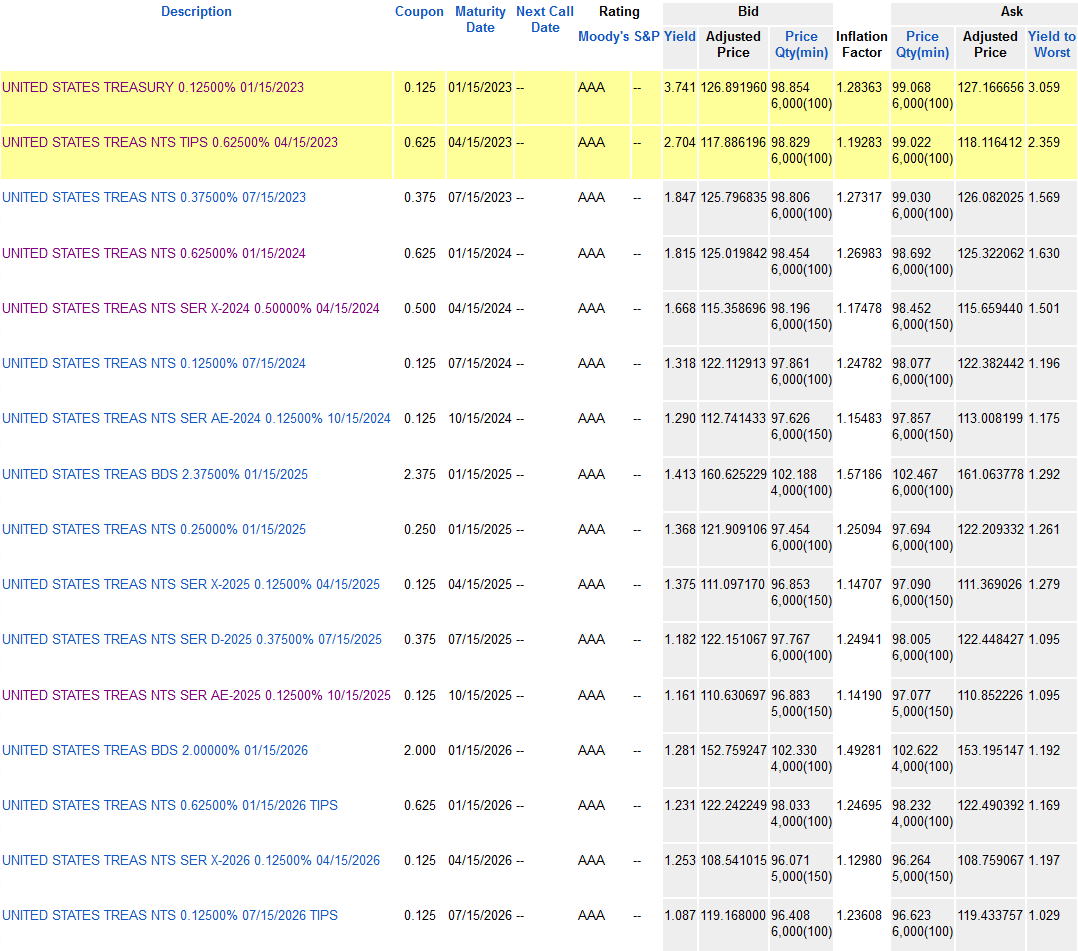
From my readers, I know that many of them were not aware of how the inflation adjustment works.
The most important conclusion of this section is that even at a time of high annual inflation, inflation adjustments can be negative for a limited time.
One of my readers suggested a good site to track TIPS-related issues that I was not aware of – tipswatch.com
TIPS Market Efficiency
In the previous post, I emphasized unusually high YTM for the two ultra-short TIPS in yellow on the image above (they were 4.351% and 2.959% respectively when I submitted my previous post). Quite a few comments were related to market efficiency: how could that be when thousands of experts with powerful computers and sophisticated models are monitoring Treasuries day and night?
To this, I should answer that the market inefficiency was very limited if at all. The attractiveness of ultra-short TIPS was related BOTH to their high YTM and expected negative correlation with stocks. In the worst-case scenario for these TIPS (i.e., relatively low inflation between now and maturity forecasted by economists on the day of the previous post), I expected their returns to be similar to regular T-bills but with decent expected returns from stocks. Otherwise, I expected TIPS to beat regular T-bills. A day after my post and contrary to economists’ expectations, CPI numbers turned out to be high. TIPS jumped but stocks tanked. Regular T-bills do not have this negative correlation, as they destine to return their yield regardless of CPI.
Moreover, market efficiency was not exactly what it seemed. Below is the depth of the trading book for Jan 15 bonds from Fidelity on Sep 16.
Depth of book for TIPS, Sep 16 (Fidelity)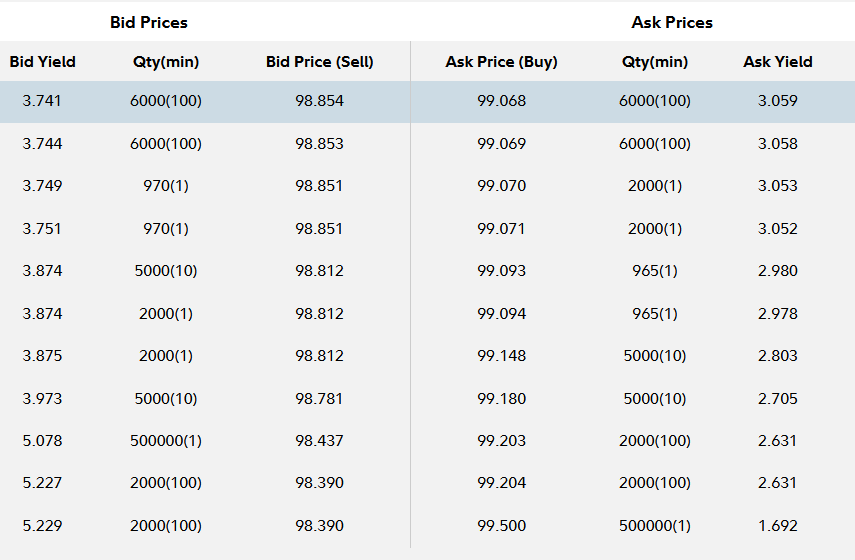
Please pay attention to the column Qty under “Ask Prices”. The best price of $99.068 is available for only a ~$6M order. If you want to buy the security in significant quantities (~$500M at the bottom row) the price becomes $99.500! This is a chasm for ultra-short bonds.
On Sep 7, the depth of the book for Jan 15 was similar, and I bought a noticeable fraction of $6M. After that, the bond prices started creeping up. Is it possible that my actions slightly affected the market? Seems extremely doubtful, but it is still haunting me.
VTIP, STIP, and PBTP
Many investors have decided to allocate to TIPS since inflation became a hot topic in mid-2021. Using ETFs seems the most convenient option for this purpose. Due to growing interest rates, ETFs that buy only short-term TIPS have become particularly popular. My previous post reviewed two well-known instruments, namely sponsored by Vanguard (NASDAQ:VTIP) and BlackRock (NYSEARCA:STIP) (they are very similar – please see the previous publication for minor differences).
This strategy of using ETFs has not been successful in 2022 (it worked much better in 2021). One of my readers who invested in STIP noticed the following – I will quote him with minor omissions:
…in reviewing my STIP for the past year, I find I am net down 1.1% (i.e., principal decline > interest income). Therefore, cash would have been a preferred holding. Because I hold STIP in taxable account, I will pay Fed taxes on the ETF interest income. Therefore, my “real” return is not -1.1% but closer to -3% (after tax).
Both VTIP and STIP emulate Bloomberg U.S. 0-5 Year Treasury Inflation Protected Securities Index and their average maturity (and duration) is ALWAYS close to 2.5. In reality, their duration is even higher: 2.6 for VTIP and 2.7 for STIP. It makes them sensitive to growing interest rates and explains what my reader has experienced in 2022. Federal taxes exacerbate the situation. Ultrashort individual TIPS seem a better choice than either VTIP or STIP for the next several months, as they have both higher YTM and lower duration.
One of my readers asked me if there were better ETFs. The answer is yes – welcome to Invesco PureBeta 0-5 Yr US TIPS ETF (BATS:PBTP) with details available here.
It has a marginally higher expense ratio – 0.07% vs 0.04/0.03% for VTIP/STIP. But it tries to emulate a different benchmark – ICE BofAML 0-5 Year US Inflation-Linked Treasury Index℠. For this reason, its duration is noticeably shorter – 2.16, and it will be less sensitive to interest rate hikes. During the next several months, it is likely to perform better than VTIP/STIP. Due to its smaller YTM (1.18%), we still expect it to underperform ultrashort individual TIPS.
And the last observation: my readers mentioned that certain brokers (TD Ameritrade, for example) do not allow trading in individual TIPS. Most of them do, however, and one can find individual bonds based on their CUSIP. CUSIPs, in their turn, can be found through different sources, including the already mentioned TreasuryDirect site.
Be the first to comment