


Skyhobo/E+ via Getty Images
Investment Thesis
Both Altria Group (NYSE:MO) and Philip Morris International Inc (NYSE:PM) have had a really volatile year indeed, given the 29.29% and 26.32% in price swings thus far, respectively. The former has Juul to thank for, worsened by Biden’s ban on menthol cigarettes, along with the limitation in nicotine levels for US-sold cigarettes. Sales for Tobacco products are already on the decline, with E-cigarettes affected as well, given Juul’s ongoing litigation with the US FDA, potentially putting a damper on the marketing and sales of the product in the overall tobacco market.
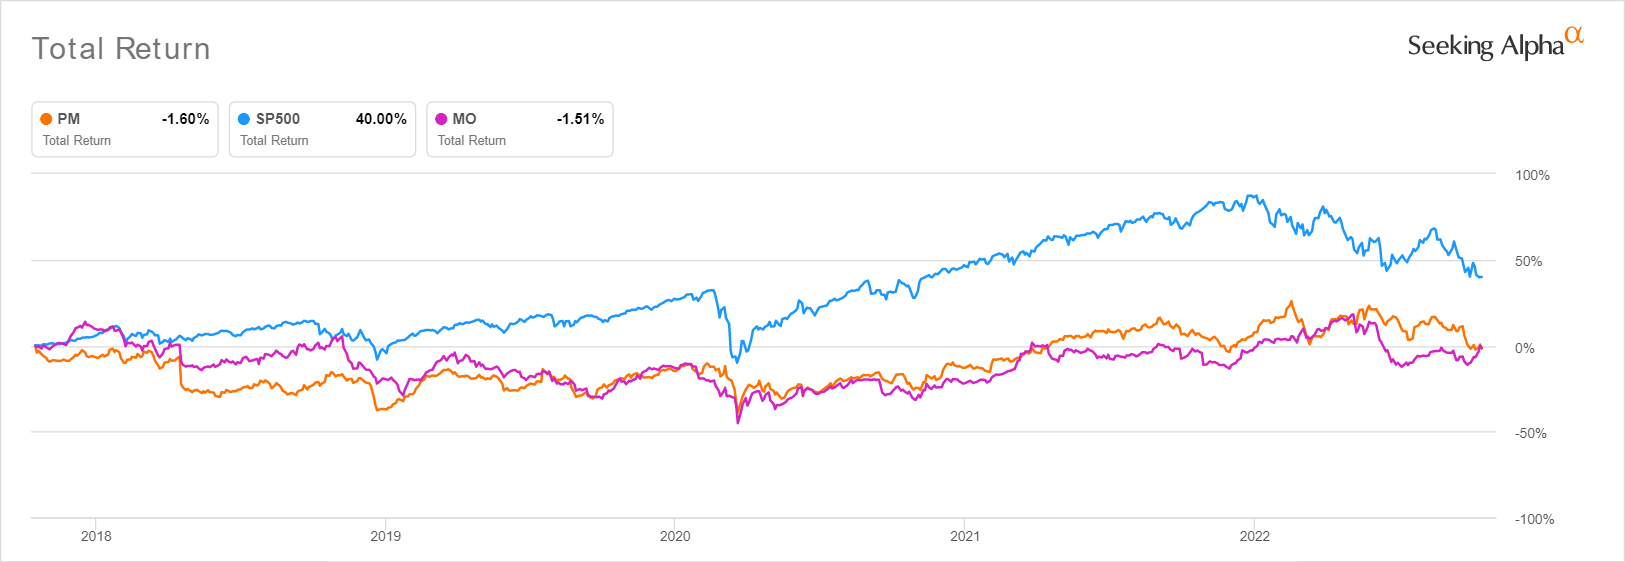
In the meantime, PM has (more or less) successfully acquired Swedish Match, while MO has had to terminate its exclusive agreement with Juul, laying the groundwork for a massive write-off in FQ3’22. Thereby, freeing MO for another expensive M&A activity ahead, if the company is in want of staying ahead in the e-cigarette game. On the other hand, PM has had a 5Y Total Price Return of -0.2% and a 10Y Return of 51.8%, while MO has done slightly better at a 5Y Return of -1.5% and a 10Y Return of 136.6%.
Combined with the surprisingly robust September CPI with sequentially increased spending on tobacco products by 0.2%, it is apparent that the US consumer consumption remains robust for now, despite the elevated YoY inflation of 8.2%. However, we do not expect both stocks to perform well in the short and intermediate term, given the continued pressure from the overly bearish Mr. Market. We are likely to enter a time of great uncertainty, given that 98.2% of analysts are projecting another 75 basis points hike during the Fed’s next November and, likely, December meeting. If we add raised terminal rates to the mix, we are in for a hell of a ride indeed. Investors, take care.
PM & MO Continues With Robust Dividend Payouts, Despite Temporary Headwinds
S&P Capital IQ
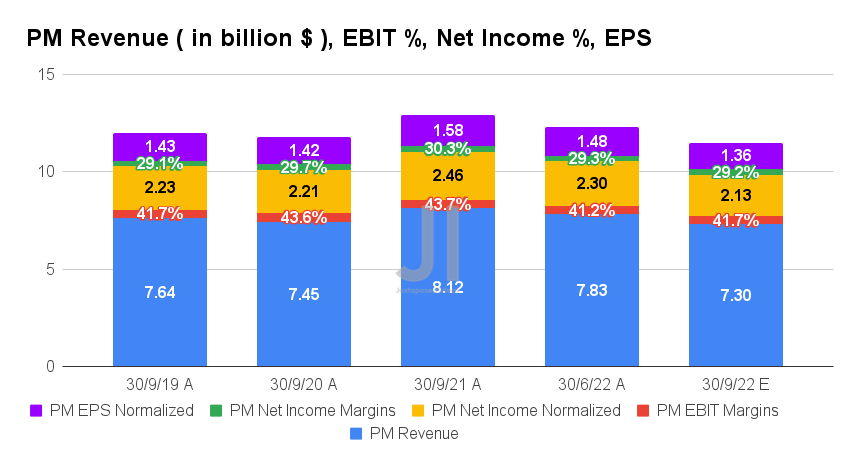
For its upcoming FQ3’22 earnings call, PM is expected to report revenues of $7.3B and EBIT margins of 41.7%, indicating massive declines of -10.09% and 2 percentage points YoY, respectively, attributed to the Russian and Ukraine war. Naturally, the company will report impacted profitability post forma, with net incomes of $2.13B, net income margins of 29.2%, and EPS of $1.36 for the next quarter. It represents a decline of -11.61%, -1.1 percentage points, and -13.92% YoY, respectively.
S&P Capital IQ
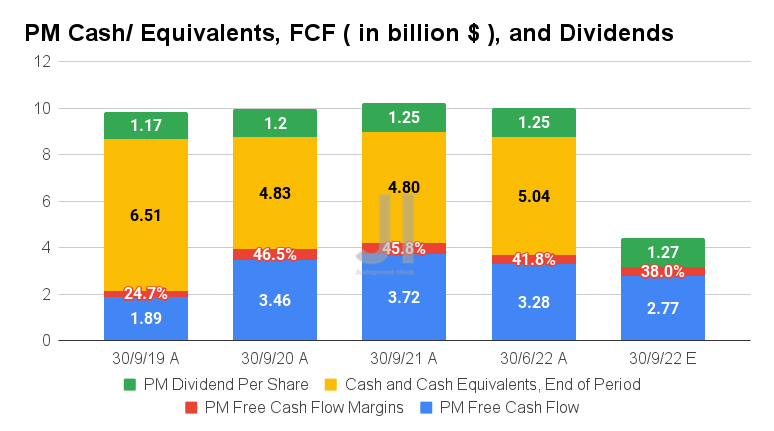
Consequently, PM will report a reduced Free Cash Flow (FCF) generation of $2.77B and an FCF margin of 38% in FQ3’22, indicating another YoY fall of -25.53% and -7.8 percentage points, respectively. Nonetheless, investors must take note that these levels still represent massive improvements from pre-pandemic levels by 46.56% and 13.3 percentage points in FQ3’19, respectively. Its robust cash and equivalents of $5.04B on its balance sheet remain more than sufficient to weather the worsening macroeconomics as well.
Combined with the projected $1.27 dividend payout for the next quarter, it is evident that PM’s current stock premium is well justified in the current bear market.
S&P Capital IQ
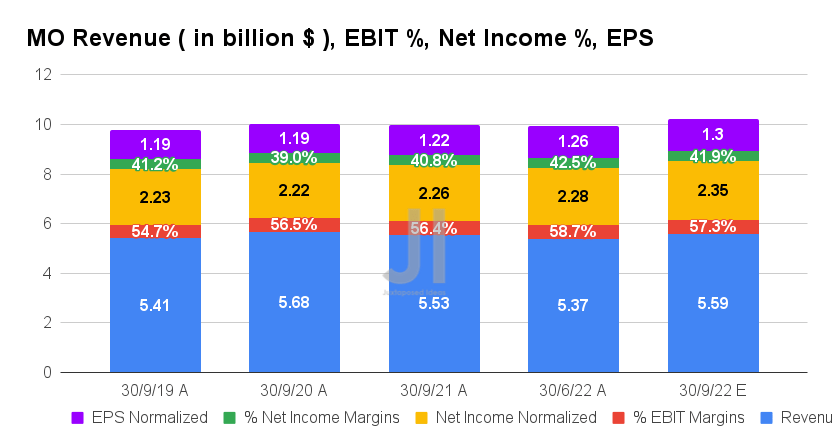
In the meantime, MO is expected to report revenues of $5.59B and EBIT margins of 57.3% for its upcoming FQ3’22 earnings call, interestingly indicating an improvement YoY by 1.08% and 0.9 percentage points, respectively. Naturally, its profitability will also improve, with adj. net incomes of $2.35B and net income margins of 41.9% for the next quarter. It represents a notable increase of 3.98% and 1.1 percentage points YoY, respectively. However, with the history of underwhelming investments thus far, we may see more write-offs ahead from MO.
Nonetheless, MO will likely be paying out $0.94 in dividends for the next quarter as well, indicating a 4.4% increase YoY then. With a robust $2.63B of cash and equivalents on its balance sheet in FQ2’22, the company’s liquidity and dividend safety remain decent ahead.
Dividends Remain Secure For Now, Due To Their Improved Forward Profitability
S&P Capital IQ
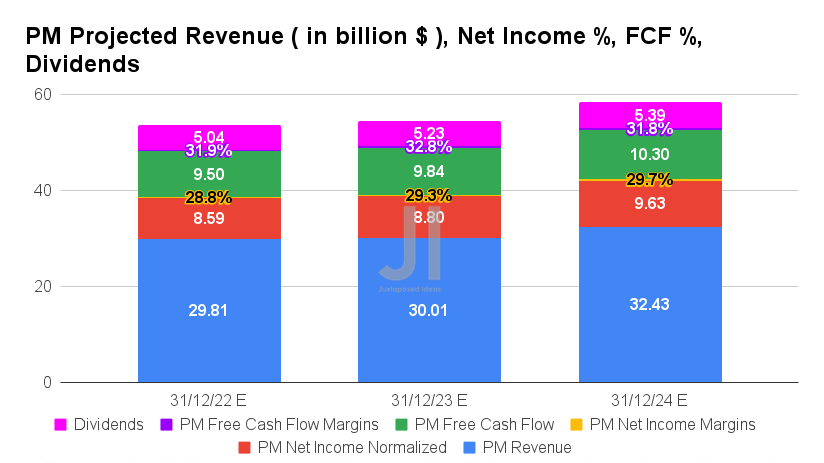
PM is expected to report an adj. revenue, adj. net income, and adj. FCF growth at a CAGR of 1.71%, 3.60%, and 2.22%, respectively, between FY2019 and FY2024. The company is also expected to report decent normalized growth in profitability despite the impact from Russia and Ukraine, from adj. net income/ FCF margins of 27.1%/31% in FY2019, 30.2%/35.7% in FY2021, and finally to 29.7%/31.8% by FY2024. Nonetheless, we expect slower dividend growth ahead, as the company works off the massive $16B debt for its recent Swedish Match all-cash deal.
In the meantime, PM is expected to report revenues of $29.81B and adj. net incomes of $8.59B in FY2022, indicating a notable YoY decline of -5.1% and -9.4%, respectively. Thereby, impacting its FCF generation by -15.3% YoY to $9.49B. However, consensus estimates remain optimistic about its dividend safety, with the projected dividend payout of $5.04 indicating a 2.85% YoY growth and a decent 5.91% dividend yield for the fiscal year, compared to its 4Y average of 5.5%.
S&P Capital IQ
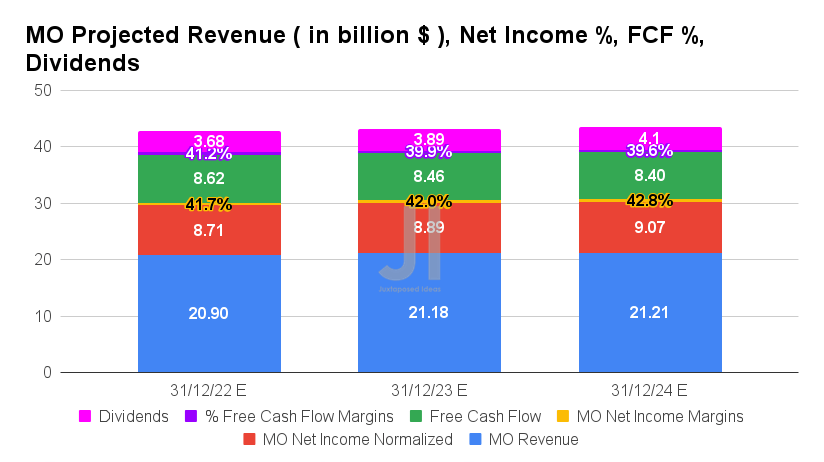
MO is expected to report an adj. revenue, adj. net income, and adj. FCF growth at a CAGR of 1.40%, 4.44%, and 2.05%, respectively, between FY2019 and FY2024. Similarly to PM, the improvement in its profitability is excellent too, from adj. net income/ FCF margins of 39.9%/38.3% in FY2019, 40.4%/39% in FY2021, and finally to 42.8%/39.6% by FY2024.
Meanwhile, MO is expected to report revenues of $20.9B and adj. net incomes of $8.71B for FY2022, representing a decline of -0.99% though an increase of 2.3% YoY, respectively, attributed to the tougher YoY comparison with the negative impact from Juul. However, with the projected YoY growth of 4.7% in its FCF generation, we expect to see an excellent increase of 4.1% in its dividend payouts to $3.68 for the fiscal year. Thereby, indicating a robust dividend yield of 8.31% based on MO’s current share prices, improved from its average 4Y yield of 7.24%.
We encourage you to read our previous article on MO, which would help you better understand its position and market opportunities.
- Altria: After Juul, Anheuser-Busch InBev Is Another Big Problem
So, Is PM & MO Stock A Buy, Sell, or Hold?
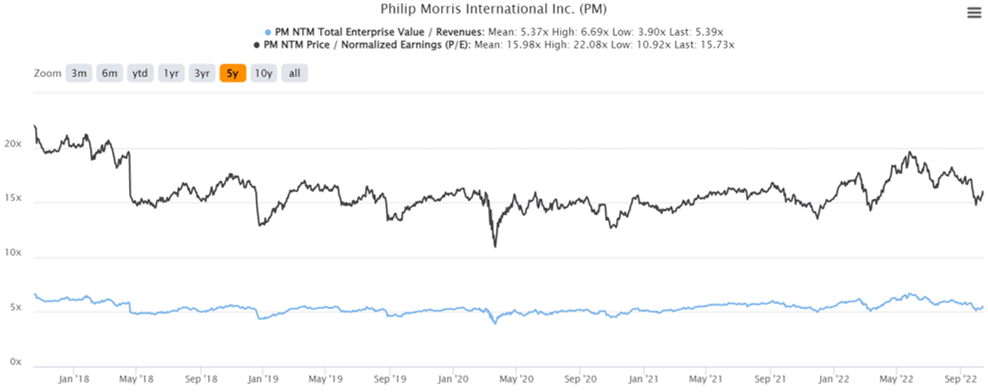
PM 5Y EV/Revenue and P/E Valuations
S&P Capital IQ
PM is currently trading at an EV/NTM Revenue of 5.39x and NTM P/E of 15.73x, relatively in line with its 5Y mean. The stock is also trading at $85.26, down -24.19% from its 52 weeks high of $112.48, nearing its 52 weeks low of $82.85. Nonetheless, consensus estimates remain bullish about PM’s prospects, given their price target of $103.20 and a 21.04% upside from current prices.
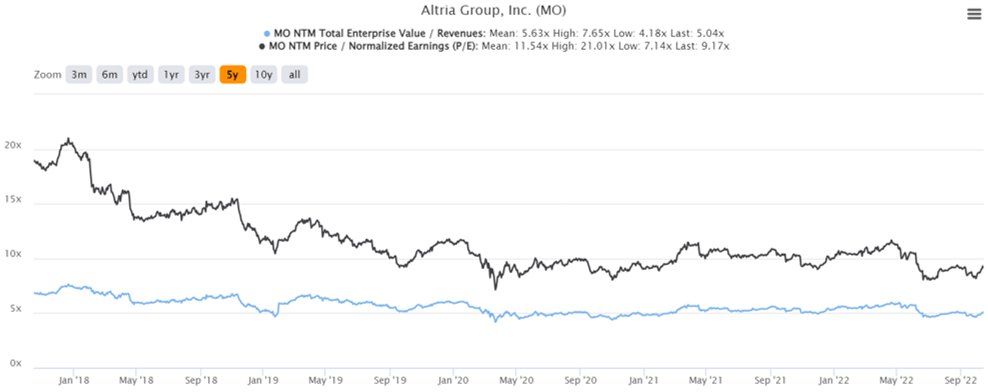
MO 5Y EV/Revenue and P/E Valuations
S&P Capital IQ
In the meantime, MO is trading at an EV/NTM Revenue of 5.04x and NTM P/E of 9.17x, relatively in line with its 5Y EV/Revenue mean of 5.63x though lower than its 5Y P/E mean of 11.54x. The stock is also trading at near-bottom levels of $45.23, down -20.71% from its 52 weeks high of $57.05, nearing its 52 weeks low of $40.35. Its Juul segment continues to drag down MO’s prospects as well, given the minimal 6.85% upside from the consensus price target of $48.33.
PM & MO 5Y Total Price Return
Ycharts
Given the abovementioned factors, we rate both stocks as Hold for now. However, if we really must choose one, the clear choice is MO, due to the improved returns thus far and the forward dividend yield of up to 8.09%. If investors had missed the recent bottom at the end of September, we might see more chances post-FQ3’22 earnings call, due to MO’s historical top-line misses over the past two quarters. Another speculative correction to $40 would also indicate a more attractive entry point for long-term investing, with an improved dividend yield of 9.06%.
Nonetheless, we must also highlight the market’s massive volatility thus far, with the S&P 500 Index already breaking its previous June lows and plunging by -25.3% YTD. Therefore, investors with higher risk tolerance would still be well advised to size their portfolios accordingly.
Be the first to comment