

ekinyalgin
An edited version of this article was published on Dividend Kings on Tuesday, December 13th.
—————————————————————————————
Inflation is expected to remain elevated through 2025. That means higher rates for longer and more financial struggles for American workers.
It also means a likely recession in 2023 and a potential 16% to 28% market decline in the first half of 2023. But just because the market is likely to hit new lows in this bear market doesn’t mean there aren’t relatively safe high-yield blue-chip opportunities you can buy today.
Ycharts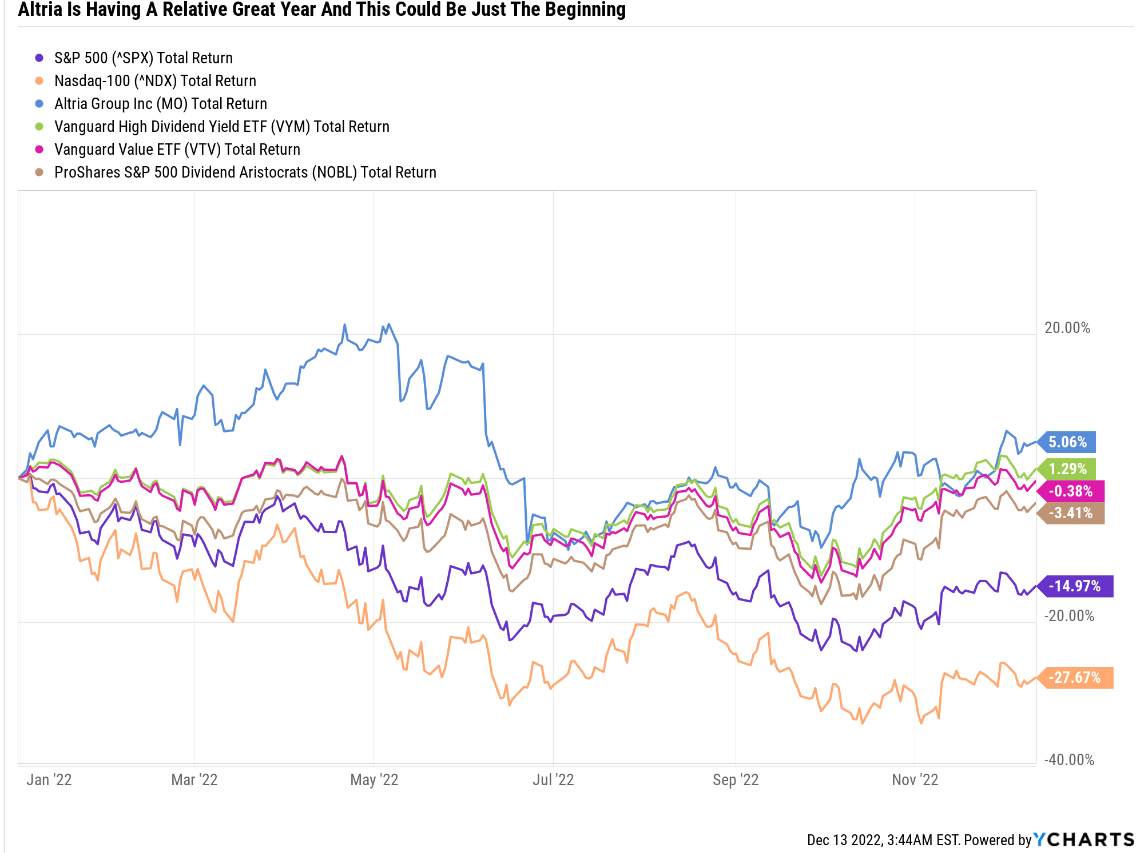
2022 has been the year of the great value rotation, with dividend kings like Altria Group, Inc. (NYSE:MO) delivering very solid 5% total returns, 20% better than the S&P 500.
Let me show you three reasons why Altria is the perfect 8% yielding dividend king for 2023 and far beyond. In fact, I’ll show you why MO’s red-hot performance could last many years.
Are you interested in achieving a 10.5% yield on MO? Let me show you how.
Reason One: Altria’s Bull Market Could Be Just Getting Started
MO is one of the best-performing blue-chips on Wall Street in 2022. It’s outperformed not just the S&P and Nasdaq but also value, most dividend stocks, and the dividend aristocrats.
That shouldn’t come as a surprise to students of market history for two reasons.
Daily Shot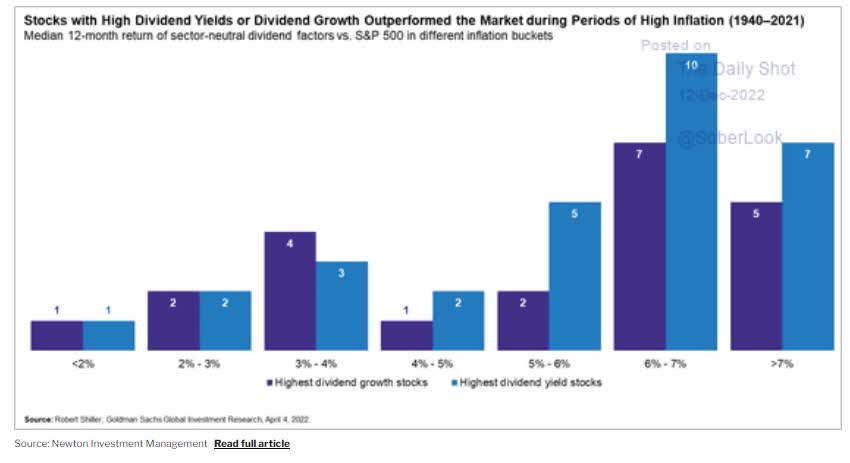
Historically periods of high inflation see high-yield stocks outperform the most. According to the Fed and blue-chip economist consensus, elevated inflation is expected to be with us until 2025.
Altria’s 45% Bear Market Is Its 2nd Worst In 37 Years
FAST Graphs, FactSet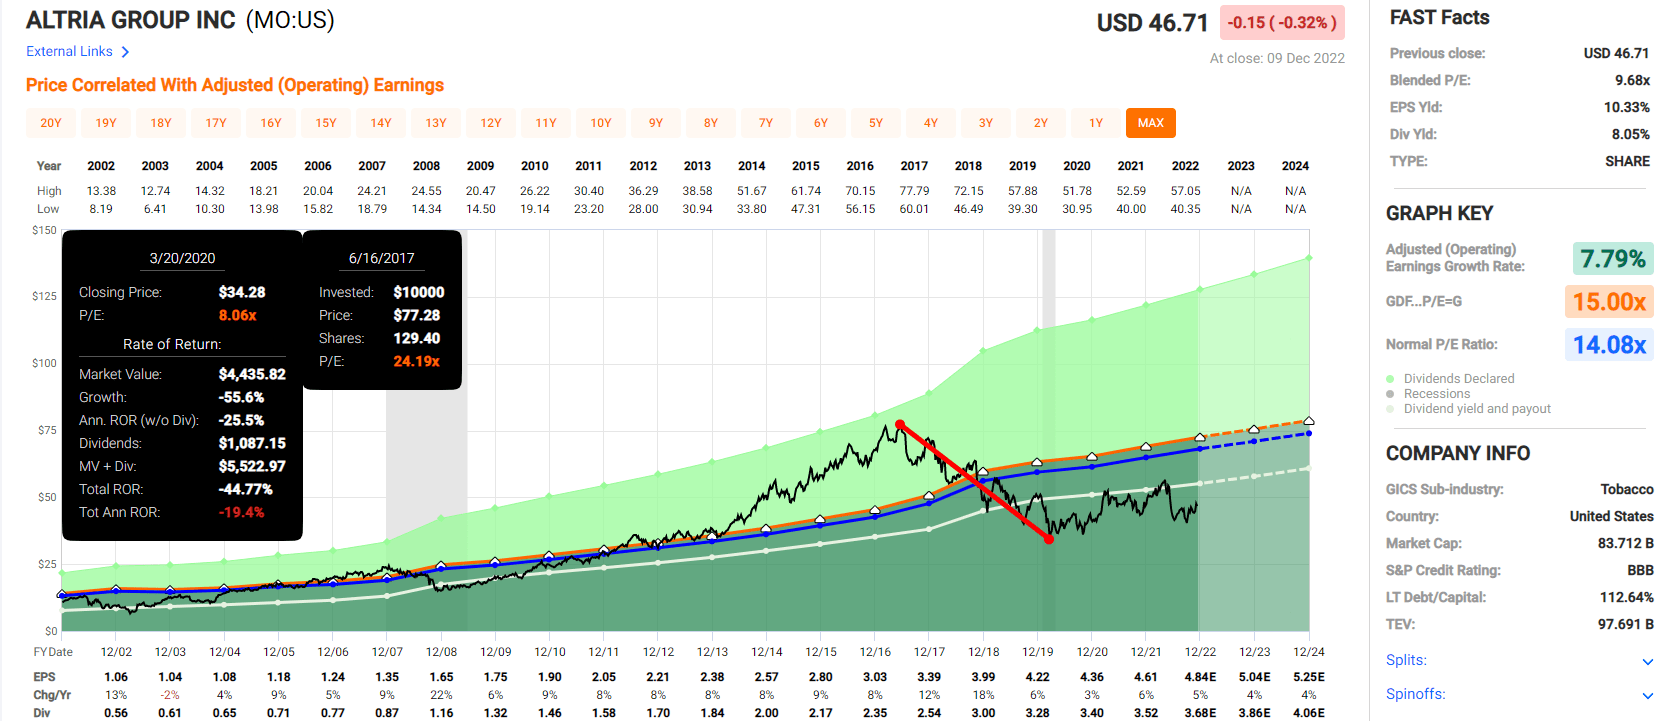
Altria’s 45% bear market is the 2nd worst it’s experienced in 37 years. That bear market was triggered by the TINA (there is no alternative) low-interest rate bubble in high-yield stocks.
It crested with MO’s P/E at 24, a 71% historical premium.
For context, the S&P 500’s worst bubble in history, which ended in March 2000, saw the S&P “just” 50% historically overvalued.
Why Buying Altria During Bear Markets Can Offer Life-Changing Income And Wealth
FAST Graphs, FactSet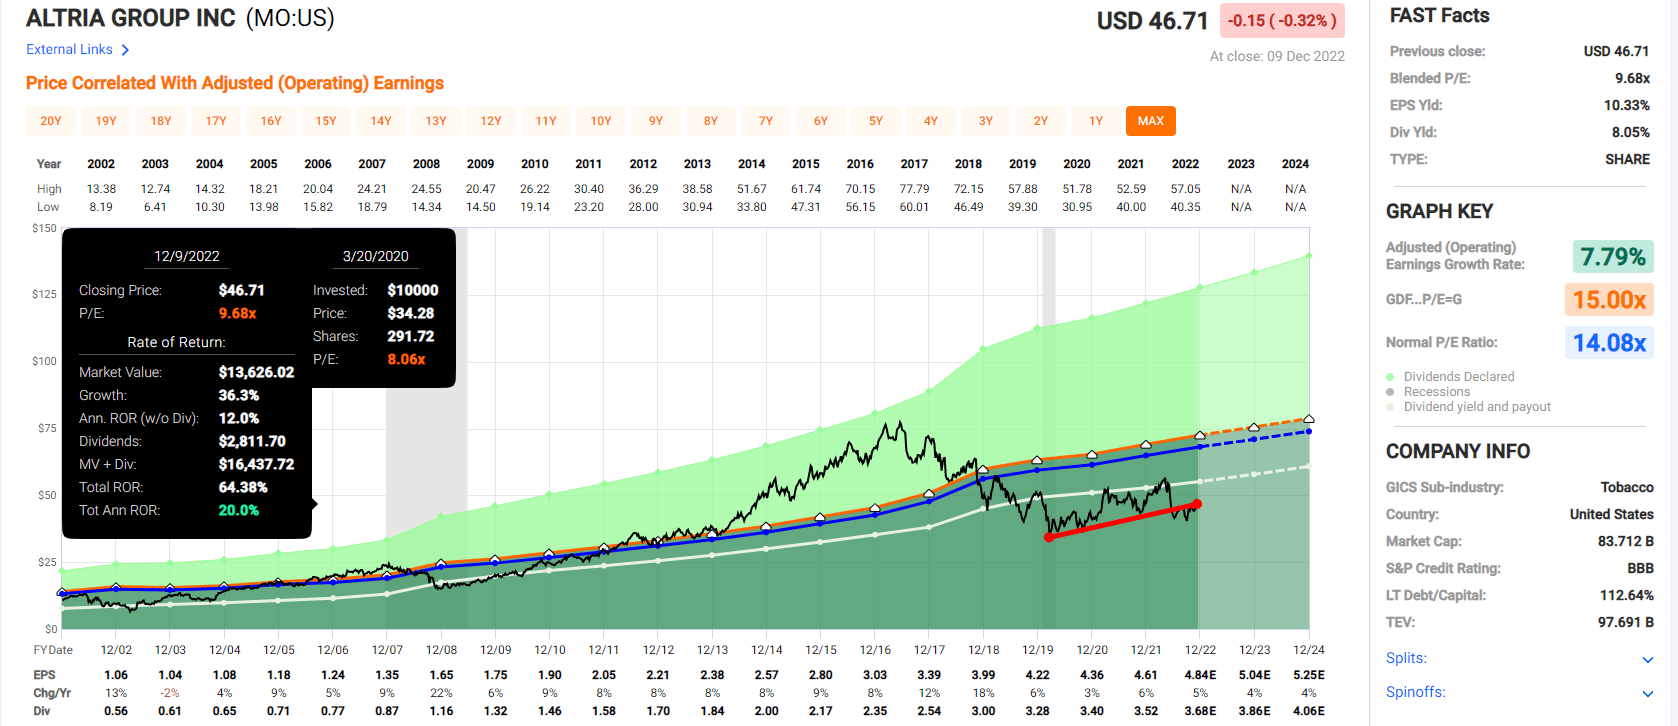
Since bottoming in the Pandemic, MO has delivered 20% annual returns.
- the same as it’s delivered over the last 90 years
- when it delivered 137,000X inflation-adjusted returns
- the best-performing stock in history
MO matched Buffett’s historical returns of 20% but for nearly twice as long.
And it just did it again, from its most recent bear market low, while still in a bear market.
Why The 2023 Rally Could Be Just The Beginning
Portfolio Visualizer Premium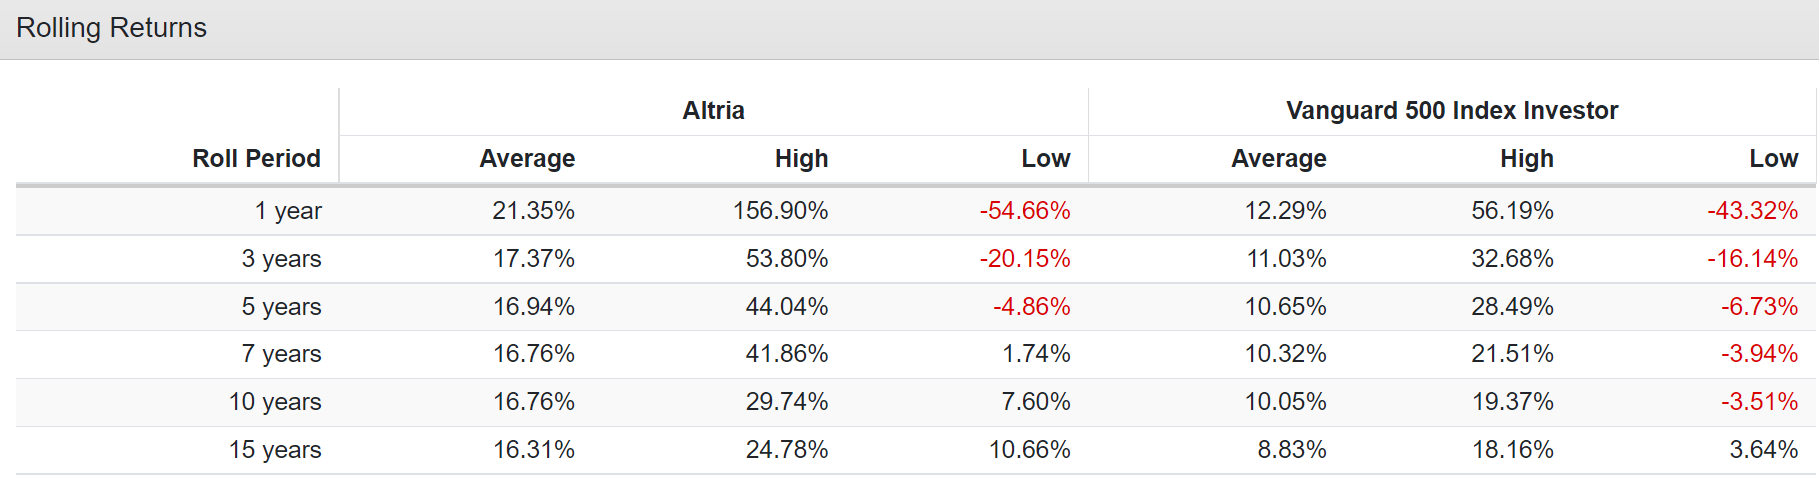
From bear market lows, MO is capable of delivering life-changing returns.
- up to 157% in one year
- up to 54% annual returns for three years = 3.7X
- up to 44% annual returns for five years = 6.2X
- up to 42% annual returns for seven years = 11.6X
- up to 30% annual returns for 10 years = 13.8X
- up to 25% annual returns for 15 years = 28.4X
Of course, that’s only if the investment thesis remains intact.
The Challenges Altria Is Facing Today To Its Growth Thesis
earnings presentation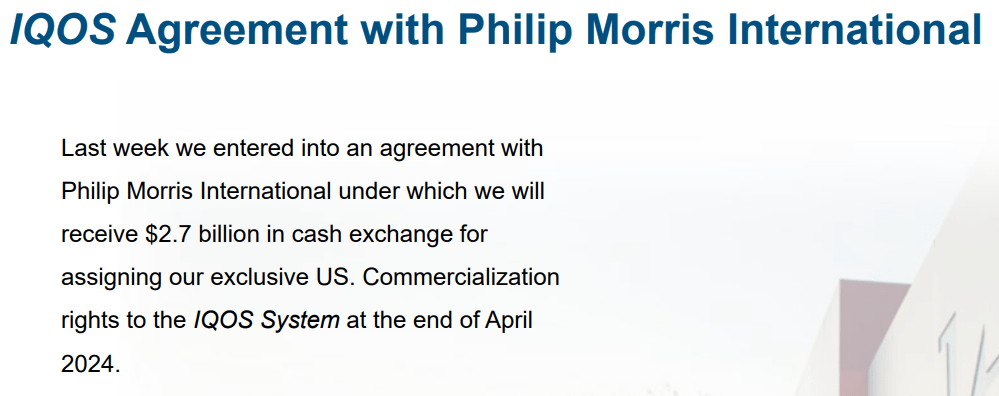
MO accepting a $2.7 billion buyout of the iQOS licensing rights in the U.S. is both good and bad. It means that PM will compete with MO with the world’s most popular heat sticks in the US.
The plus side is that MO will now have a small fortune with which to accelerate its reduced-risk plans in the US, which ended rather poorly with the complete write-down of its $13 billion Juul investment.
- MO’s only RRP produce currently is On! oral nicotine pouches.
earnings presentation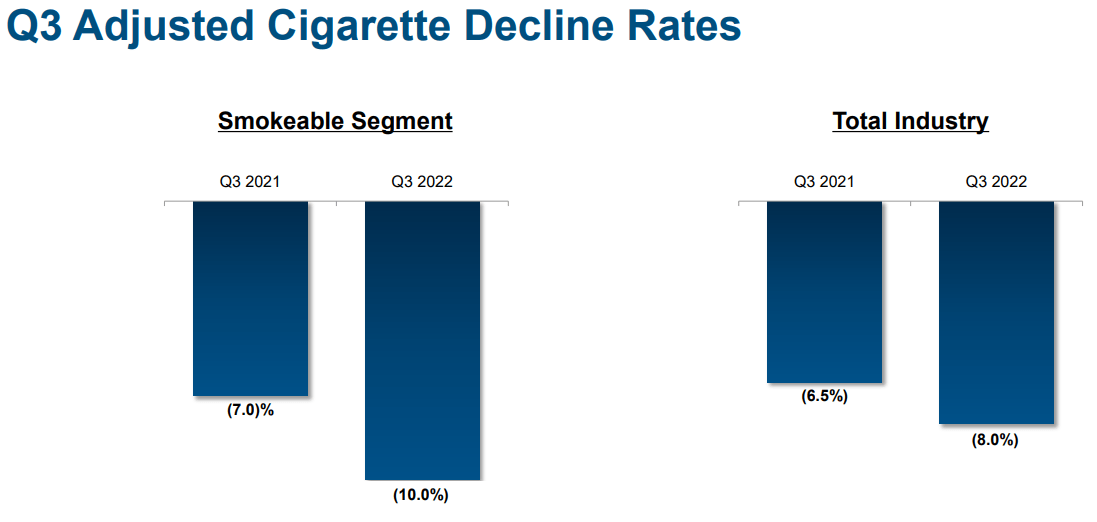
Just like the U.S., MO’s cigarette volume declines have accelerated in recent years.
Management blames high inflation and gas prices for causing some consumers to switch to lower-priced brands, explaining why its own volume declines have been slightly worse.
earnings presentation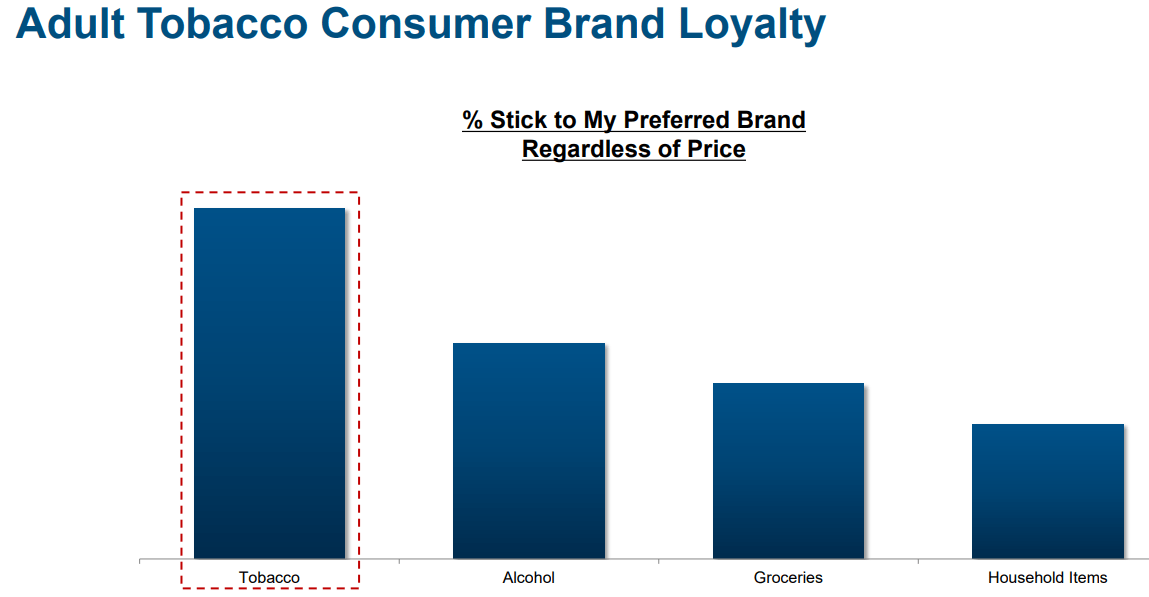
While tobacco brand loyalty is the best of any product, it does have its limits.
earnings presentation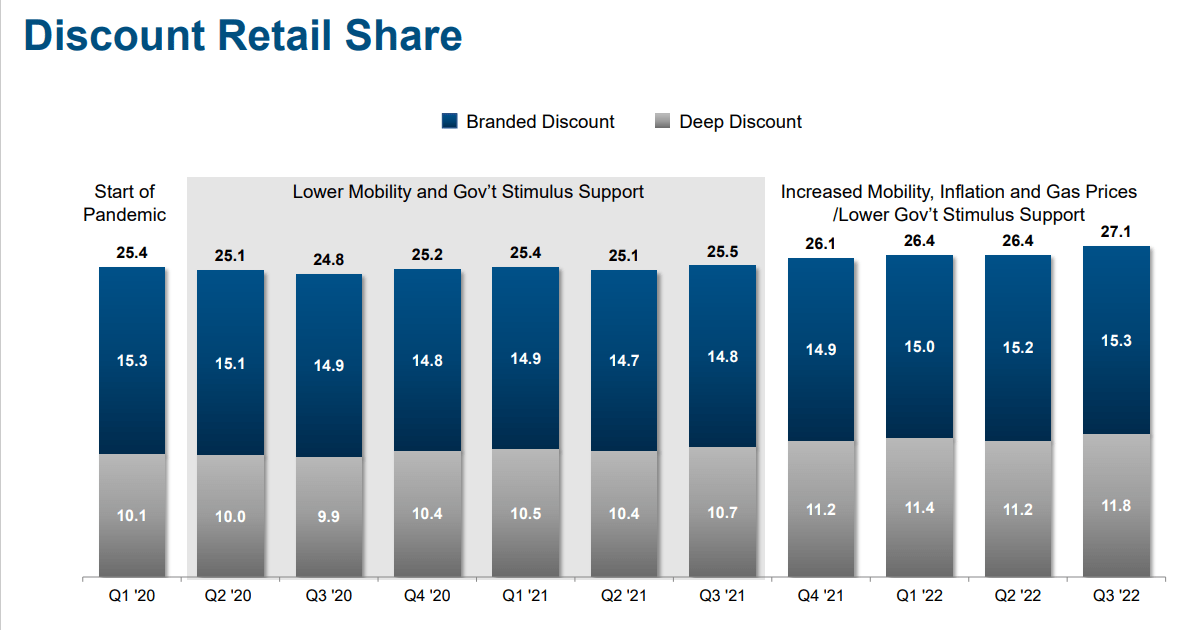
Falling inflation and gas prices should act as a tailwind for MO to stabilize its market share going forward. And overall, Marlboro’s market share has remained relatively steady.
earnings presentation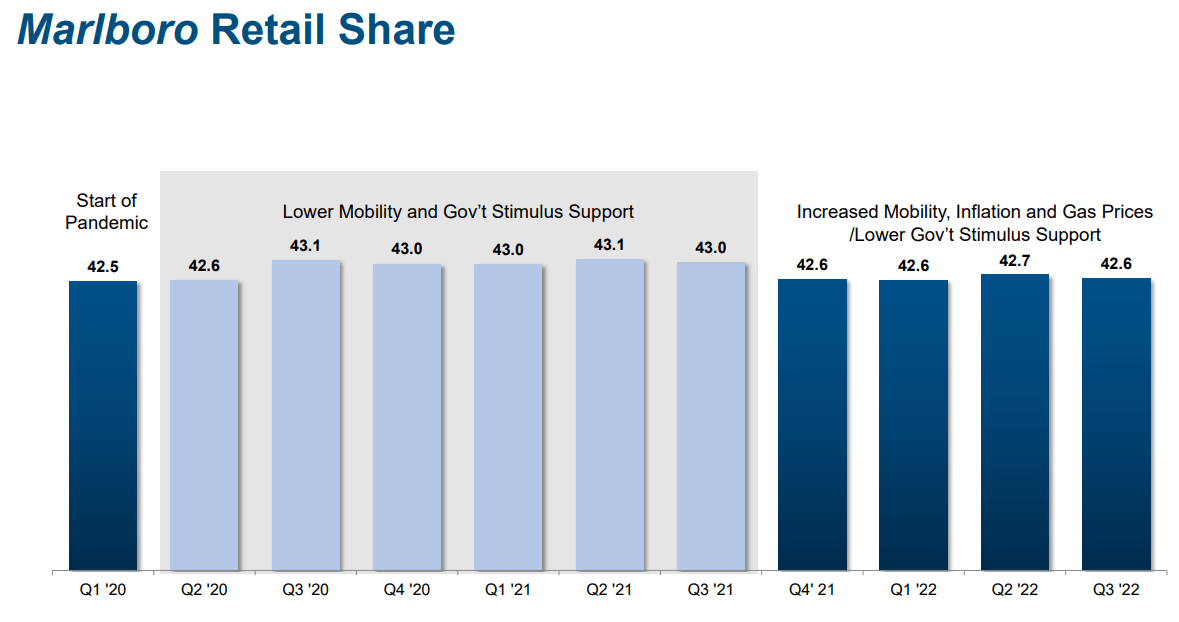
In fact, MO’s market share in U.S. premium cigarettes went up in the most recent quarter.
earnings presentation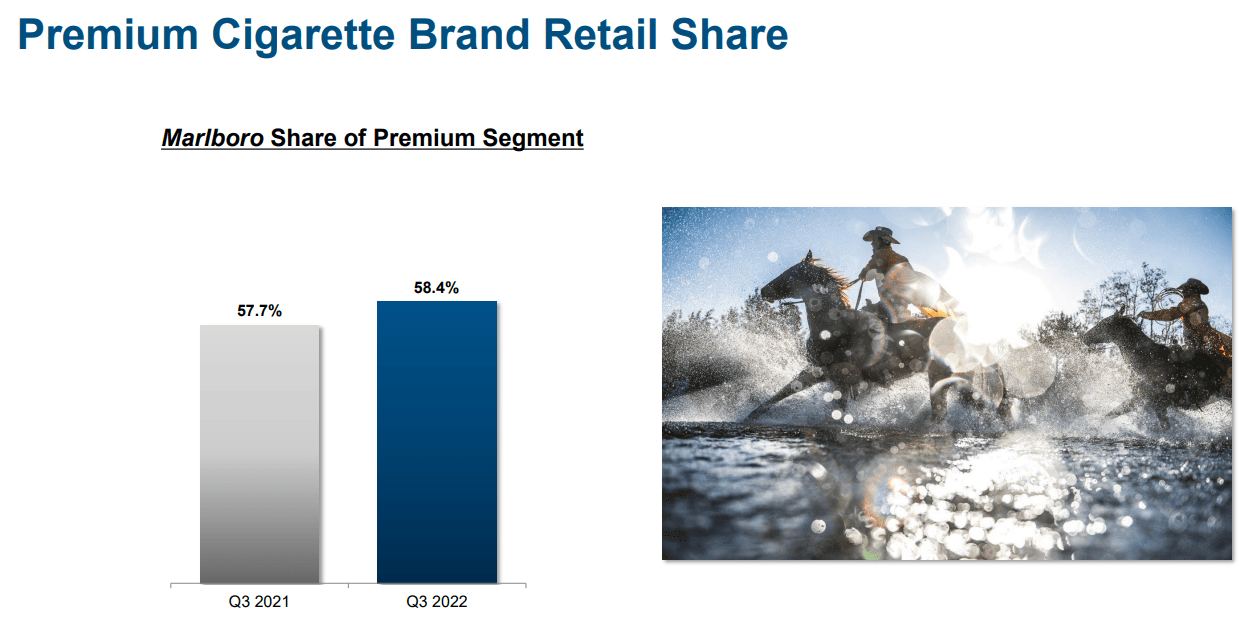
However, that won’t save its long-term investment thesis unless it can make quicker progress on its smoke-free future plans.
Since 2011, a series of Draconian anticigarette measures in Australia have led to the introduction of plain packs and tax increases that caused the doubling of the retail price of cigarettes in just six years, which in turn has led to the smoking rate falling from 16% to 13% over the same period, and to significant trading-down between price segments. A pack of 20 cigarettes (equivalent; a standard pack contains 25 sticks in Australia) now costs roughly USD 25, well above the USD 6.65 in the U.S., according to the National Cancer Institute. We analyzed the affordability of cigarettes by estimating the number of minutes of labor required, on average, to purchase a pack of 20 cigarettes. We found that the U.S. was the fourth most affordable cigarette market among the 35 OECD nations.” – Morningstar
Morningstar estimates MO has about 30 years before it will lose the ability to raise its prices enough to offset volume declines it estimates as 4% long term.
earnings presentation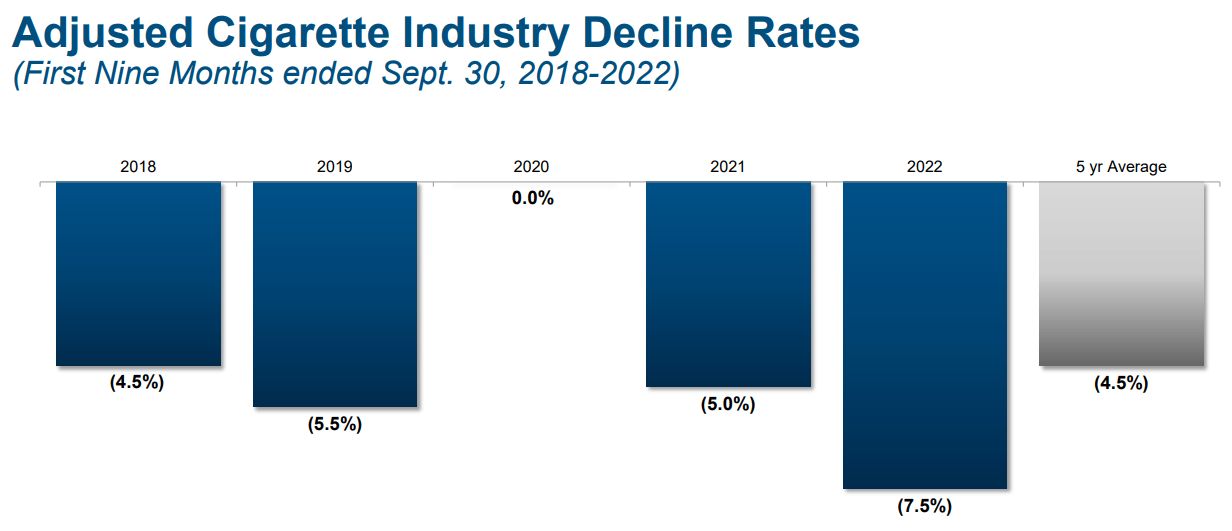
The five-year average volume decline rate is 4.5%, which means MO might have slightly less time to move to a tobacco-free future.
- A lot less if current volume declines continue.
How Altria Plans To Overcome Its Growth Challenges
earnings presentation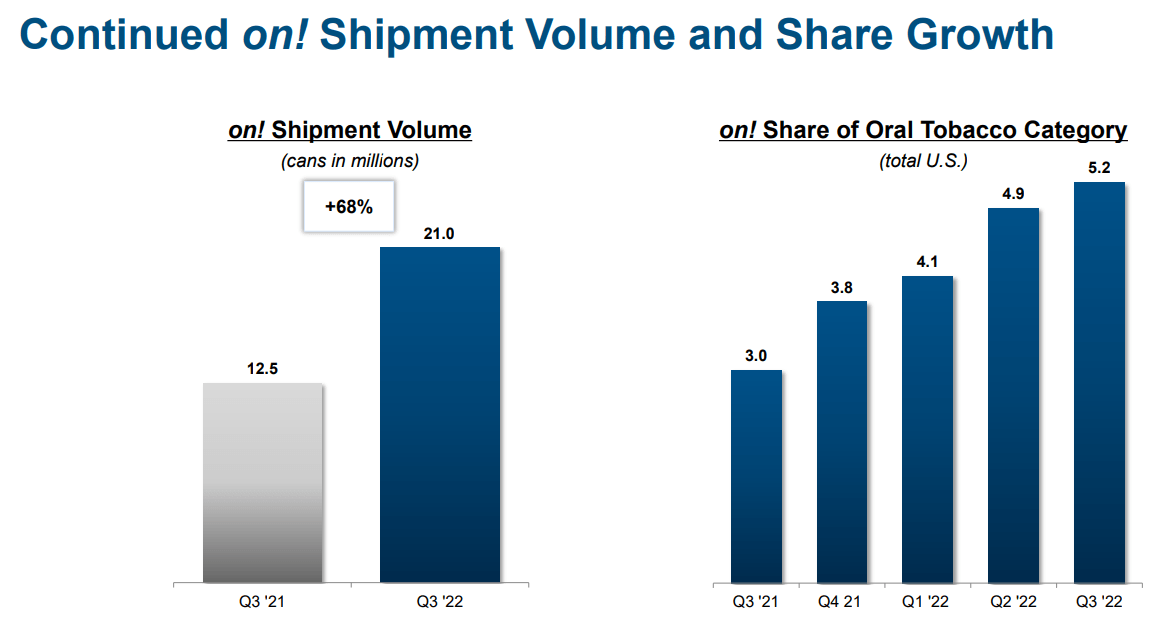
MO’s sole reduced-risk or RRP product, on, is growing like a weed. Volumes were up 68% in Q3, and its market share is up from 3% to 5.2% in the last year.
earnings presentation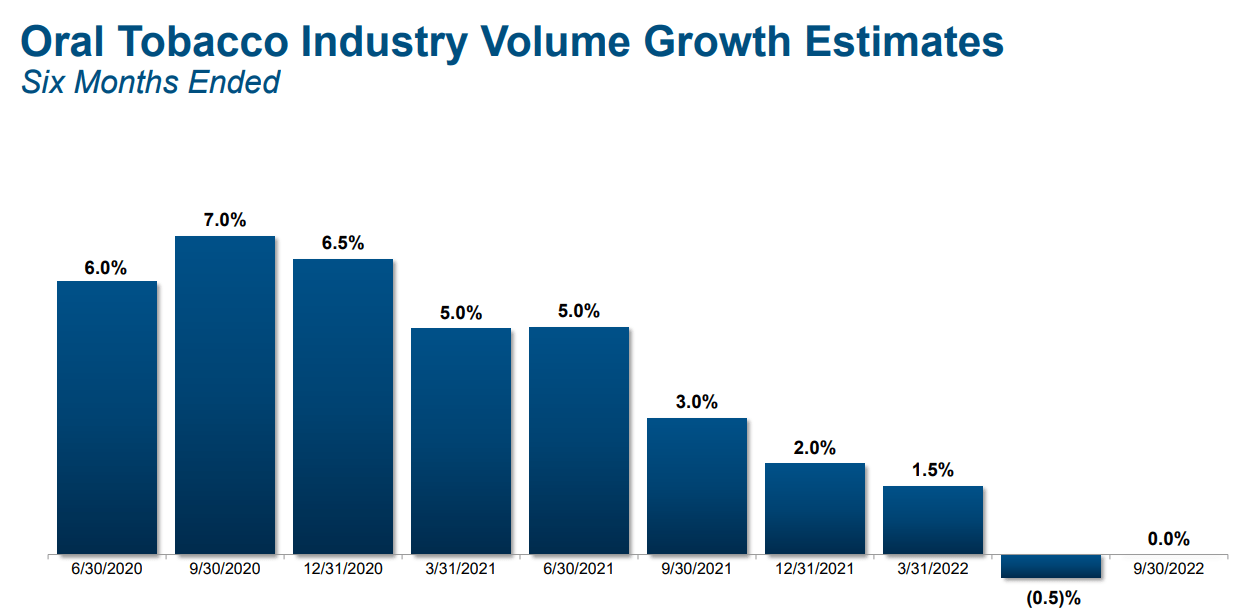
The good news for MO is that oral tobacco is holding the massive gains achieved during the Pandemic. The bad news is that just 12% of sales and 14% of operating profits come from oral tobacco.
- on! is a great start in RRPs but won’t help replace cigarettes.
Altria Announces Strategic Partnership With JT Group and Expanded Heated Tobacco Portfolio
earnings presentation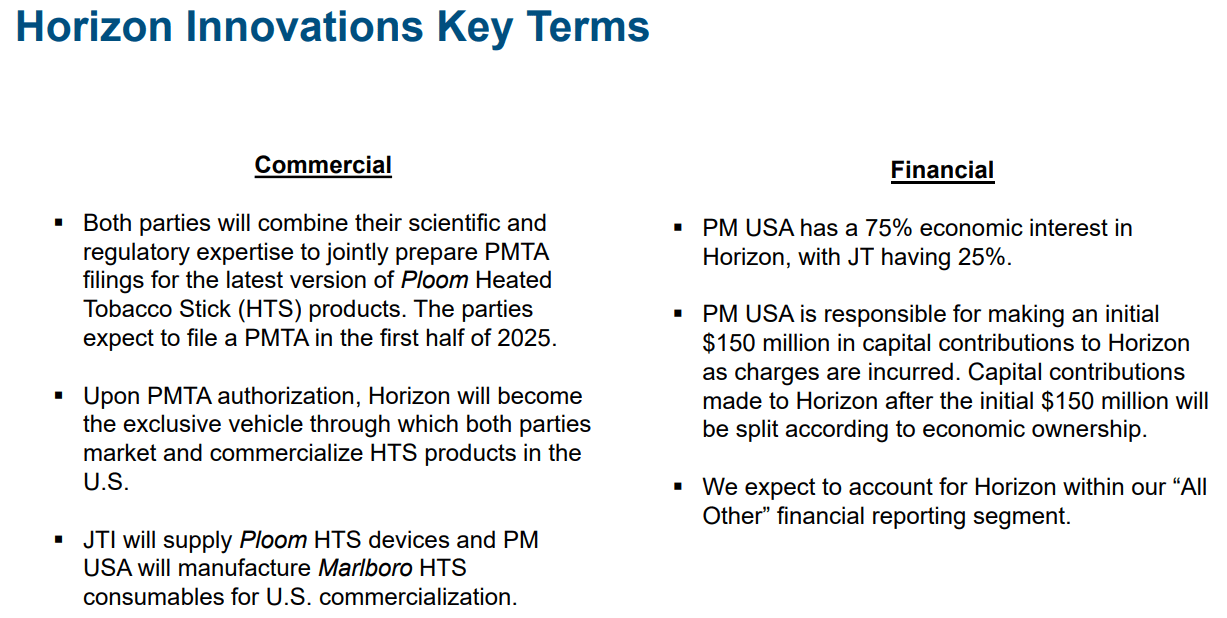
The new joint venture with Japan Tobacco (OTCPK:JAPAY) involves MO investing $113 million into marketing JT’s Ploom heatsticks.
Why is the focus on heat sticks and not on vaping?
earnings presentation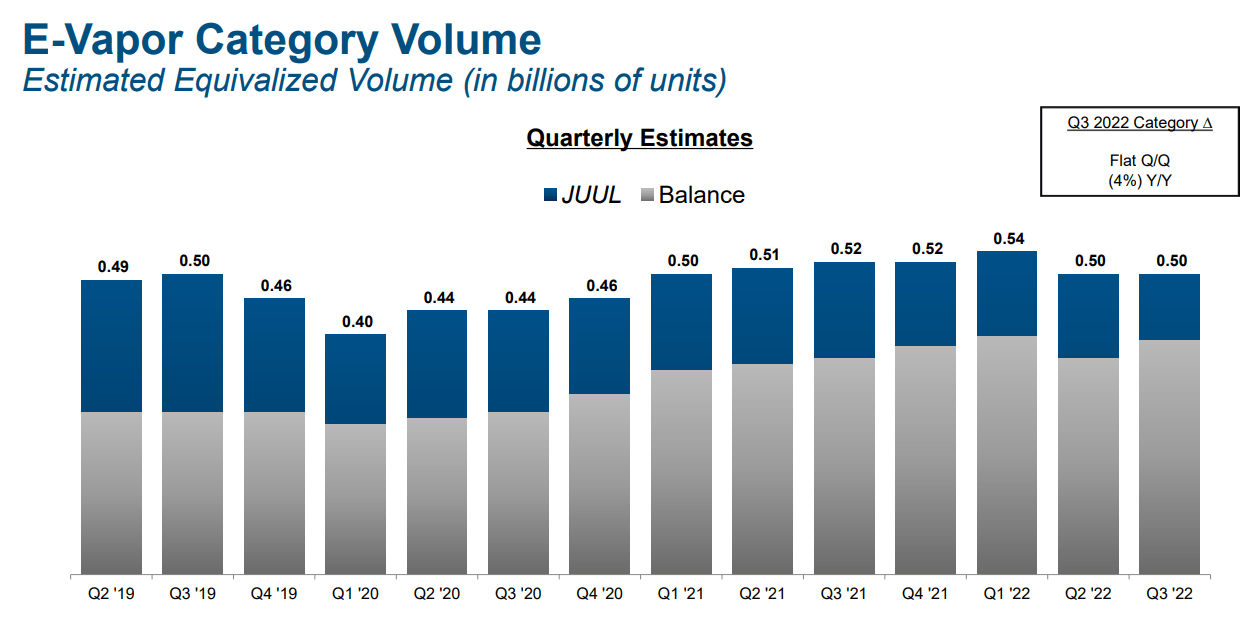
Because, just like in other countries, smokers prefer the experience of heat sticks to vaping as it’s more similar to legacy cigarettes. This is likely why vaping volume has been steady but not growing for the past three years.
- the FDA crackdown on Juul has caused its market share to shrink steadily
- this is why MO ended its non-compete with Juul
earnings presentation earnings presentation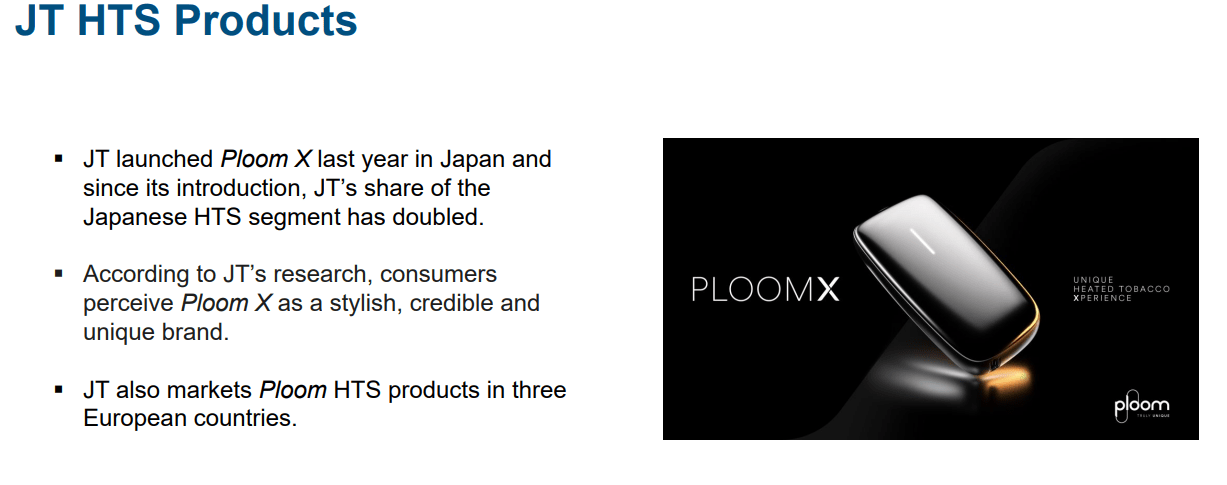
MO is spending about 10% of its PM iQos buyout funds on the Horizon JV and is also considering its own heat sticks, which it views as the future of the RRP nicotine industry.
Since its introduction, JT’s doubled its share of the Japanese HTS segment. JT estimates that there are more than 1 million Ploom X consumers, and according to their research, these consumers perceive Ploom X as a stylish, credible, and unique brand. Consumers also describe the product as easy to use. We look forward to bringing the newest version of this exciting product to US smokers. We have discussed our increased focus and investment in an internal wholly-owned heated tobacco product development.” – CEO, Q3 conference call (emphasis added).
What does all this mean for MO’s sales growth in the future? Here is the analyst consensus.
Altria Consensus Growth 2023 To 2025
| Metric | Company Total (Includes Taxes) | Smokeable Products | Smokeless Products |
| Sales | 1.0% | 2.7% | 3.9% |
| Operating Income | 1.4% | 1.5% | 3.3% |
| Net Income | 2.6% | ||
| EPS | 4.0% | ||
| Dividend | 3.7% |
(Source: FactSet Research)
MO’s new joint RRP plans are expected to result in faster RRP sales growth of about 4% over the next three years.
Continued price increases are expected to keep cigarette revenue growing at about 3%, though high taxes are expected to result in slow but steady 1% sales growth.
Cost-cutting is expected to convert 1% sales growth into 2.6% net income growth, and then 1.4% annual buybacks boost that to 4% over the next three years.
And the dividend is expected to grow in line with earnings at about 4%, as MO maintains an approximate 75% payout ratio.
- its’ official policy is an 80% payout ratio
- below the 85% rating agencies consider safe for this industry
Reasons To Potentially Buy Altria Today
| Metric | Altria |
| Quality | 99% 13/13 Ultra SWAN (Sleep Well At Night) Quality Dividend King |
| Risk Rating | Medium Risk |
| DK Master List Quality Ranking (Out Of 500 Companies) | 19 |
| DK Master List Quality Percentile | 96% |
| Dividend Growth Streak (Years) | 53 |
| Dividend Yield | 8.0% |
| Dividend Safety Score | 100% |
| Average Recession Dividend Cut Risk | 0.5% |
| Severe Recession Dividend Cut Risk | 1.00% |
| S&P Credit Rating |
BBB Stable Outlook |
| 30-Year Bankruptcy Risk | 7.50% |
| LT S&P Risk-Management Global Percentile |
45% Average, Medium Risk |
| Fair Value | $69.94 |
| Current Price | $46.96 |
| Discount To Fair Value | 33% |
| DK Rating |
Potential Very Strong Buy |
| P/E | 9.3 |
| Cash-Adjusted P/E | 8.6 |
| Growth Priced In | 0.2% |
| Historical P/E | 14 to 16 |
| LT Growth Consensus/Management Guidance | 5.0% |
| 5-year consensus total return potential |
15% to 19% CAGR |
| Base Case 5-year consensus return potential |
16% CAGR (3X S&P 500) |
| Consensus 12-month total return forecast | 12.0% |
| Fundamentally Justified 12-Month Return Potential | 57% |
| LT Consensus Total Return Potential | 13.0% |
| Inflation-Adjusted Consensus LT Return Potential | 10.7% |
| Consensus 10-Year Inflation-Adjusted Total Return Potential (Ignoring Valuation) | 2.76 |
| LT Risk-Adjusted Expected Return | 8.42% |
| LT Risk-And Inflation-Adjusted Return Potential | 6.09% |
| Conservative Years To Double | 11.8 vs. 14.6 S&P |
(Source: Dividend Kings Zen Research Terminal)
MO’s long-term growth outlook has actually improved from 4.6% to 5.0% since the iQos buyout announcement.
It’s currently priced for about 0.2% long-term growth, 25X less than what analysts actually expect.
Even if MO never regains its former P/E, the long-term return potential is 8% yield + 5% growth = 13%.
If MO returns to historical fair value within five years (historically likely given the growth to value rotation), then 15% to 19% annual returns are expected with the consensus base case of 16%.
- 2.5X more than the S&P 500
Altria 2024 Consensus Total Return Potential
(Source: FAST Graphs, FactSet)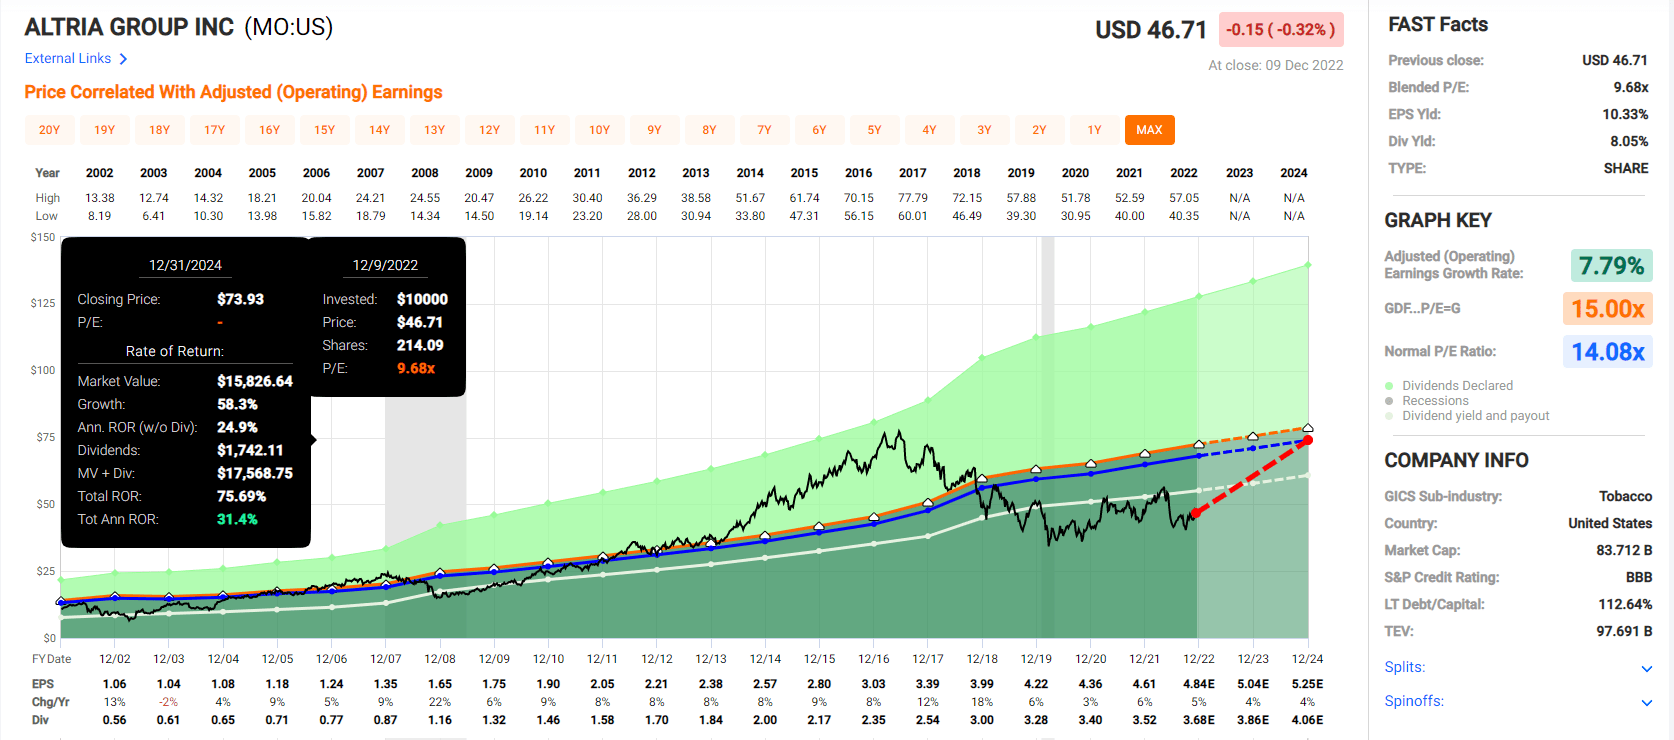
To give you a sense of how overvalued MO was in 2017, analysts expect approximately $74 per share at the end of 2024 if it grows as expected (it almost always does) and returns to the low end of historical fair value.
- MO peaked at $78 in 2017.
By 2025 MO’s historical fair value will rise to $76.
Fortunately for anyone buying today, at a 33% discount, the return potential is an impressive 76%, 31% per year.
- About 3.5X more than the S&P 500
- compared to MO’s 3-year return of 20% CAGR
- Buffett-like return potential from a high-yield dividend king bargain hiding in plain sight
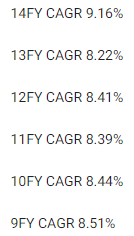
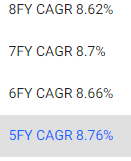
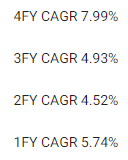
Altria 2028 Consensus Total Return Potential
(Source: FAST Graphs, FactSet)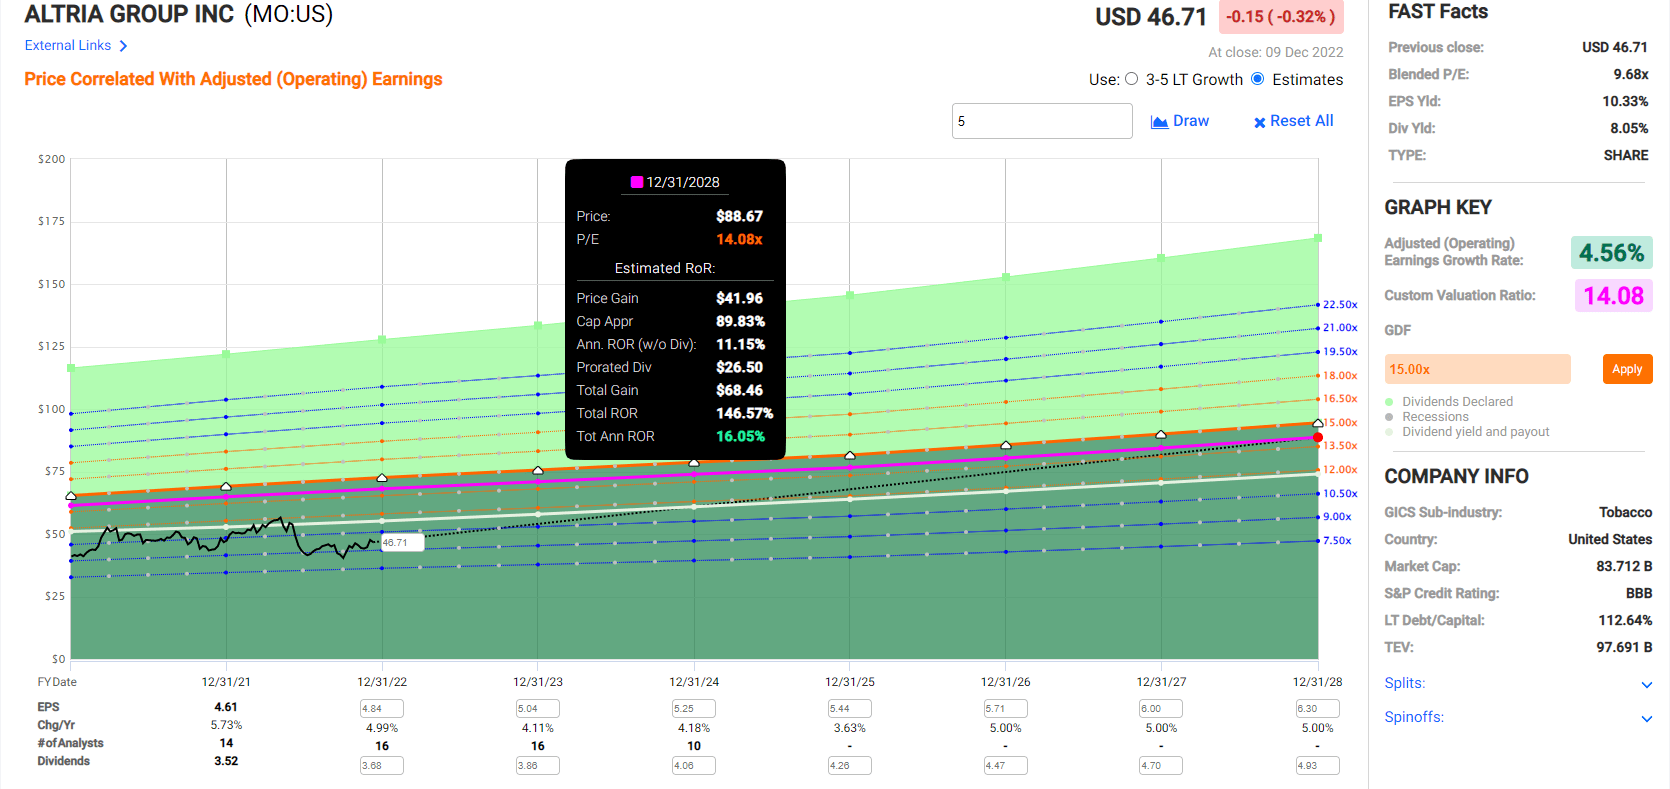
If MO grows as expected and returns to its historical fair value within the next five years:
- 150% total return
- $89 share price
- 16% annual returns
- 3X higher total return than S&P consensus
- 10.5% yield on today’s cost
Altria Investment Decision Score
Dividend Kings Automated Investment Decision Tool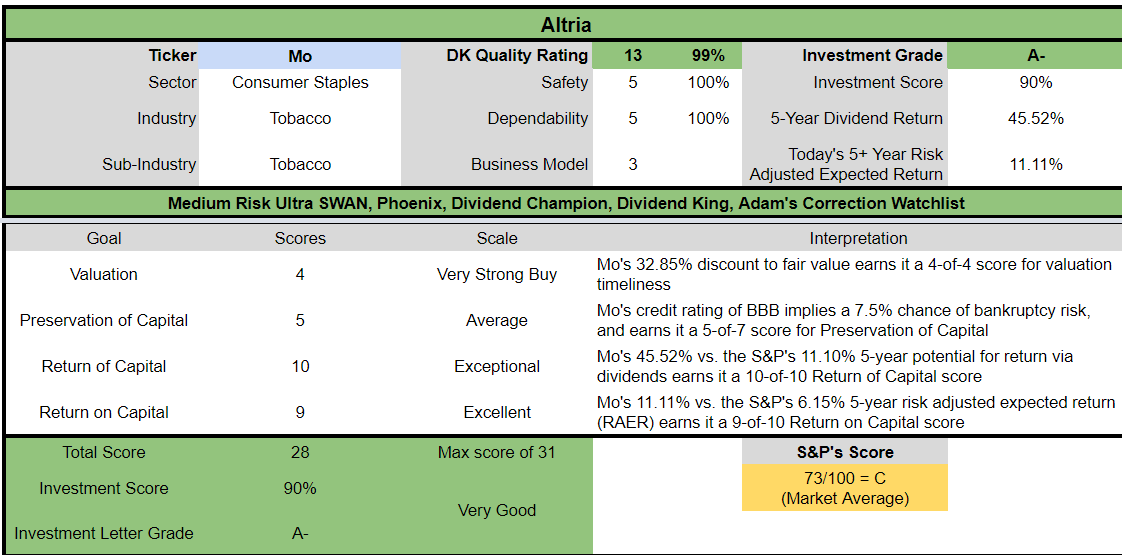
MO is a potentially very good ultra-yield deep value dividend king opportunity for anyone comfortable with its risk profile. Look at how it compares to the S&P 500.
- 33% discount to fair value vs. 3% premium S&P = 36% better valuation
- 8.0% safe yield vs. 1.7% (5X higher and much safer)
- approximately 13.0% long-term annual return potential vs. 10.2% CAGR S&P
- about 2X higher risk-adjusted expected returns
- 4X higher income potential over five years
Reason Two: Slow But Steady Growth Prospects For Years To Come
MO is priced for 0.2% growth; here’s what analysts expect.
| Metric | 2021 consensus growth | 2022 consensus growth | 2023 consensus growth | 2024 consensus growth |
2025 consensus growth |
| Sales | 2% | 1% | 1% | 1% | 1% |
| Dividend | 2% | 7% | 4% (Official) | 5% | 2% (56-year dividend growth streak) |
| EPS | 6% | 5% | 4% | 4% | 3% |
| Operating Cash Flow | 1% | -11% | 20% | 4% | 3% |
| Free Cash Flow | 2% | -13% | 21% | 0% | NA |
| EBITDA | 7% | 7% | 2% | 2% | NA |
| EBIT (operating income) | 7% | 6% | 3% | 1% | NA |
(Source: FAST Graphs, FactSet)
MO is expected to continue to grow slowly but steadily at a rate that supports its historical 14 to 16 P/E multiple.
Long-Term Growth Outlook
FactSet Research Terminal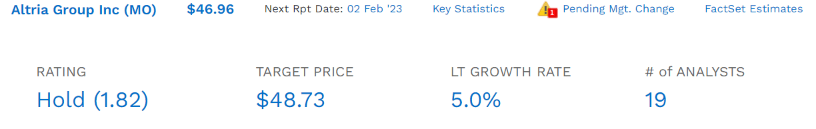
The median long-term growth consensus is 5.0%, with a range of 4% to 8.6%.
How accurate are analyst growth forecasts for MO?
FAST Graphs, FactSet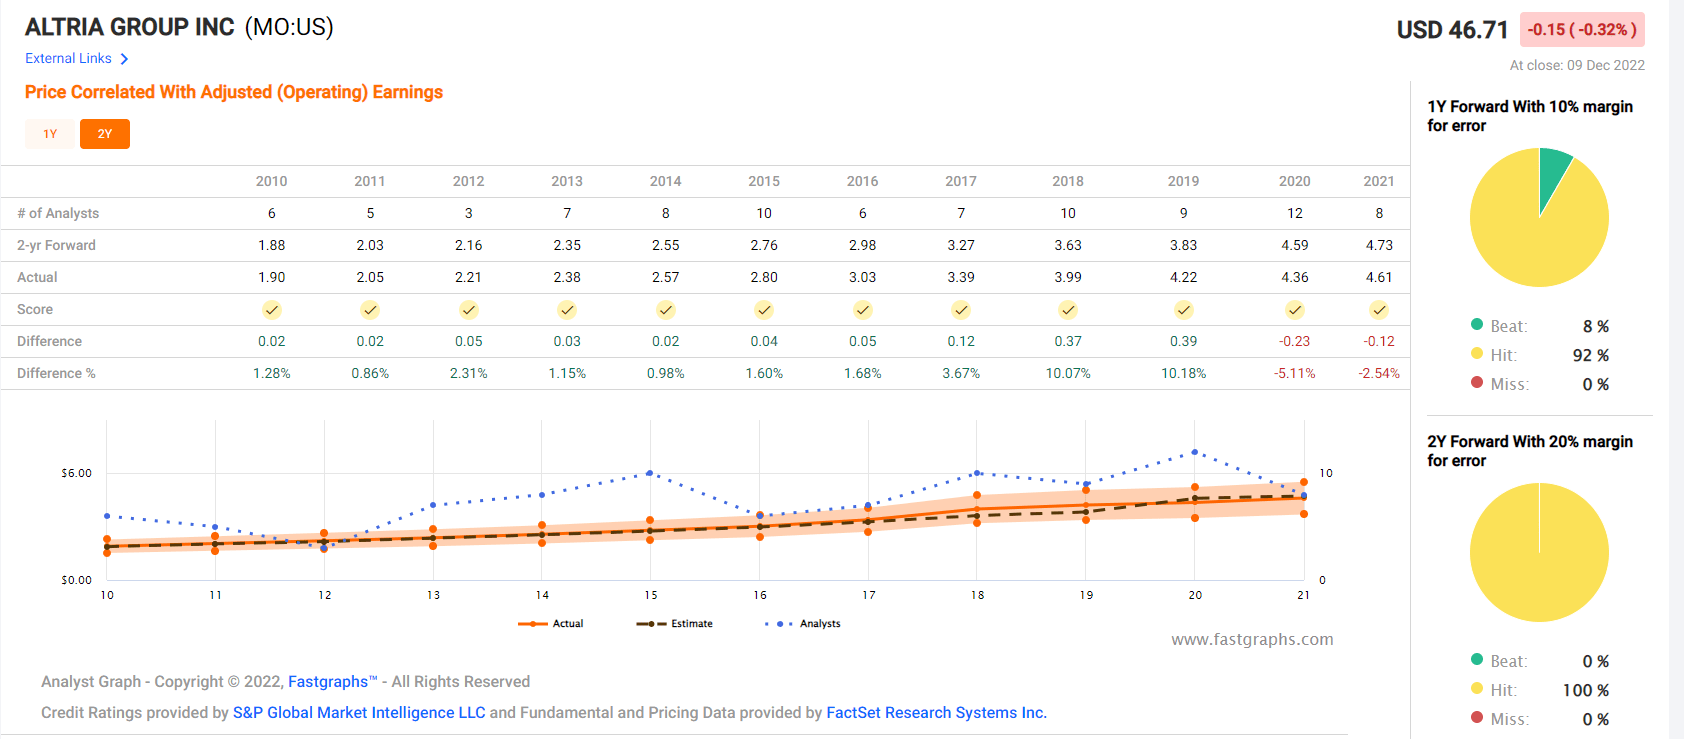
Prior to the pandemic, MO hadn’t missed growth estimates for a decade. The historical margins of error are plus or minus 5%.
- MO almost always grows as expected.
The margin-of-error-adjusted growth consensus range is 4% to 6%.
FAST Graphs, FactSet FAST Graphs, FactSet FAST Graphs, FactSet FAST Graphs, FactSet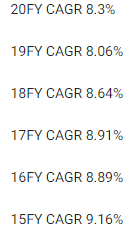
MO’s future growth is expected to be slower than in the past, but just 2.25% annual growth supports a 14 P/E according to the Graham/Dodd fair value formula.
Is 4% to 6% long-term EPS growth reasonable for MO based on its current smoke-free future plans? I, management, analysts, rating agencies, and the bond market all think so.
Consensus Long-Term Return Potential: No PE Expansion Ever
| Investment Strategy | Yield | LT Consensus Growth | LT Consensus Total Return Potential | Long-Term Risk-Adjusted Expected Return | Long-Term Inflation And Risk-Adjusted Expected Returns | Years To Double Your Inflation & Risk-Adjusted Wealth |
10-Year Inflation And Risk-Adjusted Expected Return |
| Altria | 8.0% | 5.0% | 13.0% | 9.1% | 6.7% | 10.7 | 1.91 |
| Safe Midstream | 5.9% | 6.4% | 12.3% | 8.6% | 6.2% | 11.6 | 1.83 |
| REITs | 3.9% | 6.1% | 10.0% | 7.0% | 4.6% | 15.7 | 1.57 |
| Schwab US Dividend Equity ETF | 3.2% | 7.6% | 10.8% | 7.6% | 5.2% | 14.0 | 1.65 |
| 60/40 Retirement Portfolio | 2.1% | 5.1% | 7.2% | 5.0% | 2.6% | 27.3 | 1.30 |
| Dividend Aristocrats | 1.9% | 8.5% | 10.4% | 7.3% | 4.9% | 14.8 | 1.61 |
| S&P 500 | 1.7% | 8.5% | 10.2% | 7.1% | 4.7% | 15.2 | 1.59 |
| Nasdaq | 0.7% | 11.8% | 12.5% | 8.8% | 6.4% | 11.2 | 1.87 |
(Source: DK Research Terminal, FactSet, Morningstar, YCharts)
Assume that MO trades at a 9 P/E forever and an 8% yield forever. Then investors could still make 13% long-term returns.
- Better than any popular investment strategy on Wall Street, including the aristocrats, S&P, SCHD, and even the Nasdaq
Inflation-Adjusted Consensus Total Return Potential: $1,000 Starting Investment
| Time Frame (Years) | 7.8% CAGR Inflation-Adjusted S&P 500 Consensus | 8.0% Inflation-Adjusted Aristocrat Consensus | 10.6% CAGR Inflation-Adjusted Altria Consensus | Difference Between Inflation-Adjusted Altria Consensus And S&P Consensus |
| 5 | $1,453.75 | $1,469.33 | $1,654.91 | $201.17 |
| 10 | $2,113.39 | $2,158.92 | $2,738.74 | $625.36 |
| 15 | $3,072.33 | $3,172.17 | $4,532.39 | $1,460.05 |
| 20 | $4,466.40 | $4,660.96 | $7,500.71 | $3,034.31 |
| 25 | $6,493.02 | $6,848.48 | $12,413.04 | $5,920.02 |
| 30 (retirement time frame) | $9,439.23 | $10,062.66 | $20,542.52 | $11,103.30 |
| 35 | $13,722.27 | $14,785.34 | $33,996.13 | $20,273.86 |
| 40 | $19,948.73 | $21,724.52 | $56,260.69 | $36,311.96 |
| 45 | $29,000.45 | $31,920.45 | $93,106.65 | $64,106.20 |
| 50 | $42,159.37 | $46,901.61 | $154,083.58 | $111,924.20 |
| 55 | $61,289.14 | $68,913.86 | $254,995.19 | $193,706.04 |
| 60 (investing lifetime) | $89,099.03 | $101,257.06 | $421,995.30 | $332,896.27 |
(Source: DK Research Terminal, FactSet)
If MO grows at 5% over time, then it could deliver 21X inflation-adjusted returns over the next 30 years and 422X real returns over an investing lifetime.
| Time Frame (Years) | Ratio Inflation-Adjusted Altria Consensus/Aristocrat Consensus | Ratio Inflation-Adjusted Altria Consensus vs. S&P consensus |
| 5 | 1.13 | 1.14 |
| 10 | 1.27 | 1.30 |
| 15 | 1.43 | 1.48 |
| 20 | 1.61 | 1.68 |
| 25 | 1.81 | 1.91 |
| 30 (retirement time frame) | 2.04 | 2.18 |
| 35 | 2.30 | 2.48 |
| 40 | 2.59 | 2.82 |
| 45 | 2.92 | 3.21 |
| 50 | 3.29 | 3.65 |
| 55 | 3.70 | 4.16 |
| 60 (investing lifetime) | 4.17 | 4.74 |
(Source: DK Research Terminal, FactSet)
That’s potentially 2X the market’s real return potential over the next 30 years and almost 5X more over an investing lifetime.
Reason Three: A Wonderful Company At A Wonderful Price
(Source: FAST Graphs, FactSet) (Source: FAST Graphs, FactSet) (Source: FAST Graphs, FactSet)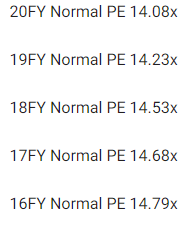
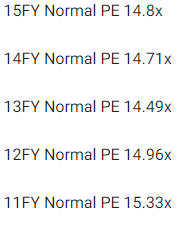

For 20 years, hundreds of millions of income investors have paid between 14 and 16X earnings for MO outside of bear markets and bubbles.
- 91% statistical probability that this approximates intrinsic value
| Metric | Historical Fair Value Multiples (all years) | 2021 | 2022 | 2023 | 2024 | 2025 |
12-Month Forward Fair Value |
| 25-year average yield | 5.45% | $64.59 | $68.99 | $68.99 | $74.50 | $75.60 | |
| Earnings | 14.08 | $64.91 | $68.15 | $70.96 | $74.48 | $76.60 | |
| Average | $64.75 | $68.57 | $69.96 | $74.49 | $76.09 | $69.94 | |
| Current Price | $46.96 | ||||||
|
Discount To Fair Value |
27.47% | 31.51% | 32.88% | 36.96% | 38.29% | 32.85% | |
|
Upside To Fair Value (Including Dividends) |
37.88% | 46.01% | 48.98% | 58.62% | 62.04% | 56.93% | |
| 2022 EPS | 2023 EPS | 2021 Weighted EPS | 2022 Weighted EPS | 12-Month Forward EPS | 12-Month Average Fair Value Forward PE | Current Forward P/E |
Current Forward Cash-Adjusted PE |
| $4.84 | $5.04 | $0.09 | $4.94 | $5.04 | 15.1 | 9.3 | 8.6 |
MO is historically worth about 15X earnings and today trades at 9.3X and 8.6X adjusted for cash.
- the average private equity deal is closing at 11.3X cash-adjusted earnings in 2022.
MO trades at nearly an anti-bubble valuation and is a bargain by private equity standards.
The upside to fair value is 57%.
| Rating | Margin Of Safety For Medium Risk 13/13 Ultra SWAN (Sleep Well At Night) Quality Companies | 2022 Fair Value Price | 2023 Fair Value Price |
12-Month Forward Fair Value |
| Potentially Reasonable Buy | 0% | $68.57 | $69.96 | $69.94 |
| Potentially Good Buy | 5% | $65.14 | $66.46 | $66.44 |
| Potentially Strong Buy | 15% | $58.28 | $59.47 | $59.45 |
| Potentially Very Strong Buy | 25% | $48.85 | $52.47 | $52.45 |
| Potentially Ultra-Value Buy | 35% | $44.57 | $45.48 | $45.46 |
| Currently | $46.96 | 31.51% | 32.88% | 32.85% |
| Upside To Fair Value (Including Dividends) | 54.02% | 56.99% | 56.93% |
MO is a potentially very strong buy and not far from its Ultra Value buy price for anyone comfortable with its risk profile.
Risk Profile: Why Altria Isn’t Right For Everyone
There are no risk-free companies, and no company is right for everyone. You have to be comfortable with the fundamental risk profile.
MO’s Risk Profile Includes:
- regulatory risk (plain packaging laws, menthol ban, nicotine level regulation, reduced risk product taxation)
- smoke-free transition execution
- margin compression risk: RRPs could have lower margins than legacy products
- M&A execution risk (Juul and Cronos investments thus far have not gone well)
- labor retention risk (tightest job market in over 50 years)
One of MO’s biggest risks is that it doesn’t scale up reduced-risk product sales as quickly as its peers.
- PM plans 50% of sales from RRPs by 2025
- analysts expect just 14% from MO
- MO’s smoke-free future plans are very dependent on the success of iQos in the U.S.
MO also has to contend with the fact that the FDA plans to lower nicotine in cigarettes to non-addictive levels and ban menthol.
- BTI thinks this will take until 2027 to be implemented.
In other words, MO needs to accelerate its RRP plans quickly and scale them aggressively if it’s going to achieve the 4% to 6% growth rate analysts currently expect.
How do we quantify, monitor, and track such a complex risk profile? By doing what big institutions do.
Long-Term Risk Management Analysis: How Large Institutions Measure Total Risk Management
DK uses S&P Global’s global long-term risk-management ratings for our risk rating.
- S&P has spent over 20 years perfecting their risk model
- which is based on over 30 major risk categories, over 130 subcategories, and 1,000 individual metrics
- 50% of metrics are industry specific
- this risk rating has been included in every credit rating for decades
The DK risk rating is based on the global percentile of how a company’s risk management compares to 8,000 S&P-rated companies covering 90% of the world’s market cap.
MO scores 45th Percentile On Global Long-Term Risk Management
S&P’s risk management scores factor in things like:
- supply chain management
- crisis management
- cyber-security
- privacy protection
- efficiency
- R&D efficiency
- innovation management
- labor relations
- talent retention
- worker training/skills improvement
- occupational health & safety
- customer relationship management
- business ethics
- climate strategy adaptation
- sustainable agricultural practices
- corporate governance
- brand management
MO’s Long-Term Risk Management Is The 344th Best In The Master List 31st Percentile In The Master List)
| Classification | S&P LT Risk-Management Global Percentile |
Risk-Management Interpretation |
Risk-Management Rating |
| BTI, ILMN, SIEGY, SPGI, WM, CI, CSCO, WMB, SAP, CL | 100 | Exceptional (Top 80 companies in the world) | Very Low Risk |
| Strong ESG Stocks | 86 |
Very Good |
Very Low Risk |
| Foreign Dividend Stocks | 77 |
Good, Bordering On Very Good |
Low Risk |
| Ultra SWANs | 74 | Good | Low Risk |
| Dividend Aristocrats | 67 | Above-Average (Bordering On Good) | Low Risk |
| Low Volatility Stocks | 65 | Above-Average | Low Risk |
| Master List average | 61 | Above-Average | Low Risk |
| Dividend Kings | 60 | Above-Average | Low Risk |
| Hyper-Growth stocks | 59 | Average, Bordering On Above-Average | Medium Risk |
| Dividend Champions | 55 | Average | Medium Risk |
| Altria | 45 | Average | Medium Risk |
| Monthly Dividend Stocks | 41 | Average | Medium Risk |
(Source: DK Research Terminal)
MO’s risk-management consensus is in the bottom 31% of the world’s best blue chips and is similar to:
- Exxon Mobil (XOM): blue-chip aristocrat
- General Dynamics (GD): Super SWAN dividend aristocrat
- Honeywell (HON): Ultra SWAN
- Costco (COST): Ultra SWAN
- Leggett & Platt (LEG): blue-chip dividend king.
The bottom line is that all companies have risks, and MO is average at managing theirs, according to S&P.
How We Monitor MO’s Risk Profile
- 19 analysts
- three credit rating agencies
- 22 experts who collectively know this business better than anyone other than management
- the bond market for real-time fundamental risk assessment
When the facts change, I change my mind. What do you do, sir?” – John Maynard Keynes
There are no sacred cows at iREIT or Dividend Kings. Wherever the fundamentals lead, we always follow. That’s the essence of disciplined financial science, the math behind retiring rich and staying rich in retirement.
Bottom Line: Buy This 8% Yielding Dividend Aristocrat Today Before The Yield Goes To 10.5%
Let me be clear: I’m NOT calling the bottom in MO (I’m not a market-timer).
Ultra SWAN quality does NOT mean “can’t fall hard and fast in a bear market.”
Fundamentals are all that determine safety and quality, and my recommendations.
- over 30+ years, 97% of stock returns are a function of pure fundamentals, not luck
- in the short term; luck is 25X as powerful as fundamentals
- in the long term, fundamentals are 33X as powerful as luck
While I can’t predict the market in the short term, here’s what I can tell you about MO.
- one of the highest quality high-yield dividend kings on earth
- Quality in the top 4% of the world’s best blue-chips
- very safe 8.0% yield (almost 5X the S&P yield growing 4% per year)
- 13.0% annual long-term total consensus better than the S&P, aristocrats, SCHD, and Nasdaq
- 33% historically undervalued, a potentially very strong buy
- 9.3X earnings vs 14X to 16X historical
- 8.6X cash-adjusted earnings priced for 0.2% growth vs. 5% consensus
- 150% consensus return potential over the next five years, 16% CAGR, 3X better than the S&P 500
- 2X the risk-adjusted expected returns of the S&P 500 over the next five years
- 4X the income potential of the S&P over the next five years
If you’re looking for the safest 8% yield on Wall Street, consider buying some Altria today.
If you’re looking for as close to a perfect ultra-yield dividend aristocrat for 2023, defensive low volatility MO is a great choice.
If you’re worried about a potentially terrible first half to 2023, MO is likely to hold up a lot better.
Most importantly, if you’re looking for a glorious rich retirement funding 10.5% yield, buying MO today is how you can get it in 2028.
MO is the best-performing stock in history. And while it won’t provide 20% annual returns long-term, its 13% return potential, potentially for decades to come, might be just what you need to retire in safety and splendor.
Be the first to comment