

happyphoton/iStock via Getty Images
Investment thesis
Alibaba’s stock (NYSE:BABA) has been massively sold off losing over 82% since its All-Time-High [ATH], leading the decline in its most relevant industries. The Chinese economy has been affected by draconian measures following the COVID-pandemic and restrictive policies, a framework that has discouraged many investors from risking significant exposures in Chinese stocks. While the countries’ consumer confidence is seemingly flattening, and consumer behavior may offer great opportunities for companies such as Alibaba, it will likely need some time before a positive market environment will again be established. Technically the stock is still in its long-term downtrend, and despite a tradeable framework that could seemingly slowly build up, there is no urgency to rush and buy BABA before the stock does not confirm important price levels, by reporting significant relative strength in its still poorly performing industries.
A quick look at the big picture
On a global scale, the pandemic and the subsequent measures taken by the relevant governments had different impacts on international economies and the global stock markets. The S&P 500 (SP500) could largely outperform some of the most important international references, while stocks in Europe have reported a less euphoric recovery from the pandemic low, as reported by the DAX Germany Index (DAX:IND), and have also been more defensive in the latest sell-off, as shown by the Swiss SMI Index (SMI:IND). In Asia the NIKKEI 225 Index (NKY:IND) could perform quite well when compared to the majority of the analyzed references, while the Hang Seng Index (HSI) is reportedly the worst performer, as stocks in China have been particularly harshly sold off since the pandemic, as draconian measures and restrictive policies have massively impacted most of the sectors, also leading international investors to drastically reduce their exposure to the country’s equity market.
Author, using SeekingAlpha.com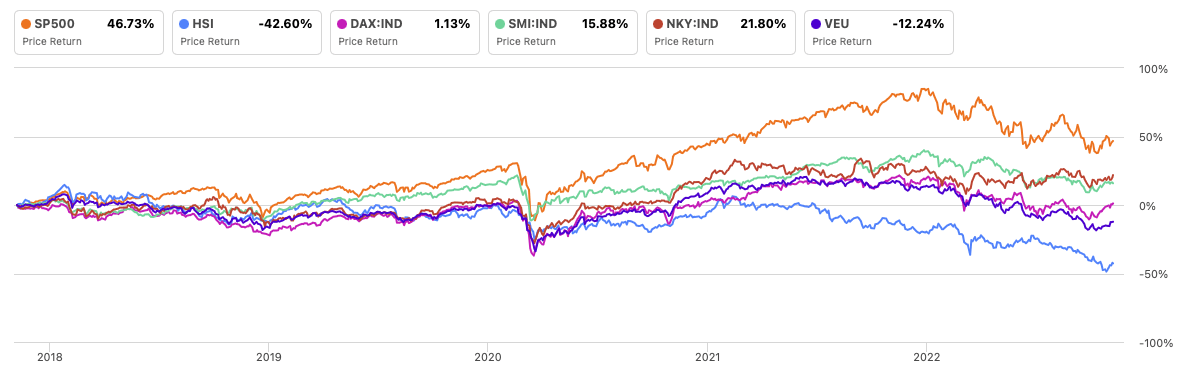
The ongoing and even incrementing geopolitical tensions and worsening economic conflict between China and the US have negatively impacted the investor’s trust, who are now quite diffident toward investing in Chinese stocks, despite some industries may offer interesting opportunities. Stocks in the consumer discretionary sector could lead the recent rally at the end of Q2, by largely outperforming all other sector references.
Global X China Sector Report Q2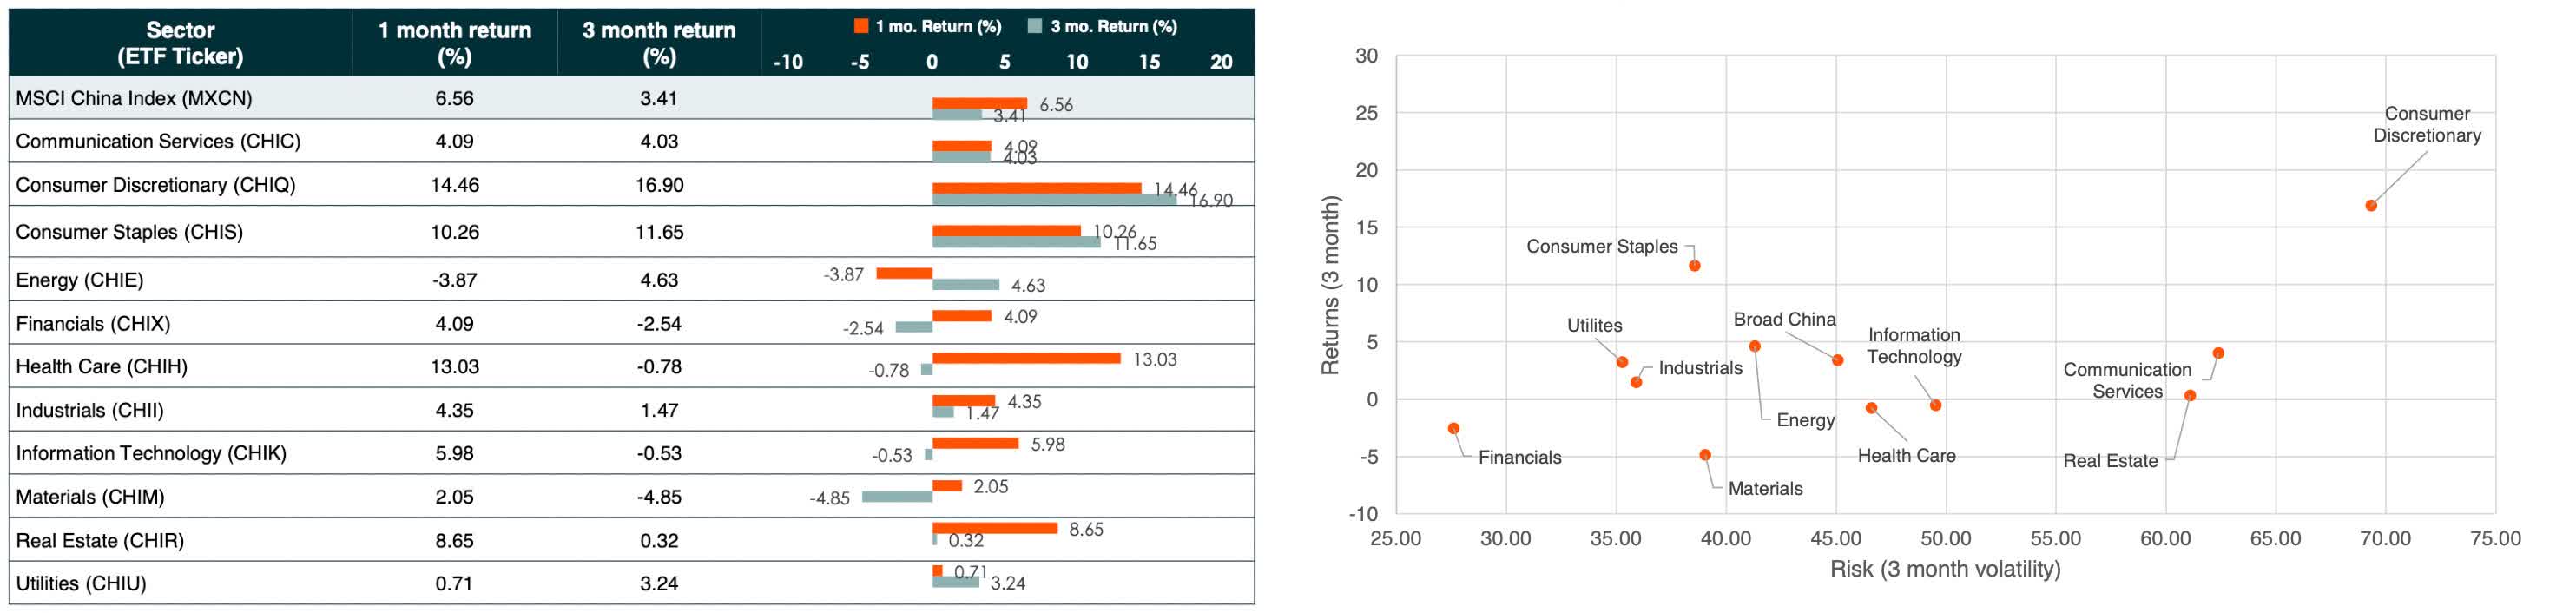
Chinese consumers have become much more cautious, but it seems that consumer confidence, despite the index dropping from a reading of 121.2 to 87.2 YoY at the end of Q3 2022, could have bottomed, as the index is hovering around 87 since April 2022. Additionally, due to the pandemic, the already widespread e-commerce shopping behavior has been pushed by live streaming sessions and group purchases, as online shopping has become an even more important driver in terms of consumer spending. In the first three quarters of 2022, Chinese private consumption contributed 41.3% to economic growth, driving the GDP growth by 1.2%. In the third quarter, China’s consumption expenditure accelerated to 52.4%, driving the GDP growth by 2.1%, as the country adjusted its mass lockdowns to more targeted restrictions.
E-commerce has further demonstrated its role in driving consumption growth.
Dong Lihua, director of the Trade and Economic Department at the NBS
Looking at more specific industry groups, the Global X China Consumer ETF (CHIQ) marked its ATH on February 16, 2021, and has since massively corrected, losing over 69% until bottoming on October 24, 2022. It has since reverted and is heading toward its EMA50 on a daily scale, while it is still quite extended under its most important moving averages on a weekly time frame. While the industry reference is still in its long-term downtrend, it is seemingly building up some relative strength when compared to the broader iShares MSCI China ETF (MCHI).
Author, using TradingView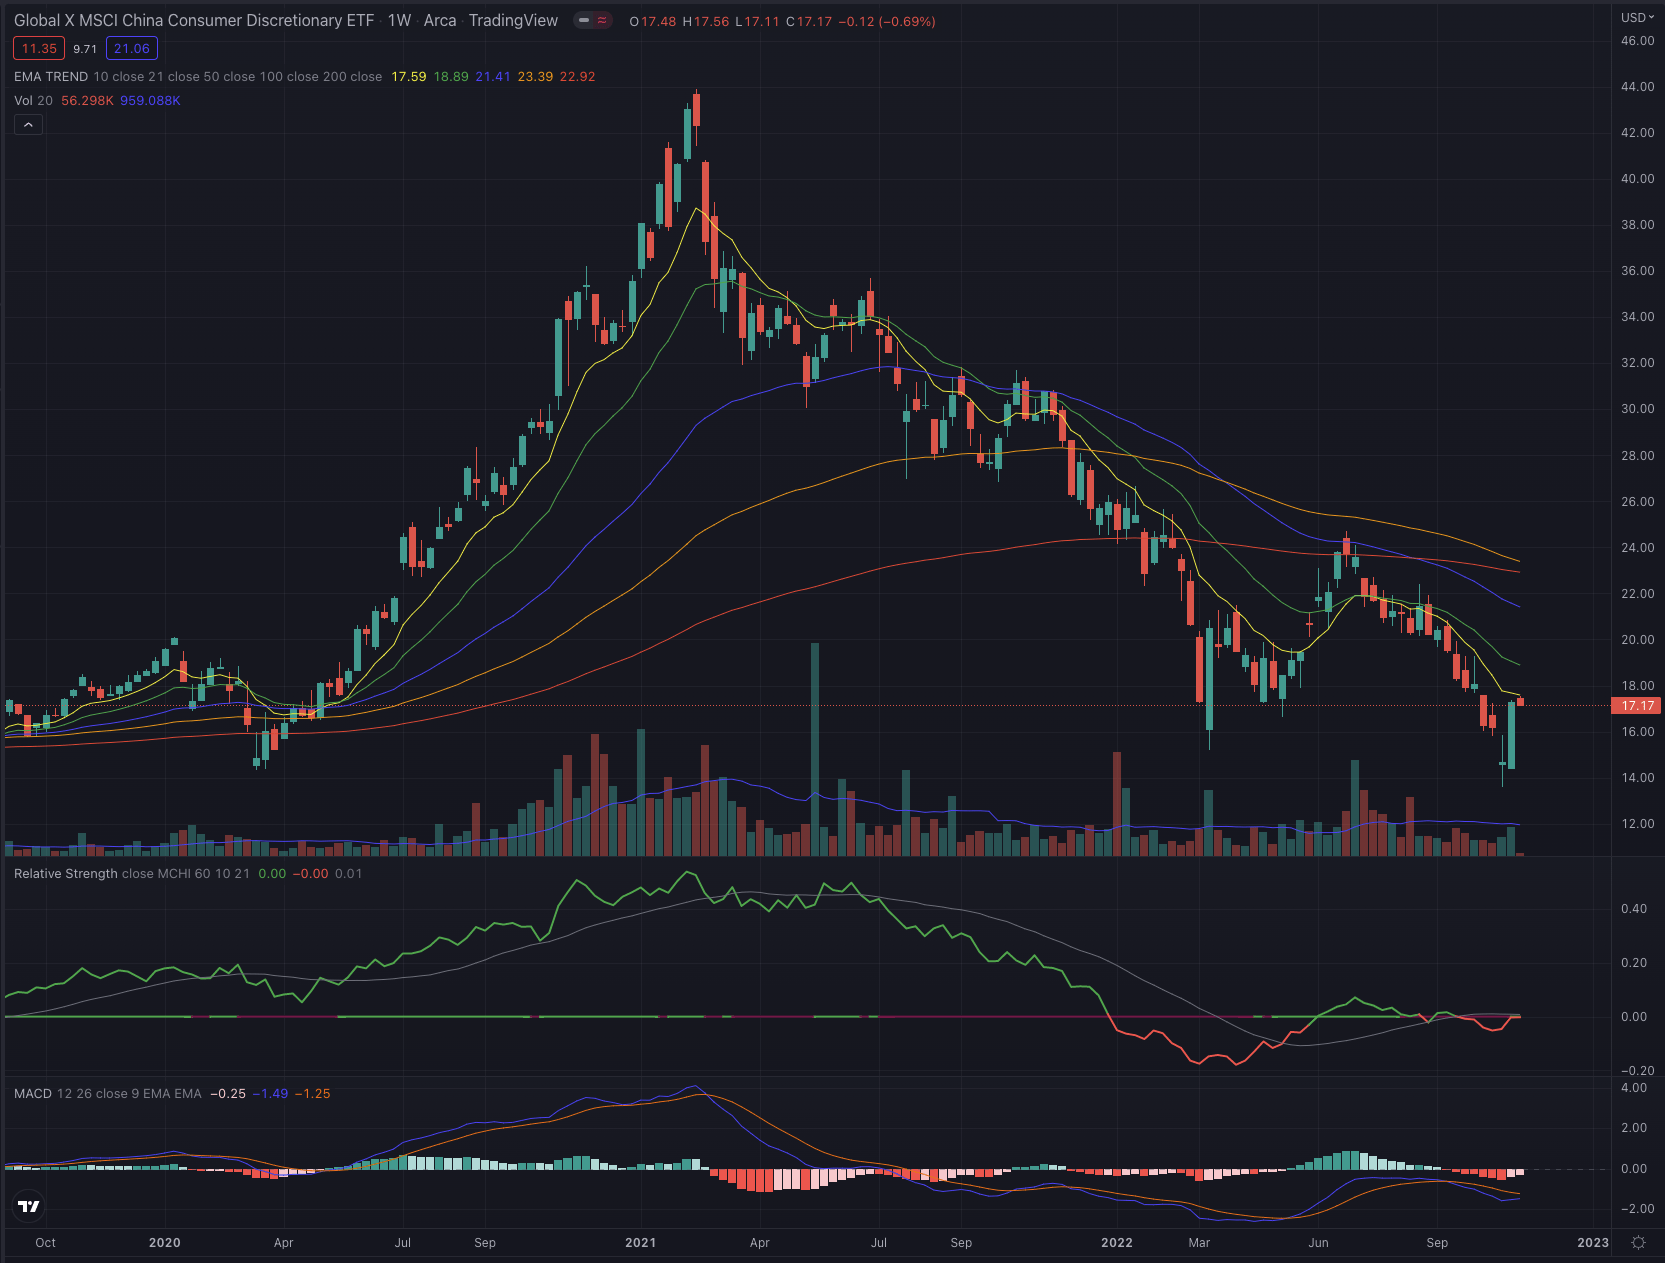
The KraneShares CSI China Internet ETF (KWEB) has a similar chart as it marked its ATH on February 17, 2021, and has been successively sold off, while the more tech-heavy industry reference has been losing, even more, reporting a huge drop of over 83%, until bottoming on October 24, 2022. The industry reference hasn’t been so negatively extended since its implementation in Juli 2013, and despite giving some signs of resilience, when compared to the broader iShares MSCI China ETF (MCHI), couldn’t still build up enough relative strength in order to reverse its negative momentum.
Author, using TradingView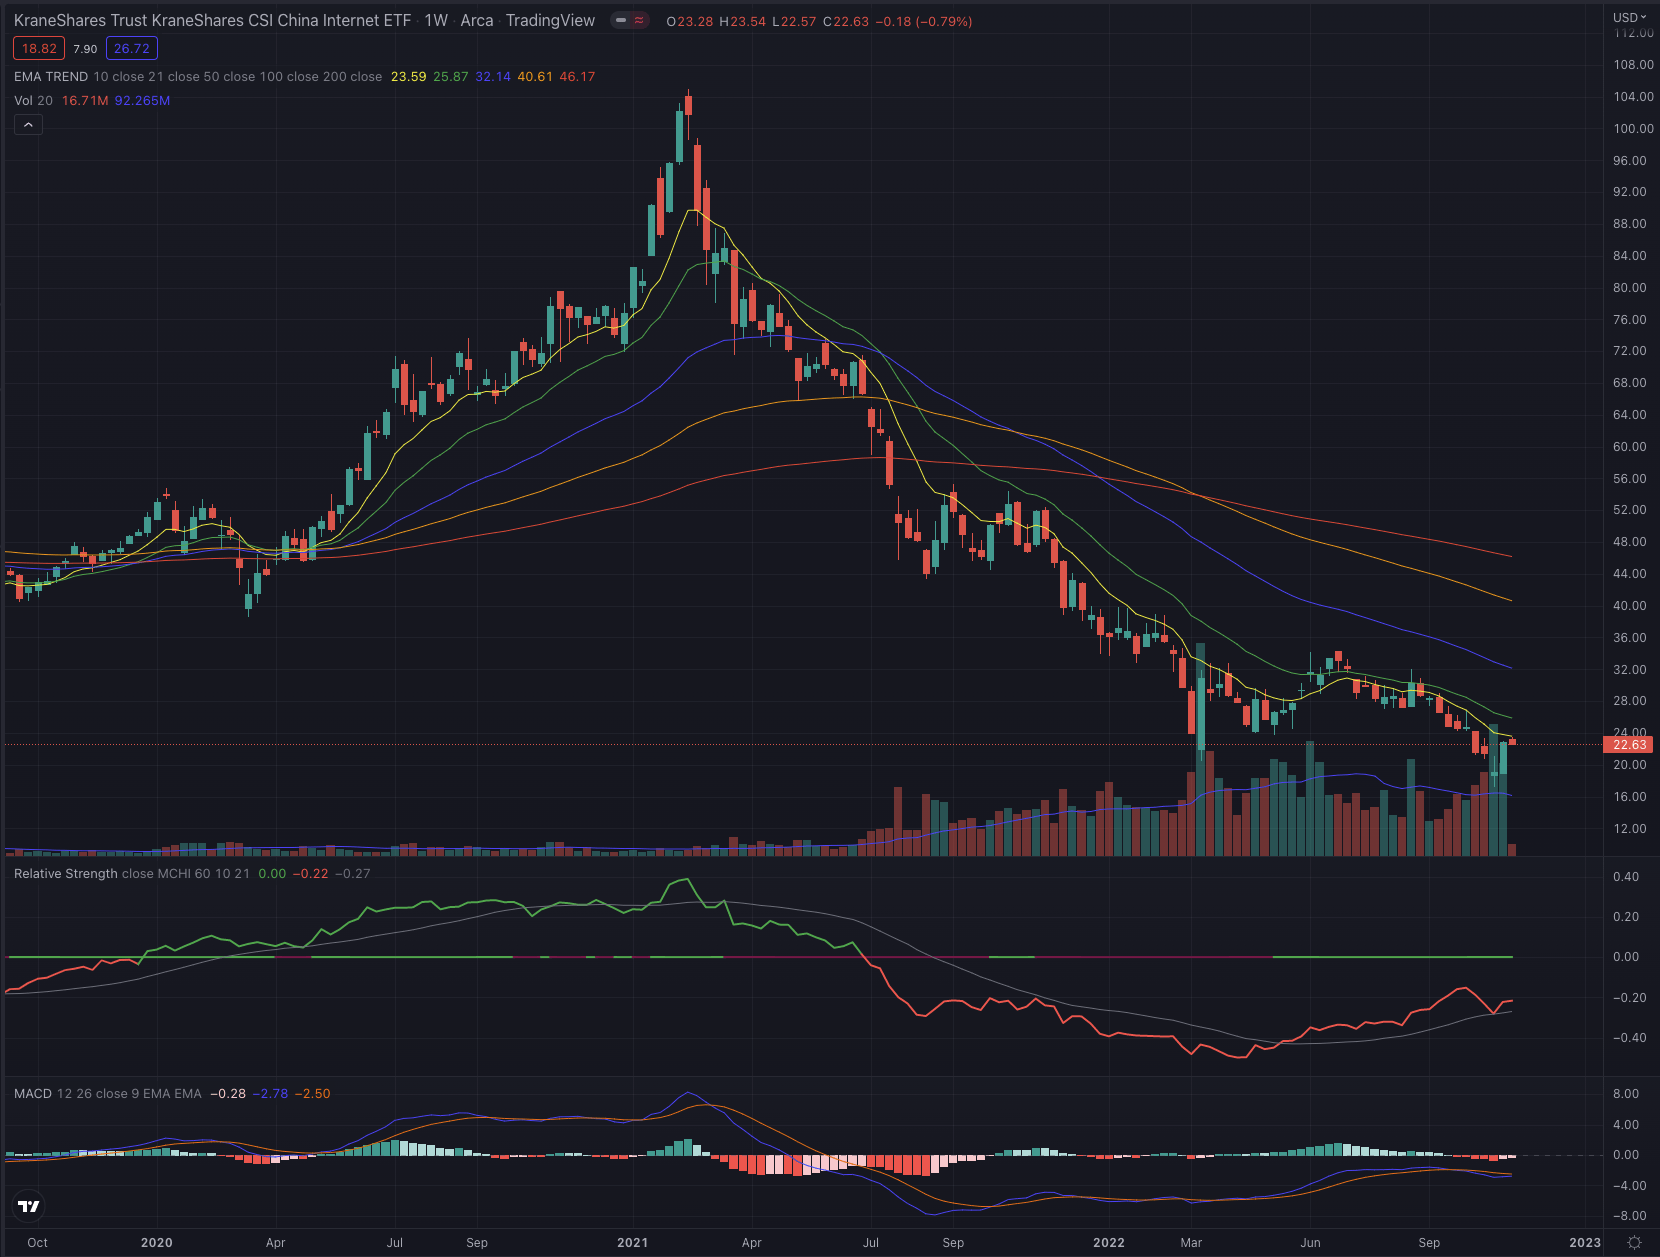
By analyzing the historical stock chart, we notice that BABA had a mixed performance in the past years through 2020, where the stock began to significantly outperform some of its references, but shortly after peaking, the decline overshadowed the past performance, resulting in an overall loss of 62.5% over the past 5 years. Competitor JD.com (JD), despite being a significant underperformer in the past few years, could profit from a much more significant rally out of the covid low, resulting in a 13.15% performance. Other than analyzing the single stock’s performance, It’s interesting to compare the previously discussed industry references to the S&P 500 (SP500), as the latter, despite the recent market turmoil and showing some relative weakness during the past few years, is by far the best performer over the analyzed time.
Author, using SeekingAlpha.com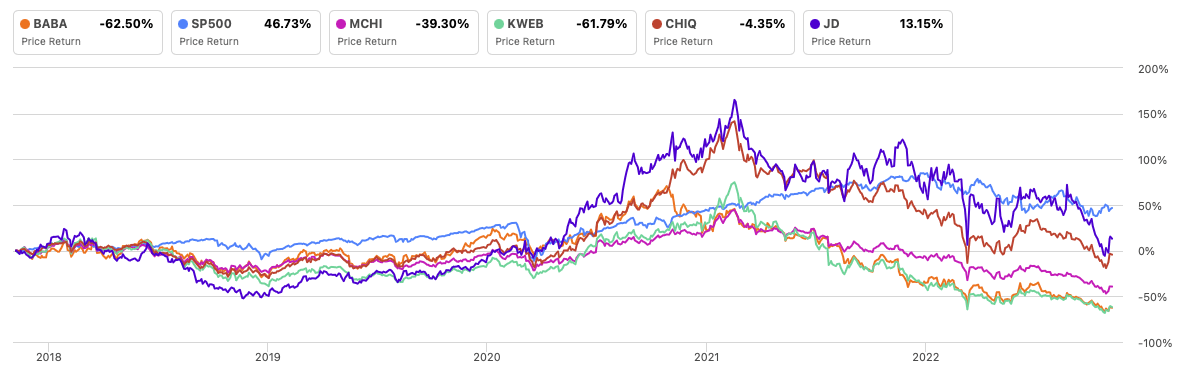
Where are we now?
On BABA’s weekly chart the sell-off is impressive to observe, as the stock’s massive drop of 82% projects its valuation back to 2016, resetting almost 7 years of investor value creation. Although the stock has been able to report significant relative strength in the past, it is still in its long-term downtrend, while its negative extension has often led many investors to hope for a steep and sudden reversal, despite it still not happening, and the bottom fishing went on for quite a long time.
Author, using TradingView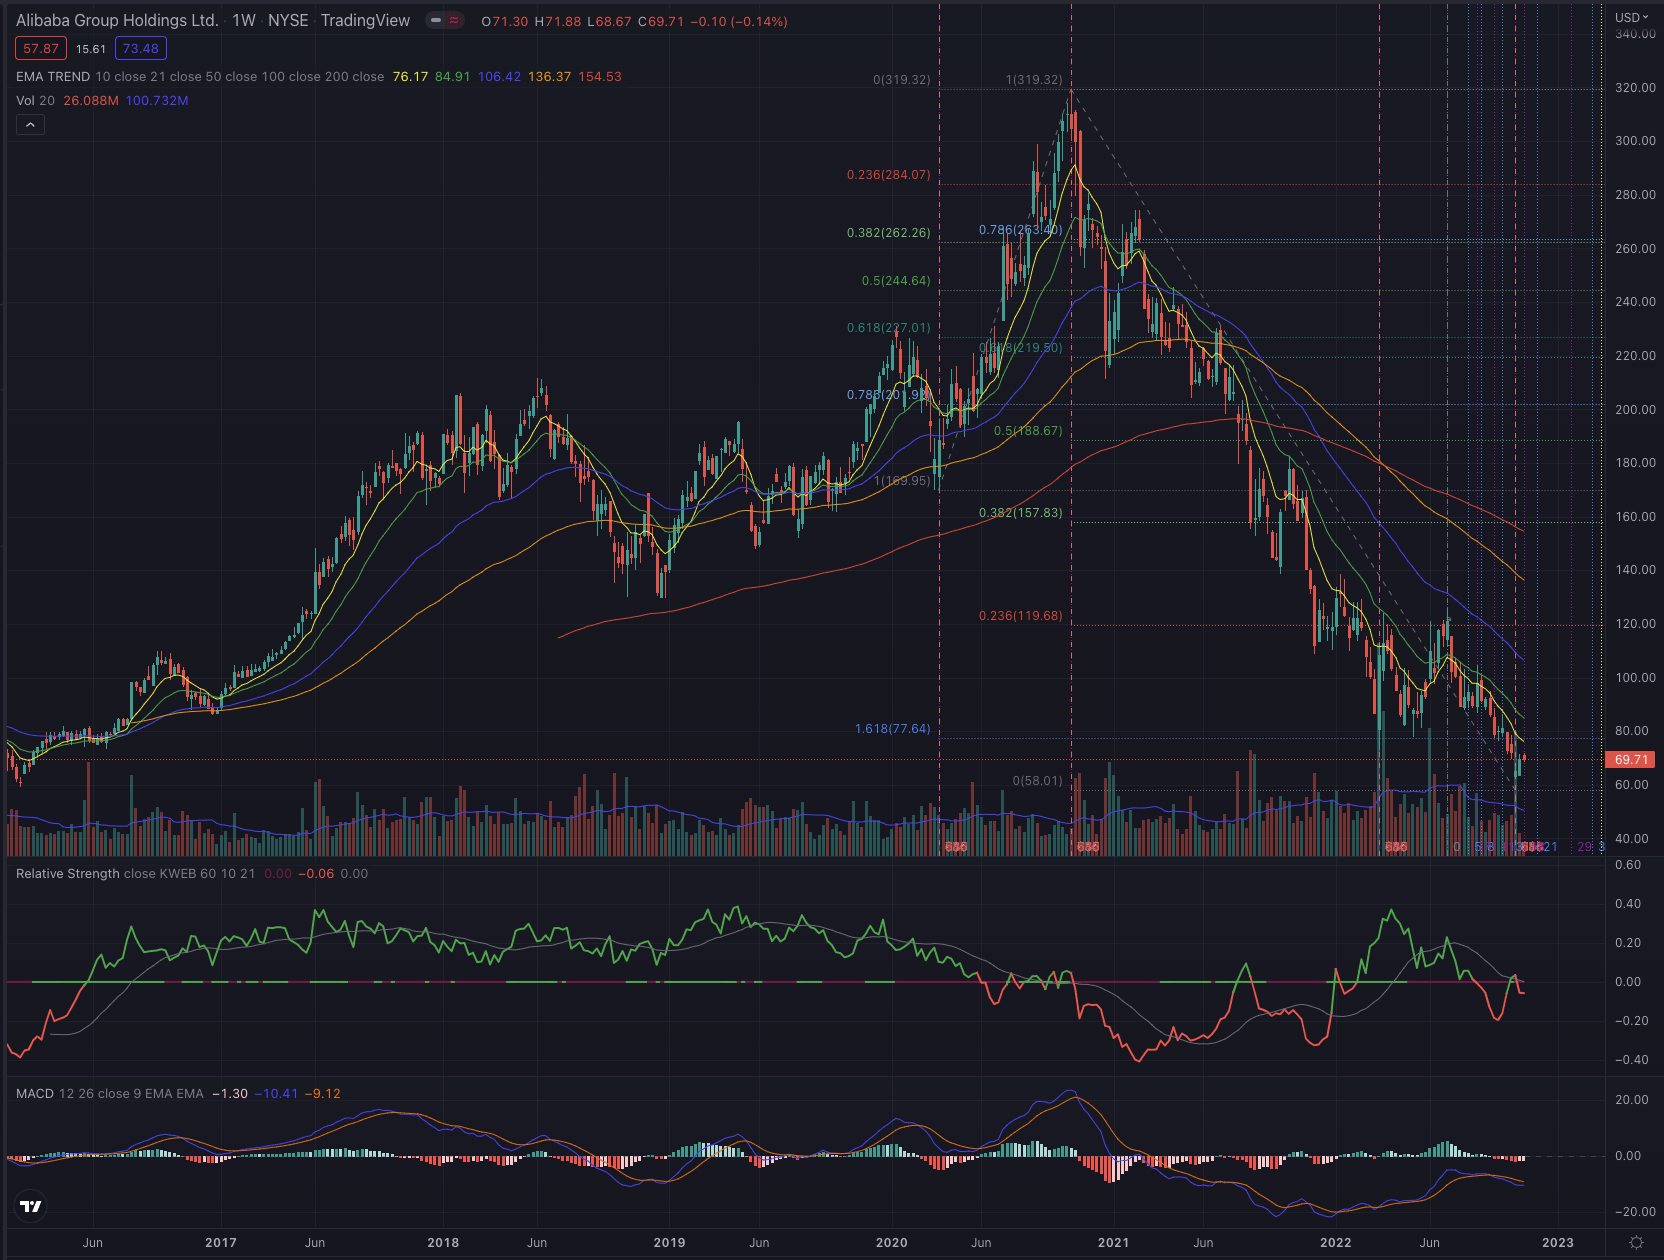
The problem with such a steep decline is the massive overhead resistance that the stock has to overcome before being set for a sustained and persistent rally. The stock has a relatively low short interest of 3.14% and a short ratio of under 3 days, which means that there is not much pressure for short positions to be covered. Other than this, it’s not uncommon that such a decline can lead buy-and-hold investors to their limit in terms of patience, as they could tend to sell as soon the stock recovers to their break-even price or any price that psychologically seems a justified trade-off in exchange of getting rid of the painful sensation of a massive loss.
As a general rule, I begin to consider stocks in a late stage 1 and preferably when breaking out into stage 2. While BABA isn’t for the moment qualified as such, I sometimes observe stocks in their stage 4, especially when, like in this case, certain elements attract my attention.
The stock has reached the 161.8% Fibonacci extension, a level that seemed quite unrealistic when I first traced the rally that led the stock out of the pandemic to its ATH, yet it is the most important extension I consider when projecting a possible price target. In this case, it will not be possible that the stock reaches its next most important extension at 261.8%, as this would project the stock into negative territory. The declining selling volume in the past few weeks and weeks of above the average buy-side volume is also a sign I consider as rather positive and could hint at a slow-down in the negative momentum, or even at a possible upcoming reversal, as the interest in the stock may switch side. The stock also managed to build up some relative strength in the past month, when compared to the KraneShares CSI China Internet ETF (KWEB), while it is only slowly recovering when compared to other references such as the Hang Seng Index (HSI).
What is coming next?
I don’t expect the stock to reverse in a steep upward trend without having formed a sound base, a process that could take some time to form, as the stock is technically not yet giving the right signs and fundamentally the economic environment in China would need at least to offer more clarity to investors, where the country’s relevant industries are heading in terms of regulations and economic development.
The stock is still captured in its long-term downtrend, and despite the upcoming quarterly results could offer some catalyst, which I expect to be rather positive, the overhead resistance is massive and would need a significant increase in institutional buy-side volume, in order to help the stock to overcome at least the EMA50 now tracing along the downward trend channel, and further resistances, which I qualify around $77.60 and further at $86.
Author, using TradingView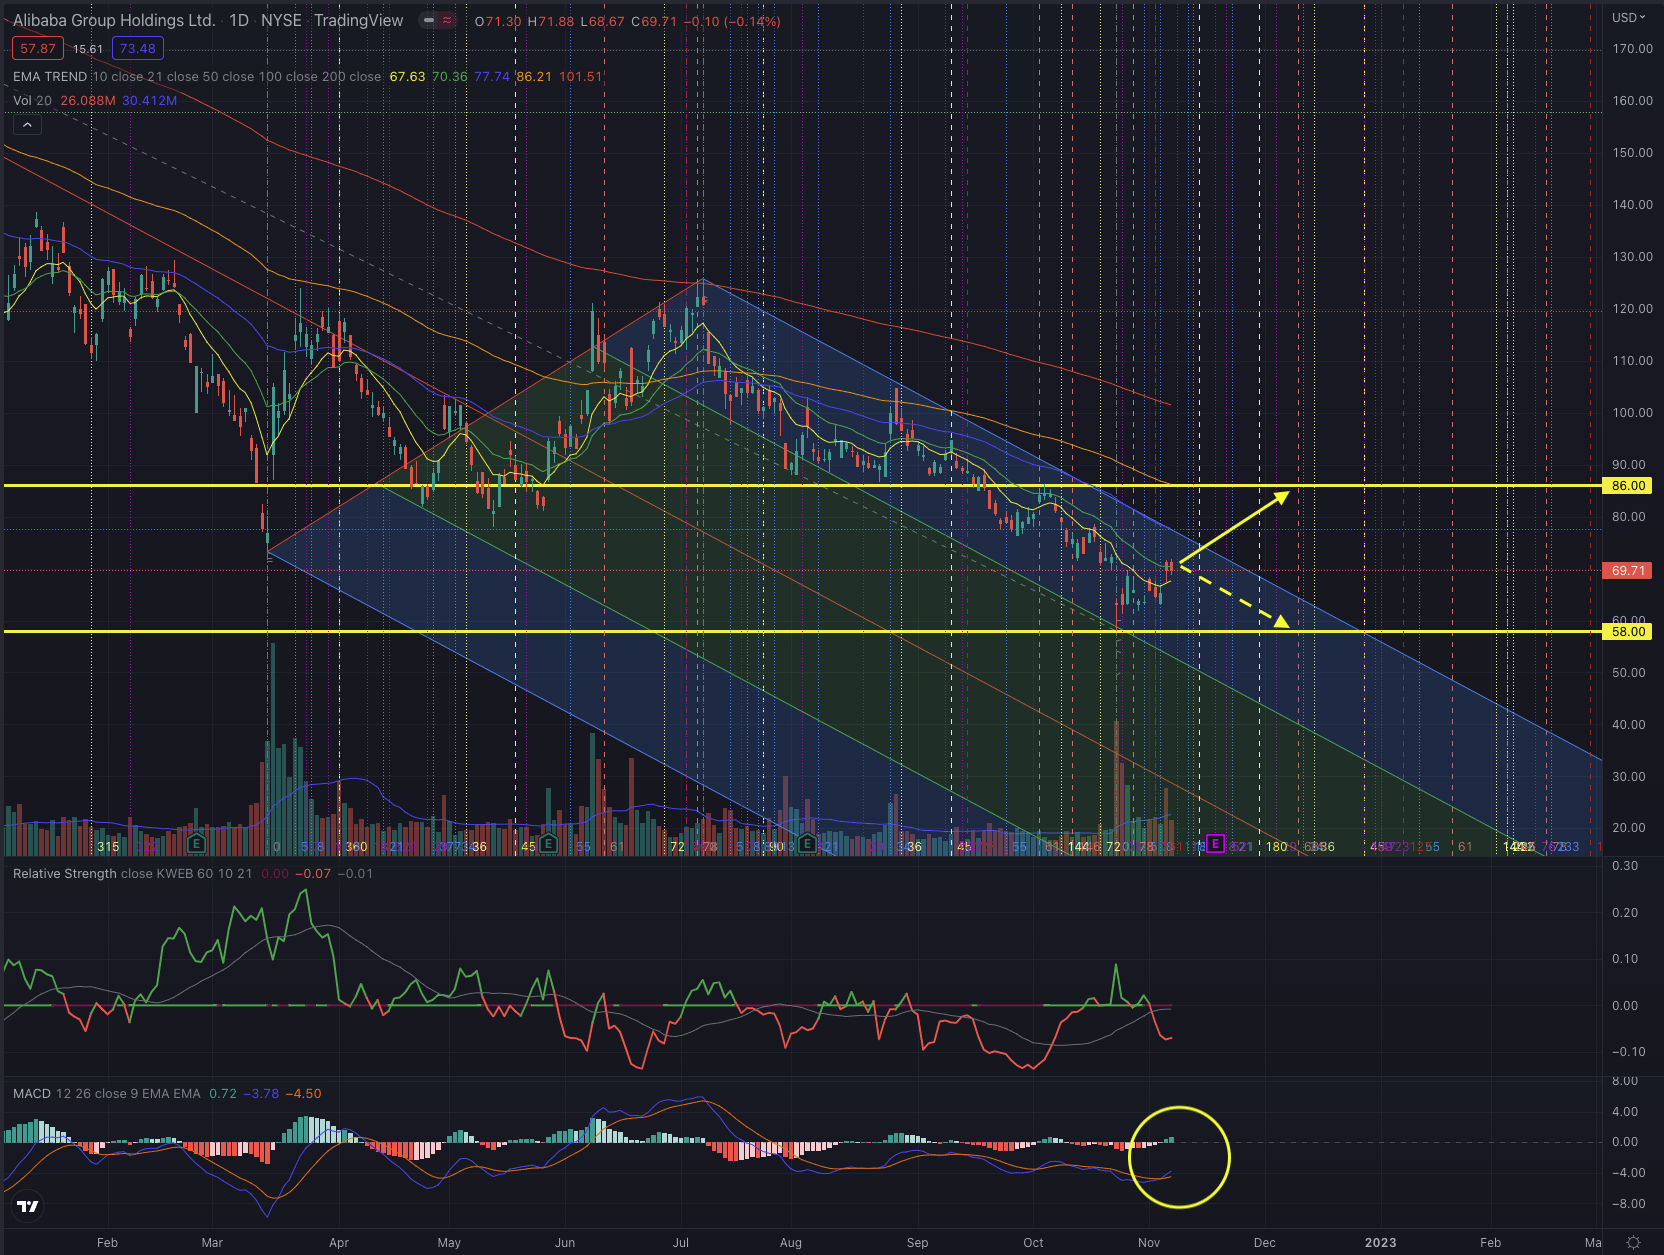
I would be very careful if the stock continues in its trending channel and approaches its most recent low at $58. While it would certainly be possible that the stock would retest the bottom in order to form a sound base, a drop under that price level on higher volume would lead me to cut my exposure as the risk of a further significant price depression would, at that point, be very likely.
When considering technical analysis, it’s important to look at multiple time frames to get an overview of possible situations that can form in specific intervals. Investors should closely observe the price action and how the stock behaves at these crucial support levels, and how an eventual attempt to overcome its resistance is confirmed or rejected, by particularly observing the trading volume in both directions. The stock has attempted several times to overcome its EMA50 on its daily chart during its long-term downtrend and has been rejected mostly with a significant increase in volume, while the EMA200 has been reached only once, and the stock got immediately rejected.
Short-term investors with higher risk tolerance who considered the recent reversal attempt also shown in BABA’s MACD, could set their first target toward the EMA50, as the stock could move sideways in a larger price span, before trying to set up a new uptrend, which would offer interesting trading opportunities, if the downward momentum reverses. I would certainly actively manage the downside risk by setting up appropriate stop-loss orders, under the EMA21 or the EMA50 if the stock manages to overcome those price levels consistently.
Long-term-oriented investors who acknowledge the recent price levels as an opportunity could ponder sizing their long positions accordingly, by considering a first position at the actual levels, or waiting after the upcoming quarterly results, and by gradually increasing their exposure if the stock manages to overcome its EMA50 first and most importantly its EMA200. I would not consider any major position until the stock has confirmed a significant breakout over its long-term moving average.
The bottom line
Technical analysis is not an absolute instrument, but a way to increase investors’ success probabilities and a tool allowing them to be oriented in whatever security. One would not drive towards an unknown destination without consulting a map or using a GPS. I believe the same should be true when making investment decisions. I consider techniques based on the Elliott Wave Theory, as well as likely outcomes based on Fibonacci’s principles, by confirming the likelihood of an outcome contingent on time-based probabilities. The purpose of my technical analysis is to confirm or reject an entry point in the stock, by observing its sector and industry, and most of all its price action. I then analyze the situation of that stock and calculate likely outcomes based on the mentioned theories.
Alibaba has suffered from a massive sell-off and despite some valuations, models may have screamed for an undervaluation, the stock has been ignoring them and gave up 82% of its value since its ATH. In this type of situation, the stock’s overhead resistance to overcome is huge, and before a rally could possibly form, the stock would have to confirm its price level by most likely testing its support and forming a sound base. As this usually doesn’t happen overnight, and under the discussed circumstances, BABA is still not offering an actionable setup without bearing a high risk of further losses, I consider this stock as a hold position, as I would not rush into any new long position, while actual shareholders could, at this point, wait for better signals before taking any decision
Be the first to comment