

Thesis
Alamos Gold (AGI) has reported a strong Q1 2020 in terms of revenues and earnings, and the share price has already incorporated these results. AGI currently faces some temporary operational hurdles posted by the global outbreak of COVID-19 which implies that AGI’s price performance could suffer (at least during Q2 2020). However, AGI’s low-cost production together with future growth opportunities in Turkey enables it to take advantage of a continued momentum in gold rally (if this rally continues).
In this article, we will analyze the company’s medium-to-long term investment horizon and consider a slightly corrected price range within which the stock becomes a bargain buy. Since AGI’s long-term investment picture is also based on promising future projects including those in Turkey (such as Kirazli), I have also discussed the company’s risk profile in its mining jurisdictions. The analysis reveals that investors may consider taking some profit at these record high prices, and wait for a possible pullback (within the $7.50 range) to initiate a fresh long position in the company.
Figure-1 (Source: Steelguru.com)
Q1 2020 Financial Performance
Let’s first have a quick look at AGI’s key financial performance metrics for Q1 2020 (Figure-2). We can see a healthy y/y increase in revenues, OCFs (read: Operating Cash flows), adjusted Non-GAAP net earnings, CAPEX (sustaining/growth/exploration), and cash balances. In numbers, top line revenues and bottom line ‘Adjusted (non-GAAP) EPS’ saw a ~13% and 167% y/y increase, respectively.
[Author’s Note: For analysis, I prefer ‘Adjusted net earnings (a non-GAAP measure)’ over ‘Net earnings/losses’ because the earlier metric excludes FOREX gains/losses, as well as certain other items of non-recurring nature, and represents a more realistic picture of a gold miner’s profitability.]
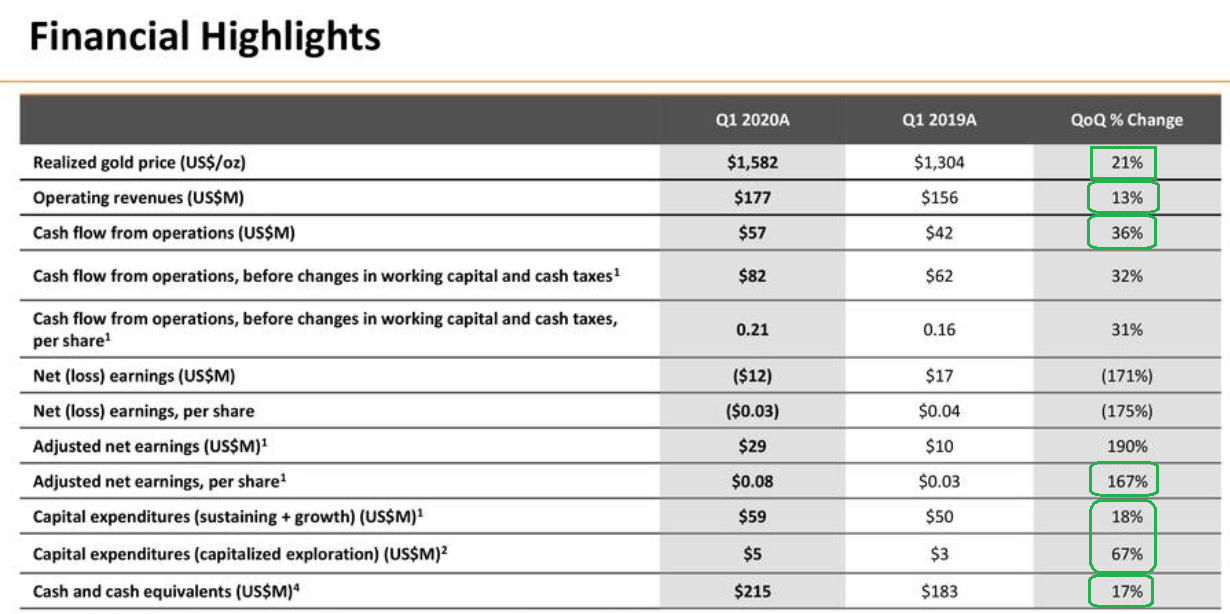 Figure-2 (Source: April Presentation)
Gold prices and AGI
In my view, the substantial hike in gold prices was the most notable contributor to those positive financial results. For high-cost gold miners (miners producing at or above All-In-Sustaining-Cost (or AISC) of $1,200/oz) a sustained hike in gold prices makes mining activities fruitful. On the flip side, average-cost (AISC b/w $1,000-1,200/oz) or low-cost (AISC <$1,000/oz) gold miners find their operations becoming much more lucrative subject to outstanding share count and planned CAPEX/debt obligations.
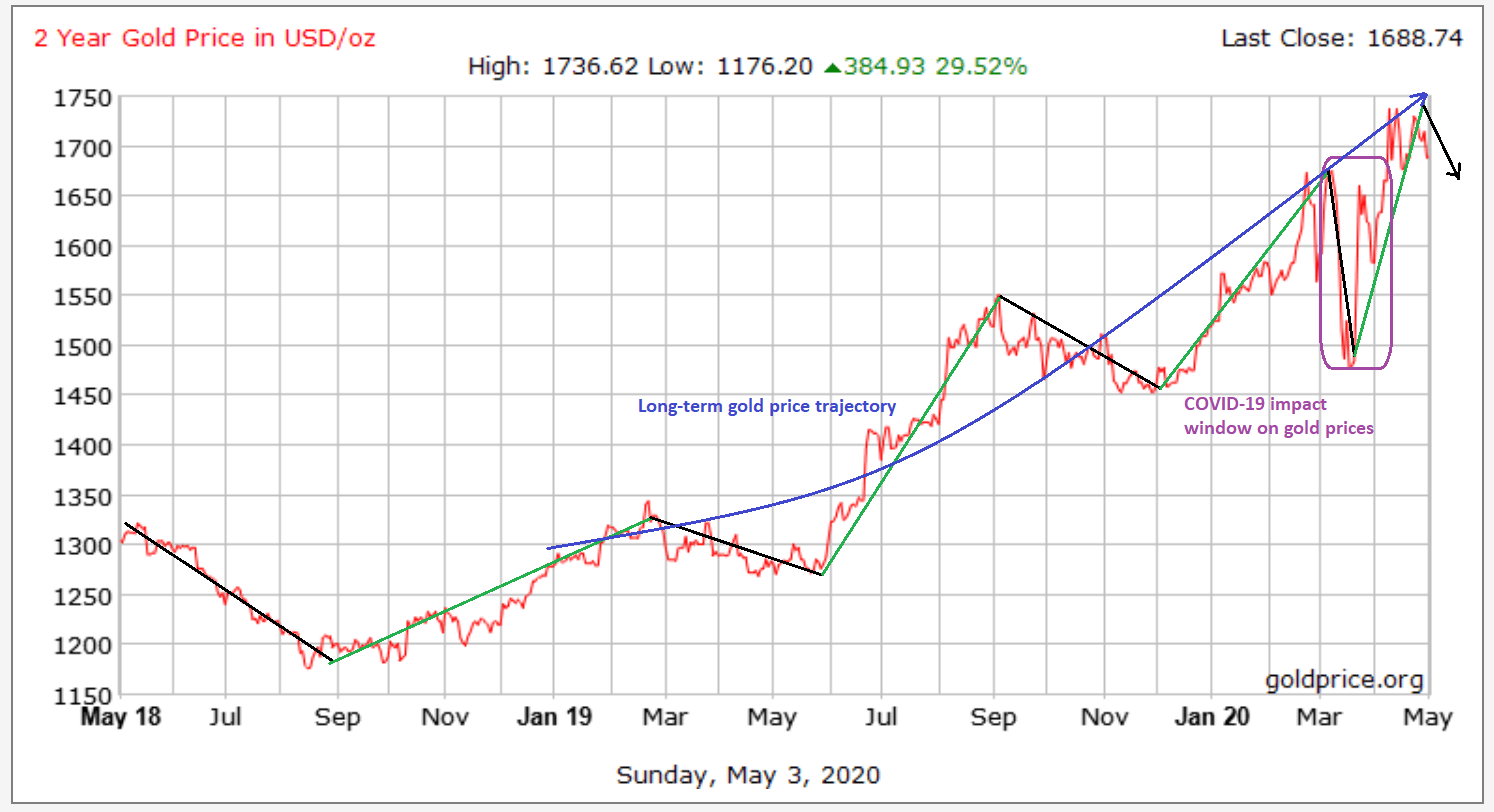 Figure-3 (Source: GoldPrice)
Note that average realized gold prices during Q1 2020 were significantly higher than the SPLY (read: Same Period Last Year) and gold prices have generally been on an upward trajectory since last year (Figure-3). Gold’s current prices (near the $1,700/oz mark) are gliding closer to its 2011 highs and the PM could break the $1,800/oz mark in the near term (1 year or so). For AGI and other average/low-cost gold miners, this indicates a large potential upside (note that analysts have set a ~$9.2 price target for AGI). During the recent volatility in gold prices (as denoted by the label ‘COVID-19 impact window on gold prices’ in Figure-3), AGI’s price performance (Figure-4) has largely outperformed the shiny metal itself, and also surpassed the price returns of its 3 benchmark ETFs (Figure-5) namely VanEck Vectors Gold Miners ETF (GDX), VanEck Vectors Junior Gold Miners ETF (GDXJ), and Global X Silver Miners ETF (SIL).
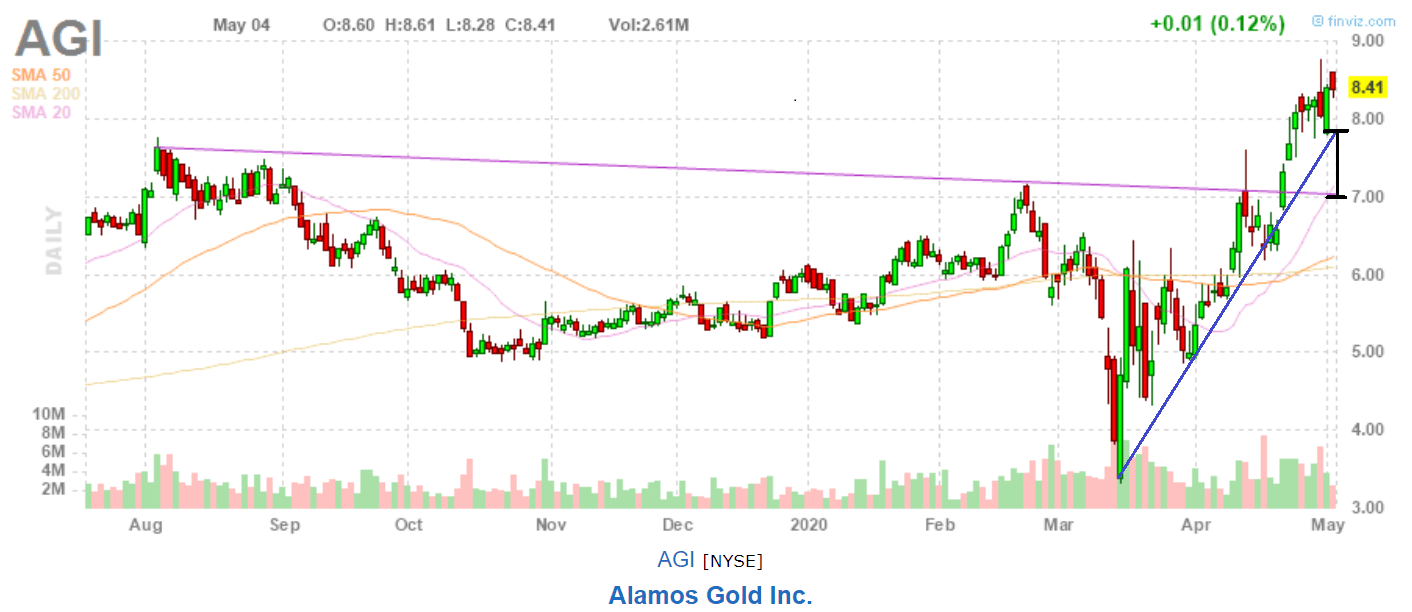 Figure-4 (Source: Finviz)
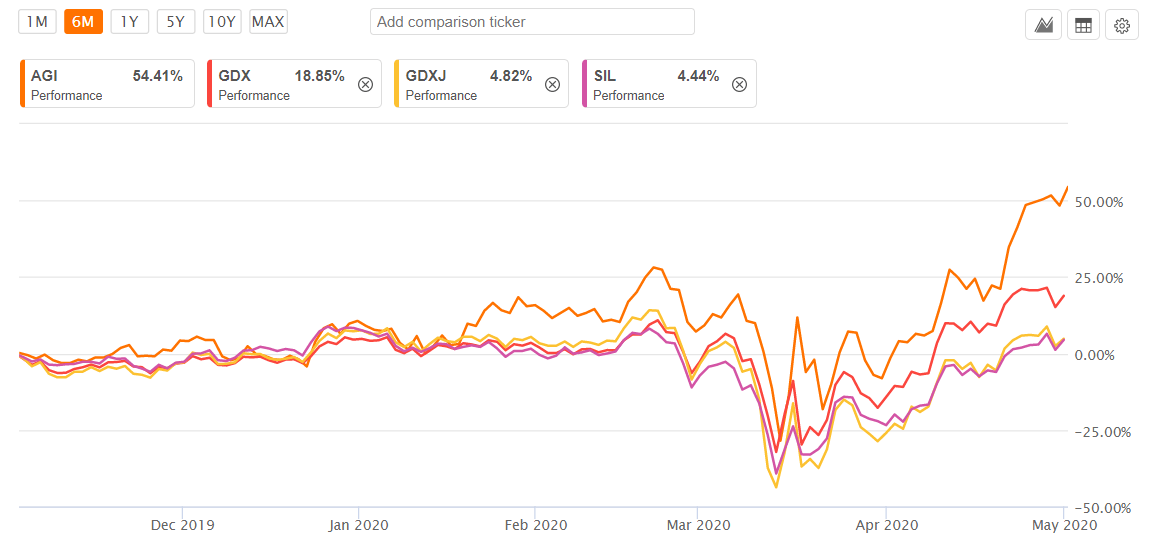 Figure-5 (Source: Seeking Alpha Premium)
For the numbers, gold prices have bounced back by ~0.2x [($1,710-$1,460)/$1,460 per ounce Au] from their 2020 lows witnessed in mid-March. In contrast, AGI’s price has shown a whopping 1.4x [($8.4-$3.5)/$3.5 per share] increase during the same period, revealing that AGI has a strong positive correlation with gold prices.
What comes next? Should I buy AGI now?
Technical Reasons: For that, we’ll take another look at Figure-3. Considering its past 2 years’ price trend, gold rages a bullish run that’s often followed by a shorter bearish run. The time gap between these bullish-bearish windows is contracting as we move ahead in FY 2020. However, gold has had a nice bullish run since mid-March this year. The prices are now consolidating and it’s possible we can see a drop within the range of $1,600-1,650/oz amid positive news on the global macroeconomic levels (certain countries including China and the US, are gradually lifting lockdowns).
If it comes to that, AGI’s price will reverse. Figure-4 reveals that AGI’s prices have lately formed a rising wedge pattern, and anything between $7.00-7.70 will present a buying opportunity for a medium-to-long term investment horizon. The downside risk at those price levels (for AGI) is low since gold will eventually move higher towards its medium-term target price of $1,800/oz, and AGI won’t lag behind.
Fundamental Reasons: AGI withdrew its previous FY 2020 production and cost guidance due to COVID-19 related temporary operational restrictions/suspension at its Canadian (Young Davidson-YD and Island Gold-IG) and Mexican (Mulatos-ML) mines. The Government-mandated operational disruptions in AGI’s two principal mining jurisdictions didn’t have any notable implication for Q1, however, an important part of Q2 2020 will continue to be affected by these disruptions (Figure-6).
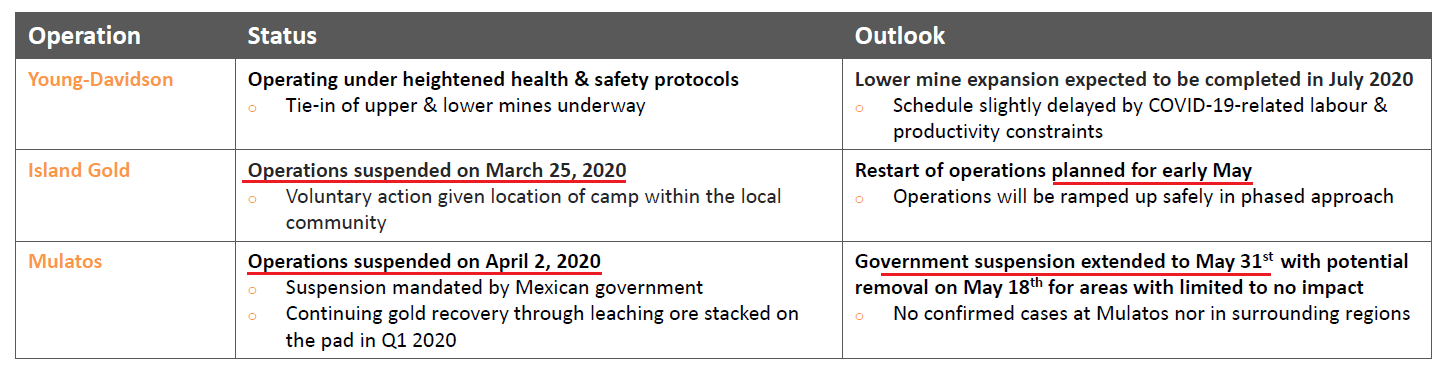 Figure-6 (Source: April Presentation)
AGI’s Q1 2020 mine-wise AISC is already higher than last year for all three mines (YD, IG, and ML) as shown in the table below:
| Mine | Q1 2019 AISC ($/oz) | Q1 2020 AISC ($/oz) | Cost Impact Y/Y (Fav./Adv.) |
| Young Davidson | $1,068 | $1,242 | Adverse |
| Island Gold | $649 | $670 | Adverse |
| Mulatos | $809 | $958 | Adverse |
However, rising gold prices have saved the day for AGI (significantly higher y/y average realized gold prices). Before annual guidance was withdrawn, AGI expected lower y/y gold production for FY 2020 (2020: 445 Koz expected production versus 2019: 495 Koz actual production). Operational suspensions/restrictions at 2 out of its 3 key mines would impact Q2 production. Unluckily, these operational disruptions are more pronounced on AGI’s lower-cost mines (IG and ML) and less so on YD. I believe this could also hurt AGI’s operating margins during Q2 and will reflect on the stock price, going forward. Have a look at the mine-wise AISC guidance for FY 2020 (Figure-7).
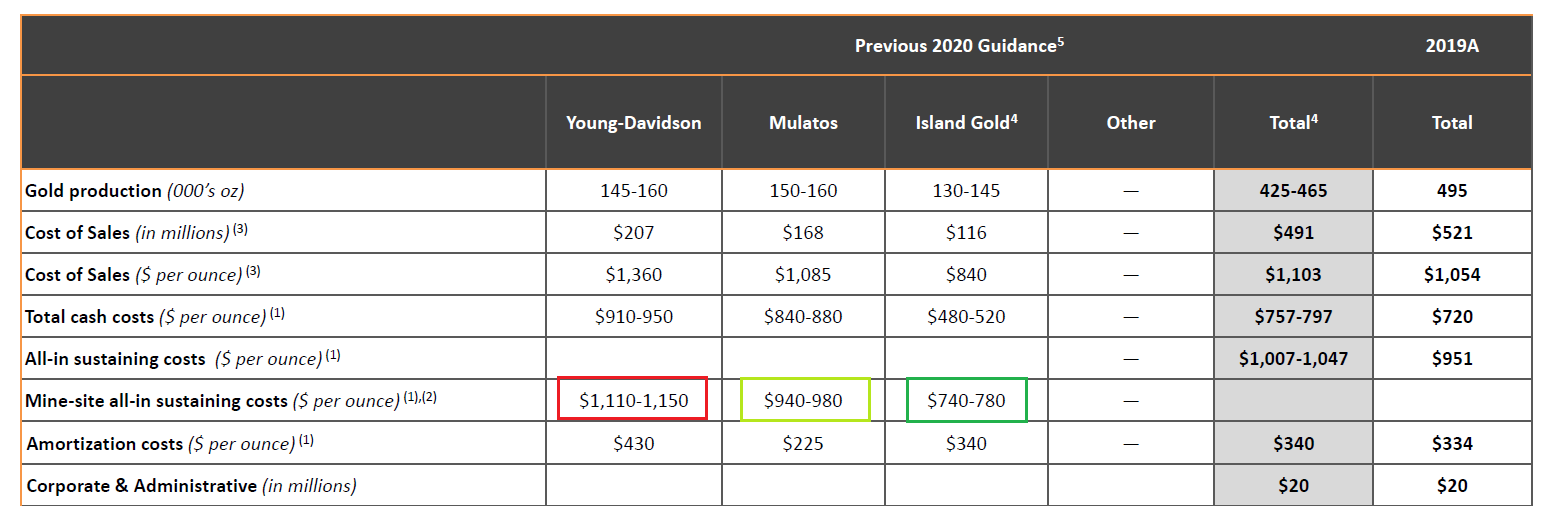 Figure-7 (Source: April Presentation)
Taking a long-term view
Despite those Q2 operational hurdles, AGI remains a long investment candidate. The price range indicated above was for investors who want to strike a bargain buy for a long-term investment horizon, anticipating a bullish gold market. I believe things would begin to improve from H2 2020 due to the following long-term growth catalysts:
- Young Davidson: AGI expects to complete YD lower mine expansion in July 2020 that’d extend mine’s throughput capacity to 7,500 tpd by year-end, and expand YD’s annual production capacity to ~200 Koz. YD lower mine expansion is critical for sustainable production given the fact that YD Surface Operations only had ~4,000 ounces in reserves (2019 estimate), while reserves at YD Underground Operations remained at ~3.142 Moz, implying that the future of YD lies in its underground operations. A similar case is evident for the mine’s M&I resources where surface and underground operations are expected to contain ~69 Koz and ~1.13 Moz Au respectively. Near-completed lower mine expansion would enable cost reduction, lower CAPEX spending, and thus result in higher FCF generation at YD.
- Island Gold: Recent repurchase/cancellation of a 3% NSR royalty on four mineralized claims against purchase consideration of $54 MM would enable IG’s mine-site AISC to further decline by ~5%. IG is already the lowest-cost mine in AGI’s portfolio, and I believe AGI has used its strong liquidity position to bring down production costs in the long run. This would help AGI’s long-term mining dynamics. An ongoing Phase III expansion study (expected to be complete in H2 2020) will evaluate expansion of IG’s throughput capacity beyond the current 1,200 tpd, and would possibly result in mine’s production ramp-up.
- Kirazli: A very promising project that entails mine-site AISC of ~$373/oz at an annual production rate of ~105 Koz. Mine construction has been suspended following expiry of mining concessions in October 2019. AGI is struggling to obtain renewal of mining concessions, however, renewal process was delayed following protests conducted by environmental activists at the mine site. A green signal in this project’s development would bring much green activity for AGI’s stock price.
- Balance Sheet: A large portion of AGI’s $3.5 BB balance sheet is represented by equity holders’ interest. Current liquidity stands at ~$615 MM comprising $215 MM cash assets at Q1-end and another $400 MM undrawn RCF (total revolver=$500 MM). With the $100 MM drawdown from its RCF, AGI has lost its ‘debt-free’ status but in my view, considering its CAPEX requirements and the fact that gold prices are trending much higher y/y, the company is well-positioned to leverage from those borrowed funds. On that note, the company posted an average $192.5 MM average annual CAPEX guidance (growth/sustaining/exploration) for FY 2020 before the guidance was withdrawn. The good thing; both tentative FY 2020 CAPEX and withdrawn RCF balance (taken individually) are well covered by AGI’s current cash balances. A suitable mix of utilization of fund sources (cash assets+RCF) would enable AGI to continue its dividend payments/share repurchase programs, and thereby sustain the creation of long-term shareholder value.
- De-risked projects: Two-third majority of AGI’s current operating mines are located in a very safe mining jurisdiction (Canada). Plus, Lynn Lake, a promising future project is also in Canada. In my experience, pipeline projects in the mining industry are exposed to multiple risk factors. These include (list is not comprehensive); (1) Lower-than-expected head grades resulting in higher costs, (2) Cost overruns in CAPEX/liquidity concerns preventing miners to fund/proceed with mine development, (3) Regulatory permitting issues/delays, (4) Strikes/protests from unions/ others over mine operations/development, (5) Government intervention (6) Force Majeure (including risk of terrorism in less developed mining jurisdictions), etc. Apart from risk items no. 3 & 4 pertaining to AGI’s promising Kirazli project in Turkey, the company’s projects are protected from the other common risk factors, thanks to safe mining jurisdictions and a strong liquidity profile.
Investor Takeaway
AGI is currently trading at the higher end of its 52-week range ($3.34-8.77) and has outperformed gold and its benchmark ETFs in price returns. The share’s also trading much higher than its 200-day Exponential Moving Average (Figure-8).
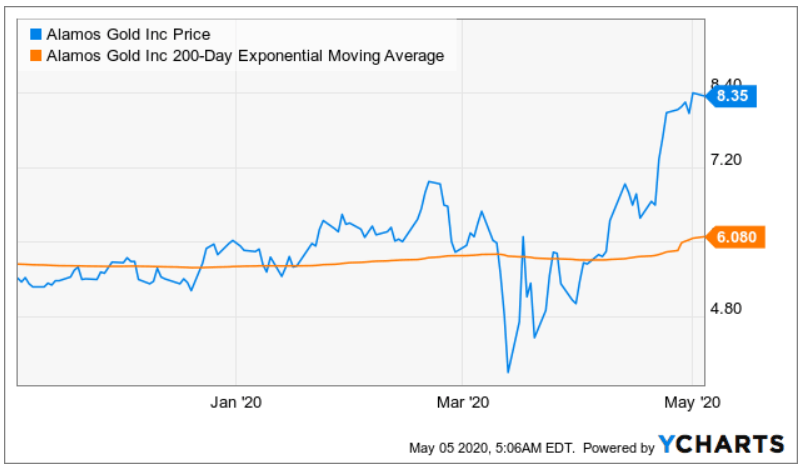 Figure-8 (Source: YCharts)
It’s less likely that there’ll be a straight bullish run in gold, and AGI prices. The next leg of correction in gold could send AGI’s prices down by ~10-15% from the current prices. This implies that long-term holders of AGI would do well to book some gains at the current high prices, and then aim for a bargain buy within the range of ~$7.50.
Nevertheless, AGI is poised to grow in the long term thanks to its promising (existing+future) projects, strong liquidity profile, safe mining jurisdictions, and favorable mining dynamics. However, we need gold to reach (or exceed) the $1,800/oz mark for AGI to continue its solid upward trajectory.
Disclosure: I/we have no positions in any stocks mentioned, and no plans to initiate any positions within the next 72 hours. I wrote this article myself, and it expresses my own opinions. I am not receiving compensation for it (other than from Seeking Alpha). I have no business relationship with any company whose stock is mentioned in this article.
Be the first to comment