

busypix/E+ via Getty Images
The big issue with AIVL historical data
WisdomTree U.S. AI Enhanced Value Fund (NYSEARCA:AIVL) is an actively managed exchange-traded fund (“ETF”) based on a machine learning model developed by Voya Investment Management. When you go on the AIVL ticker page, you can see articles on two ETFs: AIVL and DTN. The explanation is on the fund’s home page:
Prior to January 18, 2022, Fund performance reflects the investment objective of the Fund when it was the WisdomTree U.S. Dividend ex-Financials Fund (DTN) (…)
In other words, AIVL has reused the structure of an old dividend ETF launched in 2006. DTN had low liquidity and assets under management (“AUM”), which likely prompted the decision to stop it. Using its legal structure to launch a new fund was probably cheaper and faster than creating a new open-end investment company.
Unfortunately, this means all DTN historical data before January 2022, including the inception date, price chart, and distributions, are associated with the AIVL ticker. They are completely irrelevant from an investor’s point of view.
It is not uncommon to see an ETF changing tickers, names or underlying indexes. In the case of AIVL, everything has changed: the ticker, the name, the strategy, and even the investing style. It was an indexed dividend fund, it is now an actively managed value fund. Even if it was not the sponsor’s intention to mislead investors, a lot of info is irrelevant on the fund’s home page and in financial databases. In particular, AIVL should be excluded from any backtest, simulation or statistics starting before 1/18/2022.
DTN strategy and portfolio
The fund is actively managed and its AI model is a black box. Not only for shareholders: many machine learning models are black boxes for their own designers, especially deep learning models based on neural networks. The type of ML algorithm is not specified in the prospectus. It tells us that “securities selected by the AI model typically have a lower price-to-book ratio, a lower price-to-earnings ratio, and greater free cash flow.” The weight of any individual company is capped at 6%. The portfolio turnover is quite high: 96% in the most recent fiscal year. The expense ratio of 0.38% is quite low for an actively managed fund. The 12-month distribution yield is about 2%.
The fund invests almost exclusively in U.S. companies (94%). It is balanced between large caps (46%) and mid/small caps (54%).
It is cheaper than the S&P 500 regarding usual valuation ratios, but it is more expensive than the S&P Mid-Cap 400 index, represented in the next table by the iShares Core S&P Mid-Cap ETF (IJH).
|
AIVL |
SPY |
IJH |
|
|
Price/Earnings TTM |
18.67 |
20.33 |
13.89 |
|
Price/Book |
2.19 |
3.76 |
2.34 |
|
Price/Sales |
2.15 |
2.38 |
1.26 |
|
Price/Cash Flow |
11.07 |
15.08 |
11.1 |
Source: Fidelity.
Risky stocks regarding my preferred quality metrics weight 12% of the portfolio. These are companies with at least two red flags among: bad Piotroski score, negative ROA, unsustainable payout ratio, bad or dubious Altman Z-score, excluding real estate and financials, where these metrics are unreliable. According to my calculations, the weighted average Return-on-assets and Piotroski F-score are slightly inferior to S&P 500 values: 5.8% vs 7.5% and 5.3 vs. 5.7, respectively. These metrics point to a portfolio quality slightly inferior to the benchmark.
Financials, industrials, technology and healthcare are the heaviest sectors (between 13% and 19% each). Other sectors are below 10%. Compared to a mid-cap value index, represented below by the iShares S&P Mid-Cap 400 Value ETF (IJJ), AIVL greatly underweights consumer discretionary and real estate. It may be explained by sector-specific decisions from the AI, whereas the passive index ranks all stocks on the same metrics. However, we can’t really know what happens inside the black box.
Sector Breakdown (Chart: author: data: WisdomTree)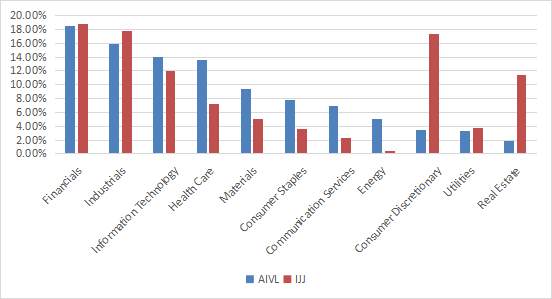
AIVL has 100 holdings. The top 10 names, listed below, represent 29.6% of asset value. The heaviest one weighs 3.5%, so risks related to individual stocks are moderate.
|
Ticker |
Name |
Weight% |
P/E ttm |
P/E fwd |
P/Sales |
P/Book |
P/FCF |
Yield% |
|
Comcast Corp. |
3.49% |
31.83 |
10.43 |
1.34 |
2.01 |
20.57 |
3.06 |
|
|
Medtronic PLC |
3.27% |
25.99 |
15.78 |
3.61 |
2.15 |
84.05 |
3.25 |
|
|
Intercontinental Exchange, Inc. |
3.08% |
41.80 |
19.65 |
6.59 |
2.65 |
27.14 |
1.56 |
|
|
Keurig Dr Pepper, Inc. |
3.07% |
27.29 |
20.73 |
3.65 |
1.98 |
31.16 |
2.29 |
|
|
LKQ Corp. |
3.03% |
13.32 |
14.33 |
1.19 |
2.92 |
31.00 |
1.96 |
|
|
Amcor Plc |
2.88% |
15.68 |
14.36 |
1.11 |
3.83 |
165.83 |
4.37 |
|
|
SS&C Technologies Holdings, Inc. |
2.84% |
25.32 |
13.01 |
3.05 |
2.67 |
22.32 |
1.27 |
|
|
Roper Technologies, Inc. |
2.84% |
38.51 |
26.50 |
8.15 |
2.85 |
120.44 |
0.64 |
|
|
Nasdaq, Inc. |
2.64% |
26.14 |
21.76 |
4.71 |
4.77 |
27.84 |
1.36 |
|
|
Genpact Ltd. |
2.48% |
26.38 |
15.71 |
2.03 |
5.08 |
28.21 |
1.07 |
Ratios: Portfolio123.
Since its true inception in January 2022, AIVL has lagged mainstream value indexes, represented in the chart below by the iShares S&P 500 Value ETF (IVE) and the iShares S&P Mid-Cap 400 Value ETF. A one-year price history is too short to assess the ML model, but it doesn’t start very well for the AI-powered fund relative to passive indexes.
AIVL vs. S&P value indexes (Portfolio123)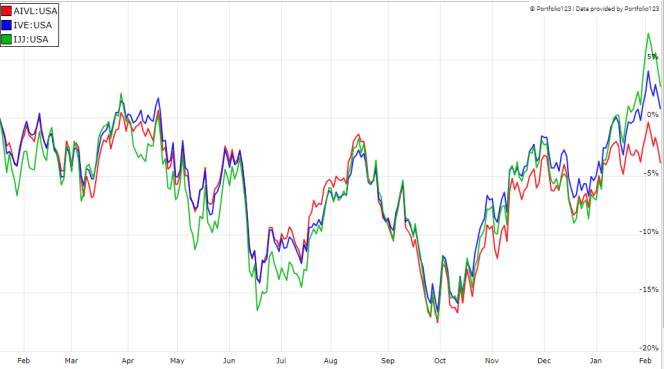
Takeaway
WisdomTree U.S. AI Enhanced Value Fund is an actively managed value ETF following a strategy based on a machine learning model. It was launched in January 2022, but historical prices start in 2006, because WisdomTree has reused the legal structure of an older fund. All data prior to 1/18/2022 are irrelevant and must be ignored. The AIVL portfolio is well-diversified across sectors. Valuation and quality metrics are average. The real price history is not long enough to assess the AI methodology, but it is unconvincing: the fund has underperformed S&P large-cap and mid-cap value indexes.
Editor’s Note: This article discusses one or more securities that do not trade on a major U.S. exchange. Please be aware of the risks associated with these stocks.
Be the first to comment