

Bet_Noire
By Robert Hughes
Chart 1 (BLS, AIER)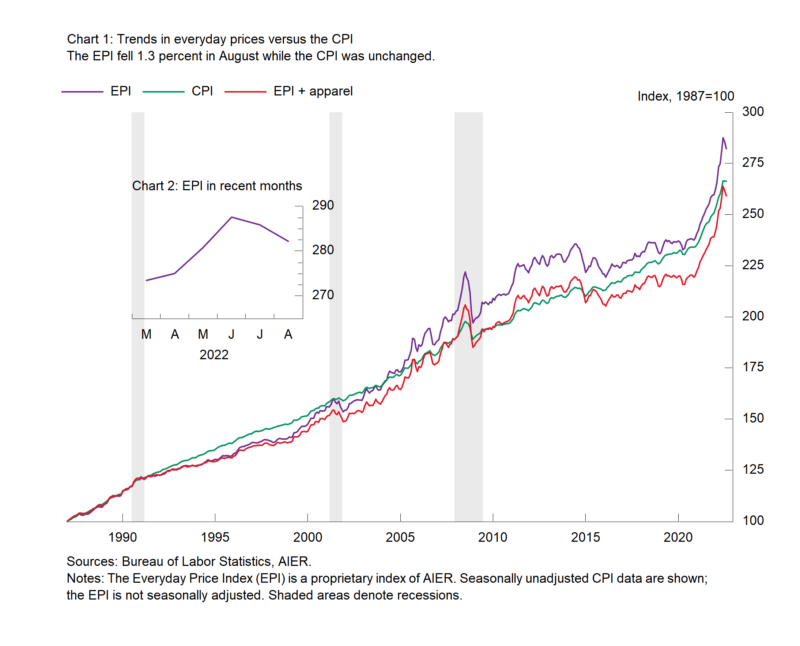
AIER’s Everyday Price fell 1.3 percent in August after a 0.6 percent drop in July. Those were the first back-to-back declines since October and November 2020. From a year ago, the Everyday Price Index is up 11.1 percent. However, motor fuel prices more than accounted for the overall drop in August, offsetting significant increases in other key categories.
Motor fuel prices, which are often a significant driver of the monthly changes in the Everyday Price index because of the large weighting in the index and the volatility of the underlying commodity, sank 12.1 percent for the month, reducing the overall gain by 188 basis points (on a not-seasonally adjusted basis). Seven other components showed price declines in August, including a 1.4 percent drop in admissions prices, a 0.8 percent decline in intracity transportation, and a 0.3 percent fall in cable and satellite services. Still, their contributions to the overall index were quite small.
Price increases were led by domestic services (up 2.3 percent), recreational reading materials (2.1 percent), fees for lessons (1.8 percent), and pets and pet products (1.6 percent). The three largest positive contributors in August after motor fuel were household fuels and utilities (up 1.3 percent and contributing 19 basis points), food at home (up 0.7 percent and contributing 17 basis points), and food away from home (up 0.9 percent for the month and adding 13 basis points). A total of 15 categories had price increases versus eight showing declines.
The Everyday Price Index, including apparel, a broader measure that includes clothing and shoes, fell 1.1 percent in August. Over the past year, the Everyday Price Index, including apparel, is up 10.7 percent, the lowest since February.
Apparel prices rose 1.7 percent on a not-seasonally-adjusted basis in August. Apparel prices tend to be volatile on a month-to-month basis. From a year ago, apparel prices are up 5.1 percent.
The Consumer Price Index, which includes everyday purchases as well as infrequently purchased, big-ticket items and contractually fixed items, was unchanged on a not-seasonally-adjusted basis in August. Within the CPI, energy posted a 6.2 percent drop on a not-seasonally-adjusted basis while food had an 0.8 percent increase. Over the past year, the Consumer Price Index is up 8.3 percent.
The Consumer Price Index, excluding food and energy, rose 0.5 percent for the month (not seasonally adjusted) while the 12-month change came in at 6.3 percent. The 12-month change in the core CPI was just 1.3 percent in February 2021 and 2.3 percent in January 2020, before the pandemic.
After seasonal adjustment, the CPI rose 0.1 percent in August while the core increased 0.6 percent for the month. Within the core, core goods prices were up 0.5 percent in August and 7.1 percent from a year ago. Significant increases for the month were seen in household furnishings (1.1 percent), motor vehicle parts and equipment (1.1 percent), and new vehicles (0.8 percent), while video and audio products fell 1.6 percent and used cars and trucks posted a 0.1 percent drop.
Core services prices were up 0.6 percent for the month and 6.1 percent from a year ago. Among core services, gainers include health insurance (up 2.4 percent and 24.3 percent from a year ago), motor vehicle repair (1.7 percent and 9.1 percent from a year ago), motor vehicle insurance (up 1.3 percent for the month and 8.7 percent from a year ago), medical care (up 0.8 percent for the month and 5.6 percent from a year ago), rent of shelter (which accounts for 31.9 percent of the CPI, rose 0.7 percent for the month and 6.3 percent from a year ago).
Public transportation was one of the few significant categories to post a decline in August (-3.2 percent for August but still up 1.0 percent from a year ago). Within public transportation, airline fares fell 4.6 percent for the month but were up 33.4 percent from a year ago, and car and truck rentals fell 0.5 percent for the month and 6.2 percent from a year ago. Price pressures for many goods and services in the economy remain elevated due to shortages of supplies and materials, logistical and supply chain issues, and labor shortages and turnover. Sustained elevated price increases are likely distorting economic activity by influencing consumer and business decisions. Furthermore, price pressures have resulted in an aggressive Fed tightening cycle, raising the risk of a policy mistake. The fallout surrounding the Russian invasion of Ukraine continues to disrupt global supply chains. All of these are sustaining a high level of uncertainty for the economic outlook. Caution is warranted.
Table 1 (BLS)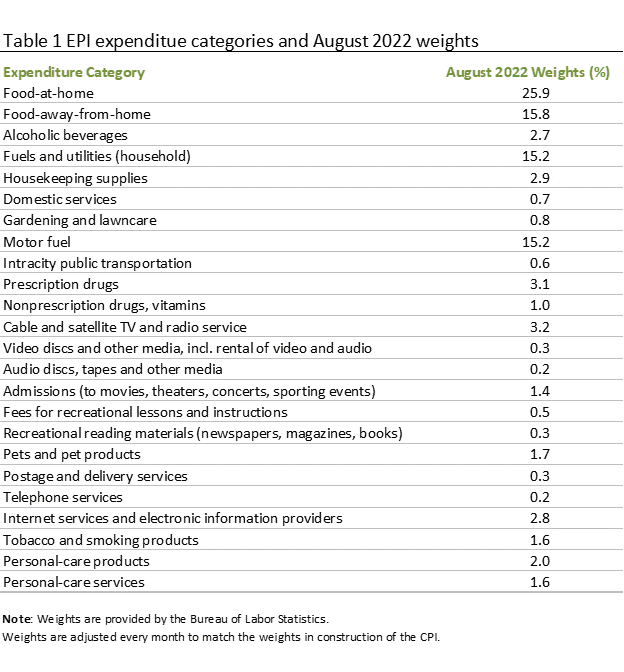
Editor’s Note: The summary bullets for this article were chosen by Seeking Alpha editors.
Be the first to comment