


Black_Kira
The AI Powered Equity ETF (NYSEARCA:AIEQ) is an actively managed exchange-traded fund leveraging a proprietary artificial intelligence-driven U.S. equity strategy.
Though AI-guided investment strategies have something of a magic aura, as if robots could miraculously outthink, outmaneuver, and outperform human equity researchers and stock pickers, the reality is more of a damp squib.
Specifically, incepted in October 2017, AIEQ underperformed the iShares Core S&P 500 ETF (IVV) during the November 2017 – December 2022 period, with 2020 being the only alpha year.
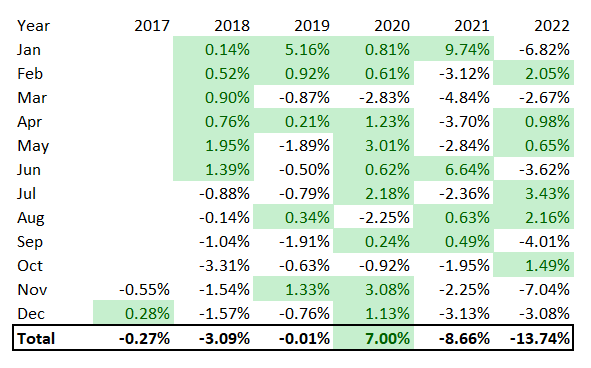
Created by the author using data from Portfolio Visualizer
Alas, its strategy delivered fairly lackluster returns last year, failing to adapt to the high inflation and higher interest rates narrative that was dominating, thus grossly underperforming IVV and outperforming the tech, growth-heavy Invesco QQQ ETF (QQQ) that bore the brunt of the rotation out of larger and more expensive equities only by about 68 bps.
Besides, risk-adjusted returns were also disappointing as there is something to dislike about volatility too, which I will explain shortly.
In this regard, my point is that the AI-centered strategy has simply not lived up to expectations, at least for now, and a Buy rating would be unjustified. Now let us discuss other essential nuances.
What is at the crux of AIEQ?
As stated in the fact sheet, the ETF
… seeks long-term capital appreciation and targets a maximum risk-adjusted return versus the broader U.S. equity market.
The cornerstone of the strategy is the proprietary EquBot Model which utilizes the IBM Watson platform. It seems gargantuan amounts of data are processed as predictive models are created on myriads of U.S. companies, 6,000 according to the fund, with each firm having a Financial, News & Information, Management, and Macro underlying deep-learning model. Daily signals contributing to each of the four mentioned models are aplenty, e.g., 34 signals for Financial and 23 for News, etc. In sum, about 30 to 200 companies having “the greatest potential over the next twelve months for appreciation” should be identified.
Looking under the hood
What the algorithm favors at this point? As of January 13, AIEQ was long 136 stocks, with approximately 30.4% allocated to the major ten. At this juncture, the AI strategy is pronouncedly bullish on the consumer discretionary sector, with close to 21% invested. The next sector in this mix is financials, with 19.4%; healthcare is the last in the top trio, with 12%.
Meanwhile, it sees little value in the energy sector (six stocks with 5.3%, mostly exploration & production players), if at all. The corollary here is that the algorithm is likely implicitly bearish on the oil price. Also, at least for now, the AI model does not think it is worth playing defense (consumer staples and utilities are underrepresented, with a combined weight of 4.2%) or betting on an oil price rally to resume; I suppose this also means the algorithm is bearish on inflation as if it was forecasting the inflation issue to persist, it would have a meaningfully larger allocation to oil & gas and materials (3.3% weight) players.
Please take notice that the fund is actively managed, with a turnover of 1,708%, so its portfolio composition and factor exposure could shift tectonically in a blink of an eye. Of course, this does not mean we should ignore the factor analysis completely.
Let me start with value. Unfortunately, the weighted-average earnings yield is negative, as per my calculations, a direct consequence of the solid share of the holdings nursing deep accounting losses, more than 36% at this juncture. The most notable example here is Novavax (NVAX), a biotech stock and the pandemic-era market darling AIEQ is most bullish on, at least for now, as its weight is around 4.8%. The AI algorithm here is clearly making a contrarian value bet on this heavily discounted pandemic play as NVAX has a one-year negative price return of ~89%, expectedly an F Momentum grade, and totally lackluster profitability (imagine a negative 76.3% gross margin). Unfortunately, we do not know the rationale behind it, perhaps, an over 53% forward revenue growth rate is one of the factors that contributed.
It should also be noted that the $1 trillion club members are not represented, at all, while only 9.9% is allocated to mega-caps, with the largest stock in the mix being JPMorgan Chase (JPM). Overall, owing to more than half of the net assets allocated to mid- and small-caps, the weighted-average market capitalization is about $49.5 billion, as per my calculations.
Looking at the weighted-average forward sales growth rate of over 26%, a hypothesis worth making is, as I pointed out above, that the model is positive on the beaten-down low-quality medium-size growth stocks in the potentially lower interest rates environment amid abating inflation. Again, this is just a surmise, the exact rationale is more of a mystery.
Since I mentioned ‘low-quality,’ it is necessary to provide supporting evidence. Specifically, over 27% of the holdings have a Quant Profitability grade of D+ and worse, which is a red flag. For context, owing to the weighting schema, IVV rarely has a share of such stocks accounting for more than just a few percentage points as I illustrated in a few articles in the past. Meanwhile, almost 28% of the AIEQ holdings (ex-financials) are cash-burning. Lucid Group (LCID), a luxury EV manufacturer with a premium valuation, and Lyft (LYFT), a ridesharing company, are examples worth mentioning.
Performance: more of a damp squib
Incepted in October 2017, AIEQ is not the only ETF leveraging an AI-powered strategy. For instance, we could compare the results it has delivered with the QRAFT AI-Enhanced U.S. Large Cap ETF (QRFT), which was incepted on 20 May 2019.
| Portfolio | AIEQ | IVV | QQQ | QRFT |
| Initial Balance | $10,000 | $10,000 | $10,000 | $10,000 |
| Final Balance | $11,820 | $14,800 | $15,682 | $15,887 |
| CAGR | 4.78% | 11.56% | 13.38% | 13.79% |
| Stdev | 24.10% | 19.73% | 22.89% | 20.80% |
| Best Year | 25.40% | 28.76% | 48.40% | 40.07% |
| Worst Year | -31.90% | -18.16% | -32.58% | -22.70% |
| Max. Drawdown | -32.99% | -23.93% | -32.58% | -27.55% |
| Sharpe Ratio | 0.27 | 0.6 | 0.62 | 0.68 |
| Sortino Ratio | 0.4 | 0.92 | 0.97 | 1.1 |
| Market Correlation | 0.91 | 1 | 0.93 | 0.95 |
Created by the author using data from Portfolio Visualizer
During the June 2019 – December 2022 period, AIEQ underperformed IVV, as well as its peer QRFT and QQQ; delving deeper, the 4.78% CAGR being the lowest in the group is mostly the consequence of the fund having the weakest returns compared to them in 2021 and 2022; for example, in 2022, it lost 31.9%, while QRFT was down by 22.7%.
For better context, the table below summarizes AIEQ, IVV, and QQQ performance metrics for November 2017 – December 2022. Again, the CAGR is the weakest (risk-adjusted returns are also bleak), while the standard deviation is the highest.
| Portfolio | AIEQ | IVV | QQQ |
| Initial Balance | $10,000 | $10,000 | $10,000 |
| Final Balance | $12,953 | $16,328 | $18,153 |
| CAGR | 5.13% | 9.95% | 12.23% |
| Stdev | 22.66% | 18.37% | 21.49% |
| Best Year | 31.24% | 31.25% | 48.40% |
| Worst Year | -31.90% | -18.16% | -32.58% |
| Max. Drawdown | -32.99% | -23.93% | -32.58% |
| Sharpe Ratio | 0.28 | 0.54 | 0.59 |
| Sortino Ratio | 0.4 | 0.8 | 0.9 |
| Market Correlation | 0.92 | 1 | 0.94 |
Created by the author using data from Portfolio Visualizer
Obviously, there are bright spots too. One of the strongest periods was November 2017 – August 2021, when AIEQ outmaneuvered IVV; alas, QQQ still was way ahead.
| Portfolio | AIEQ | IVV | QQQ |
| Initial Balance | $10,000 | $10,000 | $10,000 |
| Final Balance | $19,204 | $18,845 | $25,651 |
| CAGR | 18.56% | 17.97% | 27.86% |
| Stdev | 20.63% | 16.79% | 18.60% |
| Best Year | 31.24% | 31.25% | 48.40% |
| Worst Year | -7.56% | -4.47% | -0.12% |
| Max. Drawdown | -21.64% | -19.56% | -16.96% |
| Sharpe Ratio | 0.87 | 1 | 1.35 |
| Sortino Ratio | 1.41 | 1.56 | 2.51 |
| Market Correlation | 0.92 | 1 | 0.93 |
Created by the author using data from Portfolio Visualizer
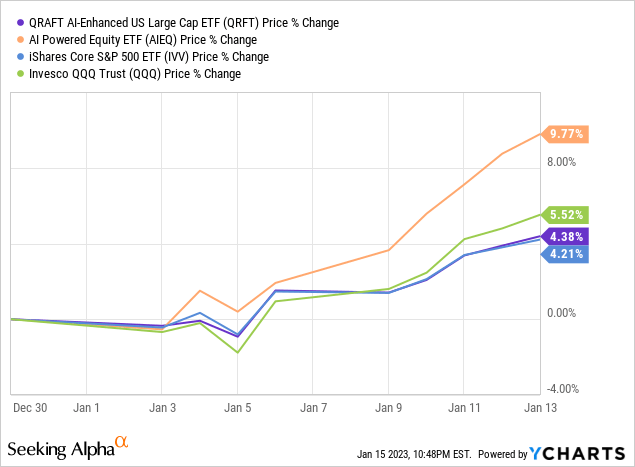
It should also be noted that the ETF has started 2023 on an up note, precisely like the market, capitalizing on the abating inflation narrative. We will see whether this momentum will last.
Final thoughts
AIEQ’s AI-based strategy is beautifully sophisticated, so expenses are expectedly burdensome, at 75 bps.
Yet, sadly, as it frequently happens in the active and smart-beta ETF universe, its performance appeared to be fairly disenchanting compared to the bellwether U.S. equity portfolios like QQQ and IVV. Apart from that, it also underperformed QRFT during the period discussed, also delivering a much higher standard deviation.
As of January 13, it had a comparatively quality-light portfolio with a tilt towards high-growth mid- and small-cap stocks. This is a mix perfect for the lower inflation, lower interest rates, and no-recession (or a phenomenally mild one) scenario. However, owing to an active high-turnover strategy, there is certainly no guarantee the fund will not thoroughly overhaul its holdings shortly.
In sum, machines do beat the market but only at times. I suppose a Hold rating is the best possible.
Be the first to comment