

Tomwang112/iStock via Getty Images
Thesis
The thesis of this article is twofold. First, I want to reflect on my biggest mistake made so far in 2022. And second, I want to caution readers about the ongoing challenges for the mREIT sector, including or maybe even in particular, for two of its leaders: AGNC Investment Corp. (NASDAQ:AGNC) and Annaly Capital Management (NYSE:NLY).
The mistake involved me making the wrong call on NLY despite making the correct judgment on the mREIT. It’s a painful lesson that I had to relearn: It’s dangerous to bet on a stock in a troubled sector, no matter how strong that stock is relative to the sector.
In an article published back in March 2022, entitled “Annaly Capital: Still Attractive Among mREITs, But mREIT Itself Under Pressure,” I argued (correctly from what has transpired since then) why the mREIT sector is under pressure with a narrowing yield spread. Then I went on to argue for a bull thesis on NLY. The argument was built on the following basis (I’m quoting my exact words to drive the lesson home):
- …as a leader in the sector, Annaly offers a reasonable combination of scale, safety, and valuation relative to other peers.
- But investors need to be aware that the mREIT sector itself is under pressure with the start of a new macro credit cycle, and NLY has its own unique challenges in addition.
Despite all of these, I went ahead and argued for a bullish thesis on NLY! And NLY lost 17.8% since then, about 2% more than the overall market.
To make the lesson even more painful and ironic, I even offered the energy sector as an alternative idea in the article (again, quoting my exact words then). And by the way, in case you have not noticed, the energy sector gained more than 15% since then. Well, have I not mentioned this is my biggest mistake in 2022 so far?
As such, for investors who do not need this level of current income, our view is there are other more attractive sectors (such as the energy sector) that offer better total return prospects (but again, at a much lower level of current income).
The lesson, again, is that no one is safe on a sinking boat. In cases like this, it’s better to short the entire boat, rather than to bet on someone outperforming everyone else.
Looking forward, I see the mREIT sector suffering more pain as the yield spread continues to narrow. And this time, given that I’ve just relearned the above lesson, you will see why I’m cautious even on its two leading stocks (NLY and AGNC) immediately next.
Seeking Alpha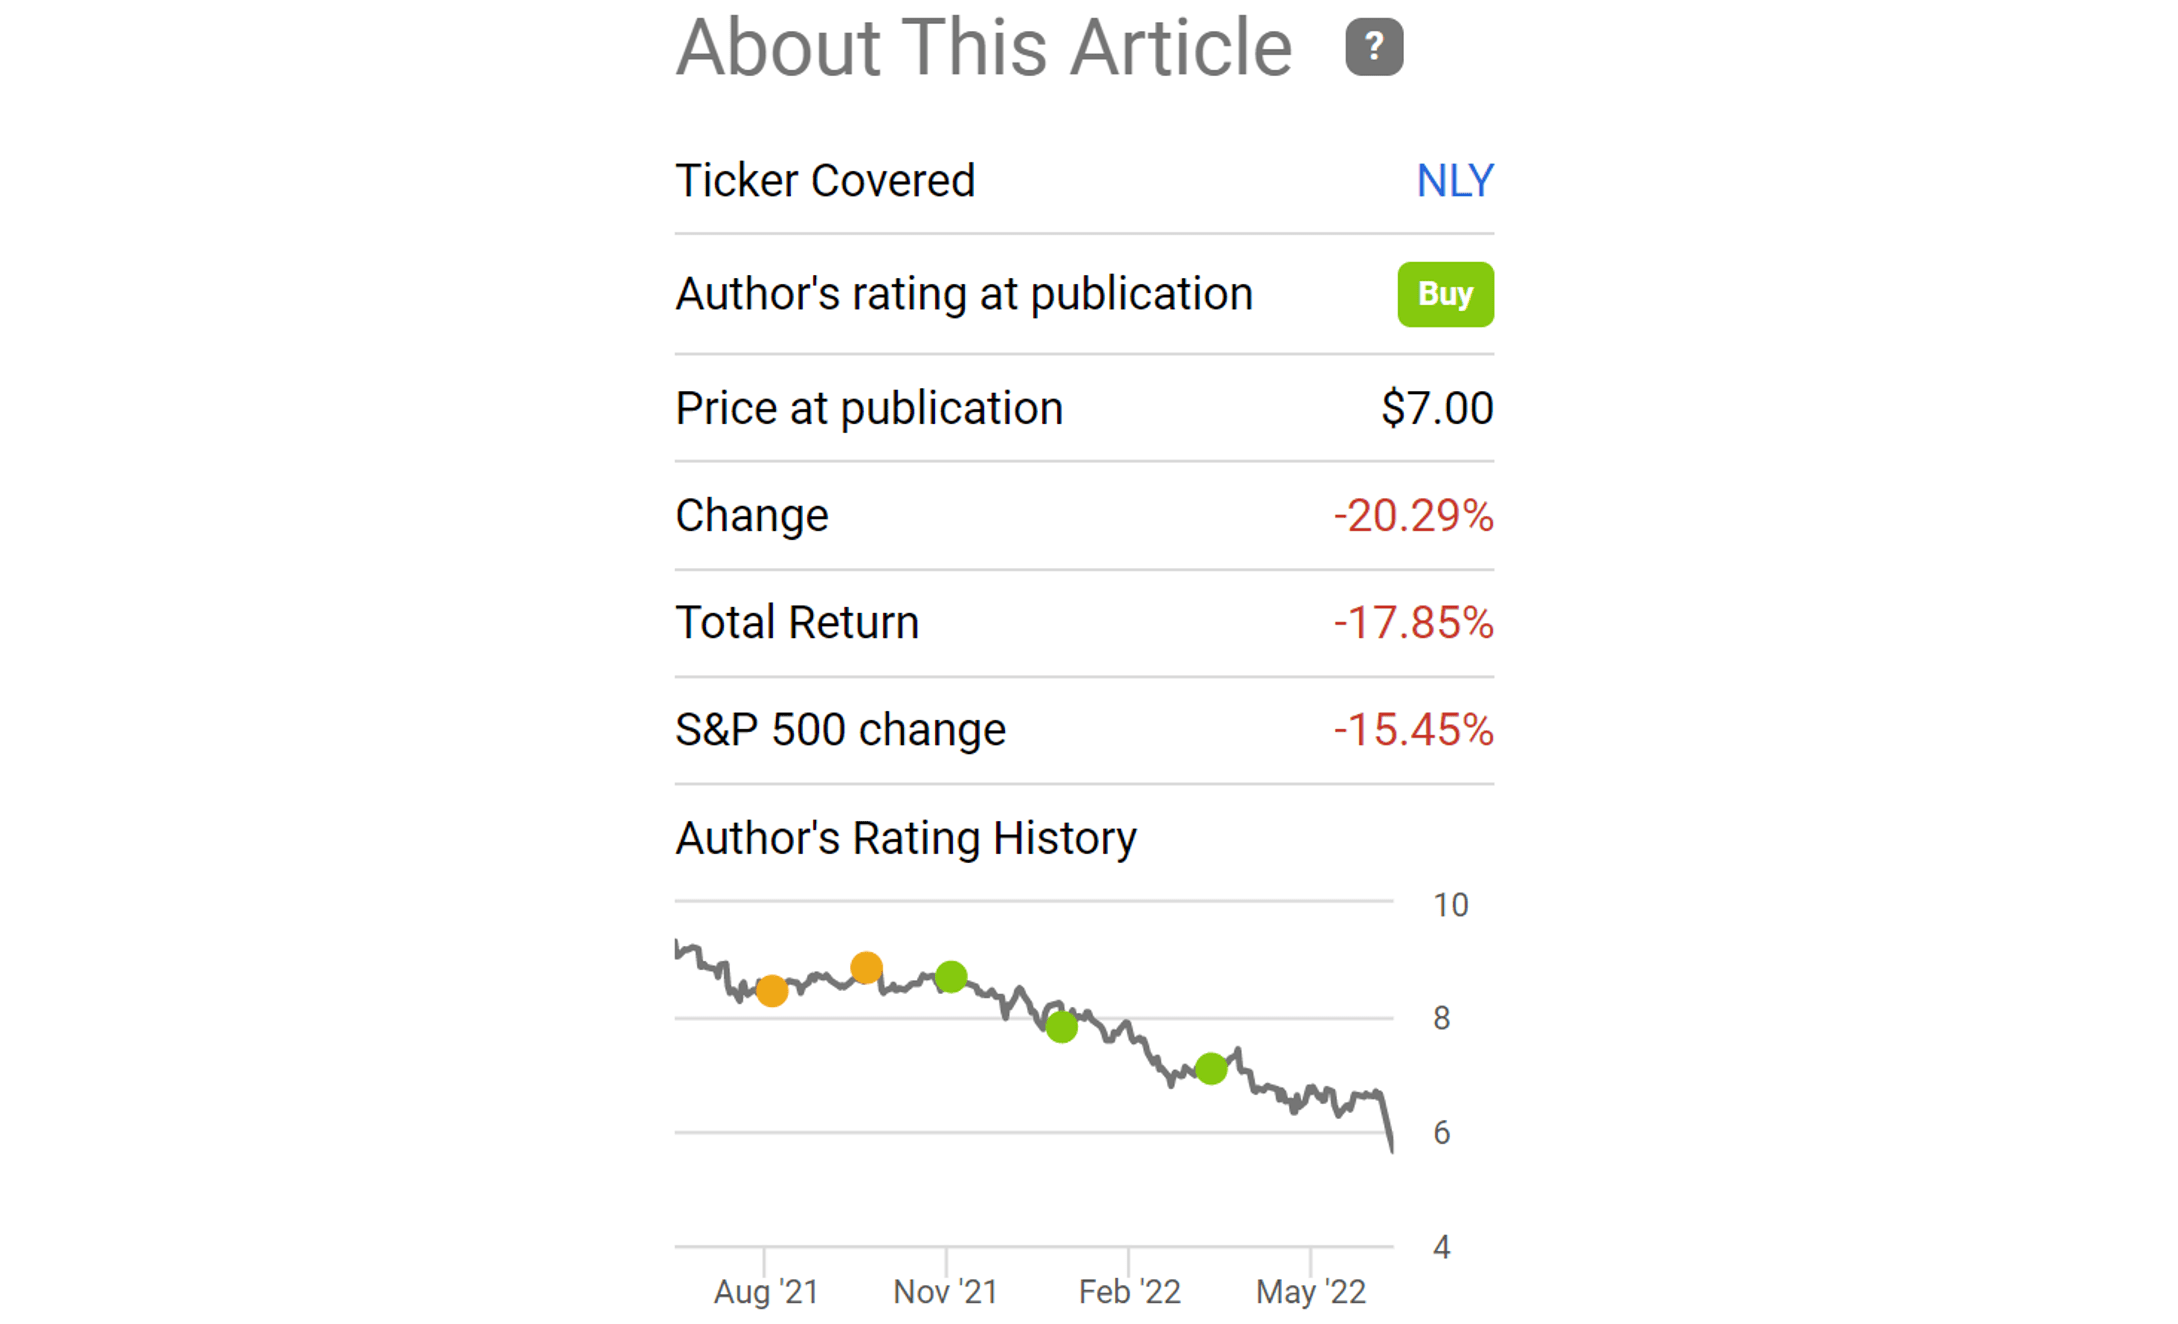
mREIT overview
The mREIT sector is one of the most sensitive sectors to the macro-credit cycle. My overall view of the mREIT sector has been detailed in my earlier articles. A brief recap is provided here to facilitate the rest of the discussion:
The yield spread between short-term debt instruments and long-term instruments is the most effective indicator of the credit cycle. When yield spreads expand or contract, it can signal changes in the underlying economy or financial markets. The mREIT stocks like AGNC are typically the ones that are most sensitive about such yield spread changes because they make money on the spread between the long-term and short-term rates. The thicker the spread, the easier and the more money they can make, as you can clearly see from the following chart.
The chart I was referring to is the following one. The shows how AGNC’s dividend payments, which are used to represent its profitability, change with yield spread over the credit macro-cycle.
FRED and Seeking Alpha data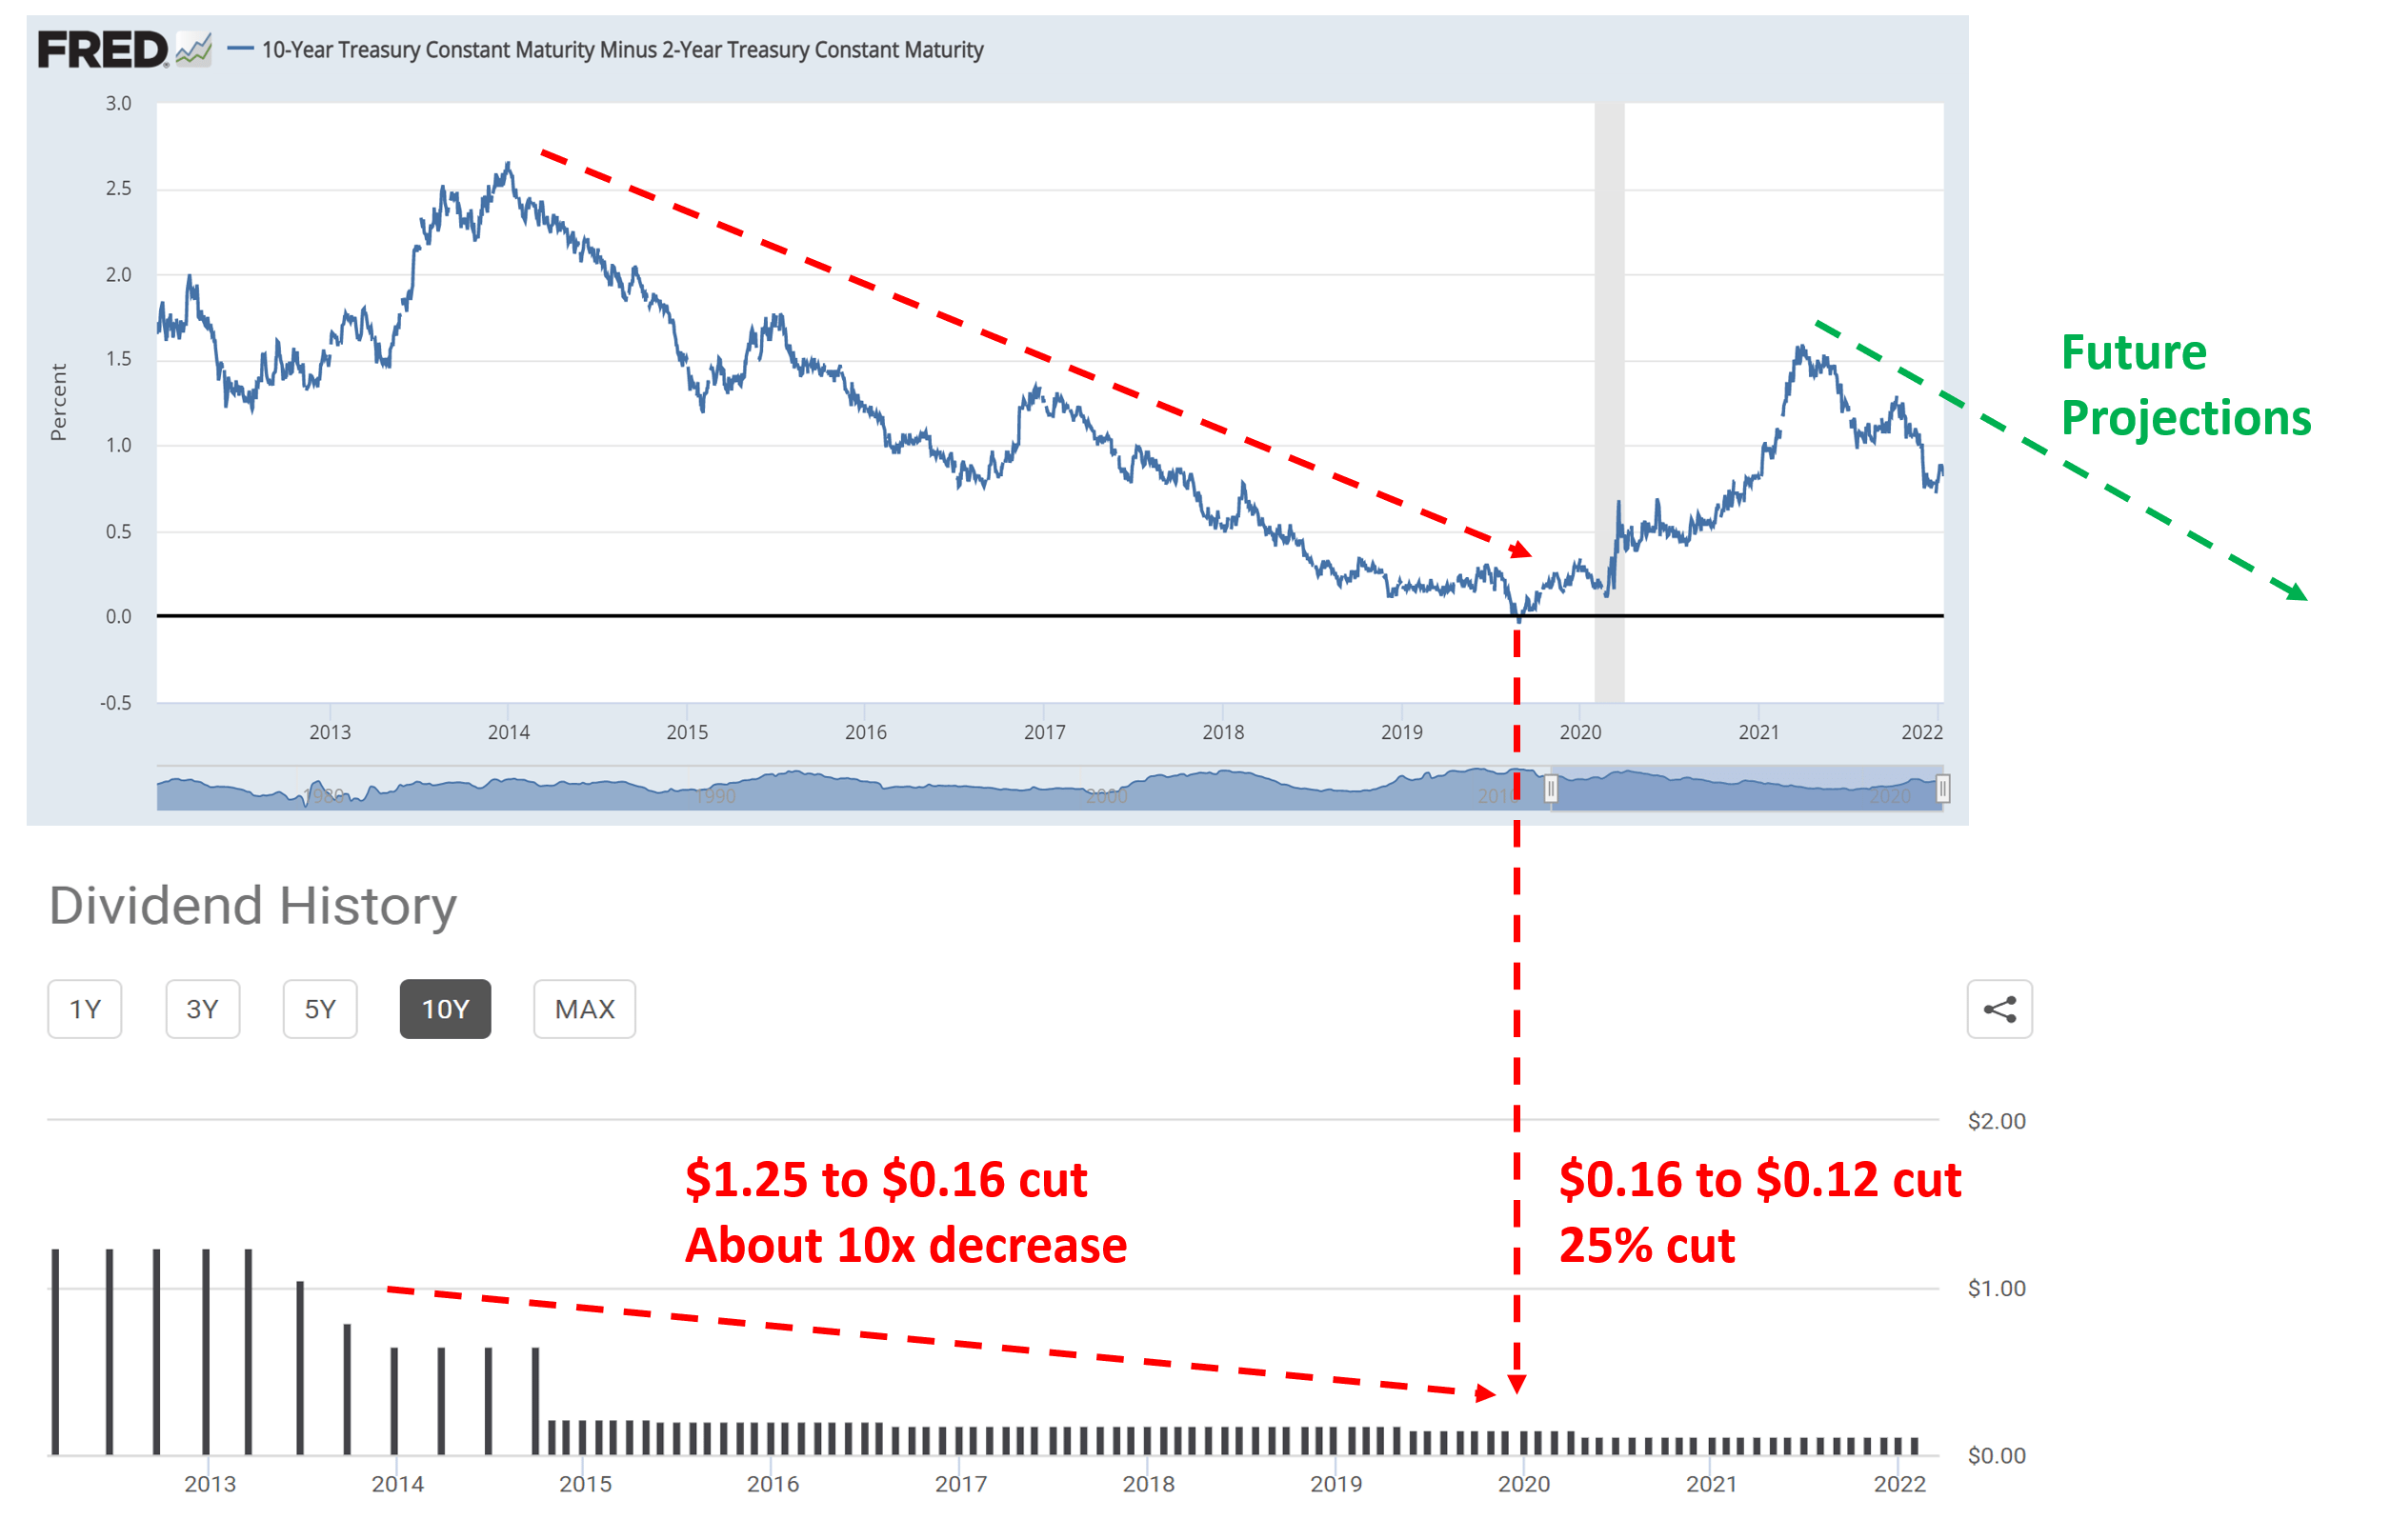
AGNC and NLY: More pain ahead
Now, unfortunately, the yield spread has changed in the wrong direction for mREIT since my earlier writing as you can see in the chart below. At that time, the yield spread between 10-year and two-year treasury rates was about 0.9%. And as of this writing, the yield spread is a thinly 0.18%. As a matter of fact, the yield curve has even briefly inverted in April 2022 as you can see.
And with no surprise, the mREIT sectors responded poorly under such a tightening spread. The sector, represented by the iShares Mortgage Real Estate Capped ETF (REM), lost more than 30% YTD, far underperforming the overall market’s 9.5% loss. The leaders in this sector, NLY and AGNC, did not fare any better. They actually suffered more losses than the sector. AGNC suffered a total loss (dividends are accounted for) of 32% and NLY 30%. Other leading stocks in the sector such as STWD and NRZ also suffered sizable losses.
Looking forward, I see further tightening of the yield curves due to the rising inflation, rate hikes, the Russian/Ukraine war’s interruptions on the global supply chain disruptions and commodity prices. The Federal Reserve just announced 75 basis points hike in the benchmark rates, the largest hike since 1994. However, even after such a large hike, the benchmark federal-funds rates still only sit in a range between 1.5% and 1.75%, still far from the inflation rate. To fight the ongoing inflation, my estimate is that the short-term interest rates will need to gradually rise to somewhere between 3% to 4%.
On the other hand, I expect the long-term rate to rise no more than that. That is, I expect the long-term rates to stabilize in the 3% to 4% range for the long run also, leading to a further narrowing. As argued in my earlier writings:
At a very fundamental level, in the long term, treasury bond rates cannot rise above long-term inflation or GDP growth. Our government has been relying on inflation and GDP expansion to inflate away and outgrowth its debt obligations for decades in the past. And it will (it will have to) continue doing so.
This means the narrowing is expected to continue and keep pressuring NLY and AGNC’s profitability as we’ve seen above. Furthermore, the narrowing will also stretch their balance sheet, as discussed next.
FRED Seeking Alpha Seeking Alpha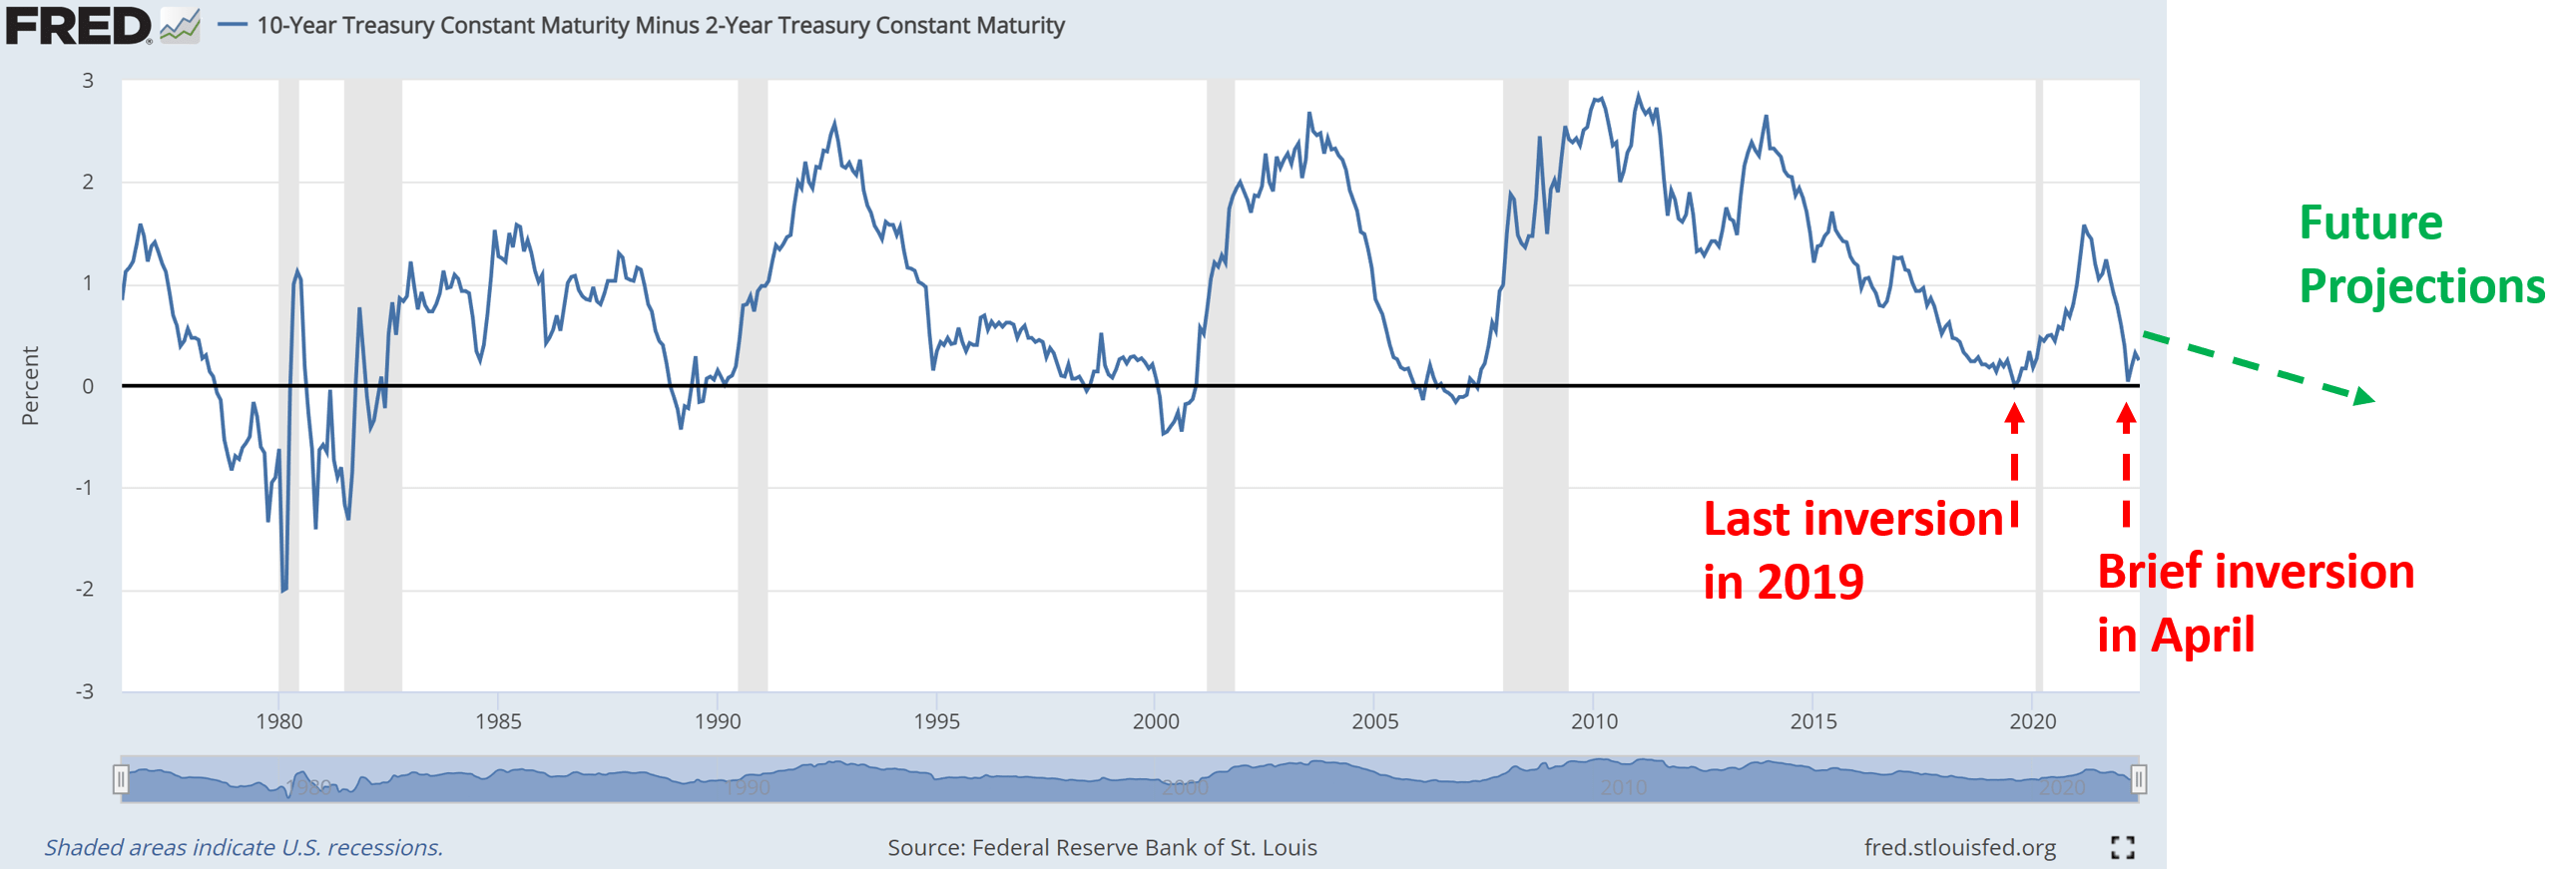

AGNC and NLY: Not deleveraged enough
Sensing the pressure ahead, both AGNC and NLY have been deleveraging since early 2020, shortly after Fed’s hard landing and epic QE. As you can see from the top panel of the following chart below, AGNC reduced its leverage ratio from about 12x in early 2020 to as allow as 8x by the end of 2021 as the cost of funds dropped essentially to zero. NLY’s picture is similar. It reduced its leverage ratio from about 10x in early 2020 to as allow as almost 6x by the end of 2021.
However, the leverage climbed back in recent quarters as the yield spread narrowed rapidly. Both AGNC and NLY rely on short-term borrowing to fund their purchases of federal agency mortgage-backed securities. As their borrowing costs move higher and profit margins squeeze, their balance sheets are stretched. Their leverage ratios are actually above the historical average despite their conscious efforts to deleverage. As you can see, the long-term average leverage ratio for AGNC is 9.17x. And currently, its leverage is at 9.6x, about 5% above its historical average. In NLY’s case, its long-term average leverage ratio is 7.96x. And currently, it’s at 8.78x, about 10% above its historical average.
Seeking Alpha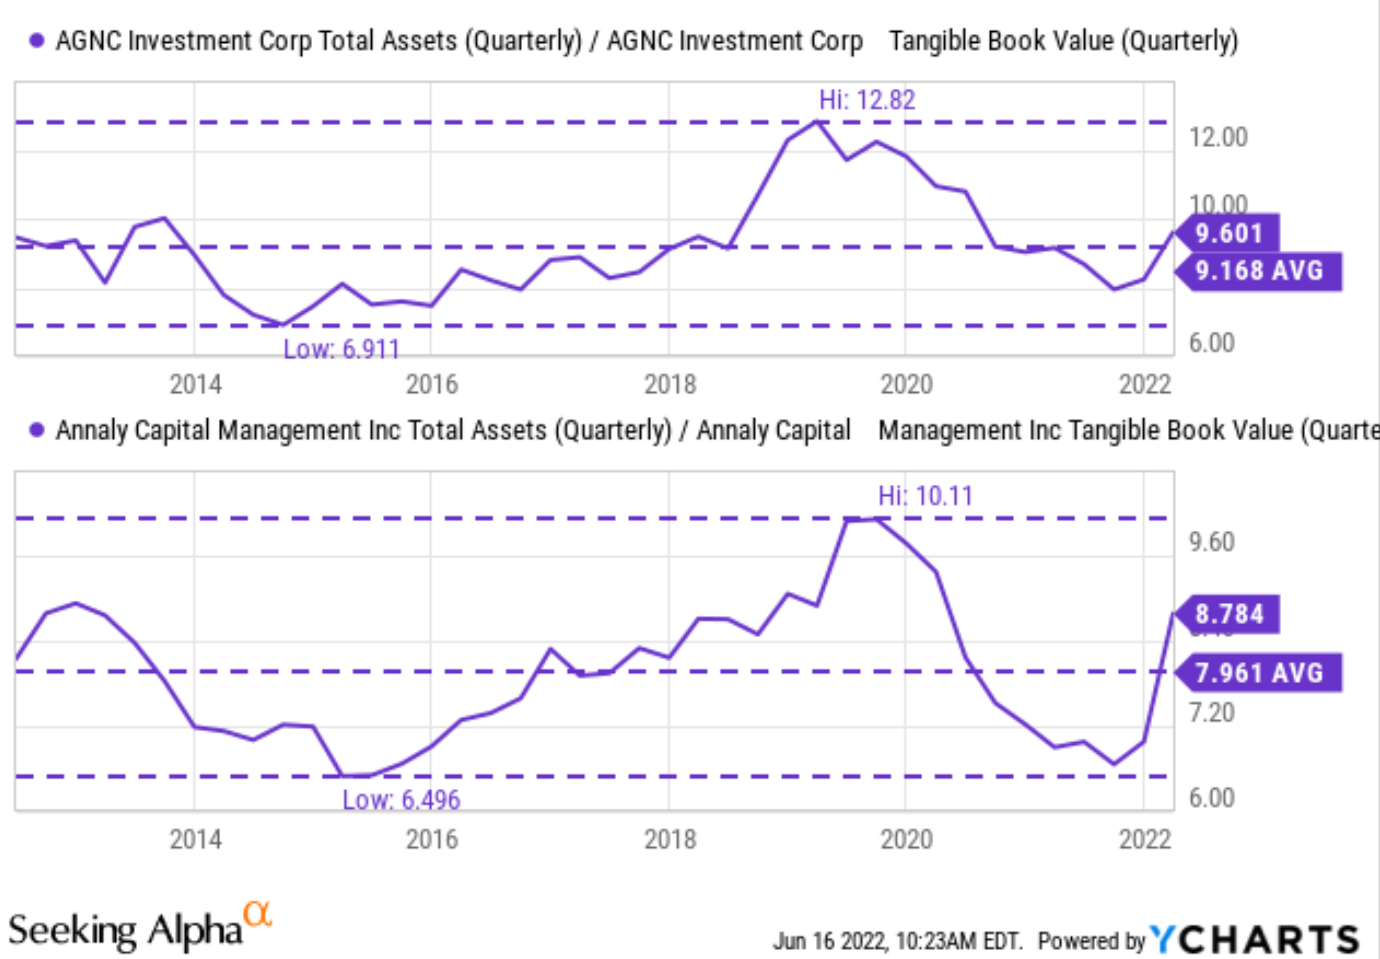
AGNC and NLY: Valuation not discounted enough
Income-seeking investors might be allured to AGNC and NLY given their high yields. Indeed, they both offer dividend yields at an attractive level now, both in relative and absolute terms. As you can see from the chart below, AGNC’s dividend yield fluctuated from as low as 7.7% to above 20% in the past decade, with a long-term historical average of 12.9%. Currently, it’s yielding 14.1%, about 9% above its historical average. NLY’s picture is very similar. Its historical yield fluctuated from about 9.2% to again over 20%, with a long-term historical average of 12.11%. Currently, it is yielding 15.7%, a whopping 30% above its historical average.
However, we want to caution investors against such seemingly high yields on the surface. Because of the risks mentioned above, such yield might not be sustainable in the near future. In addition, their valuations are actually not that discounted, not enough to compensate for the risks ahead in my view.
Seeking Alpha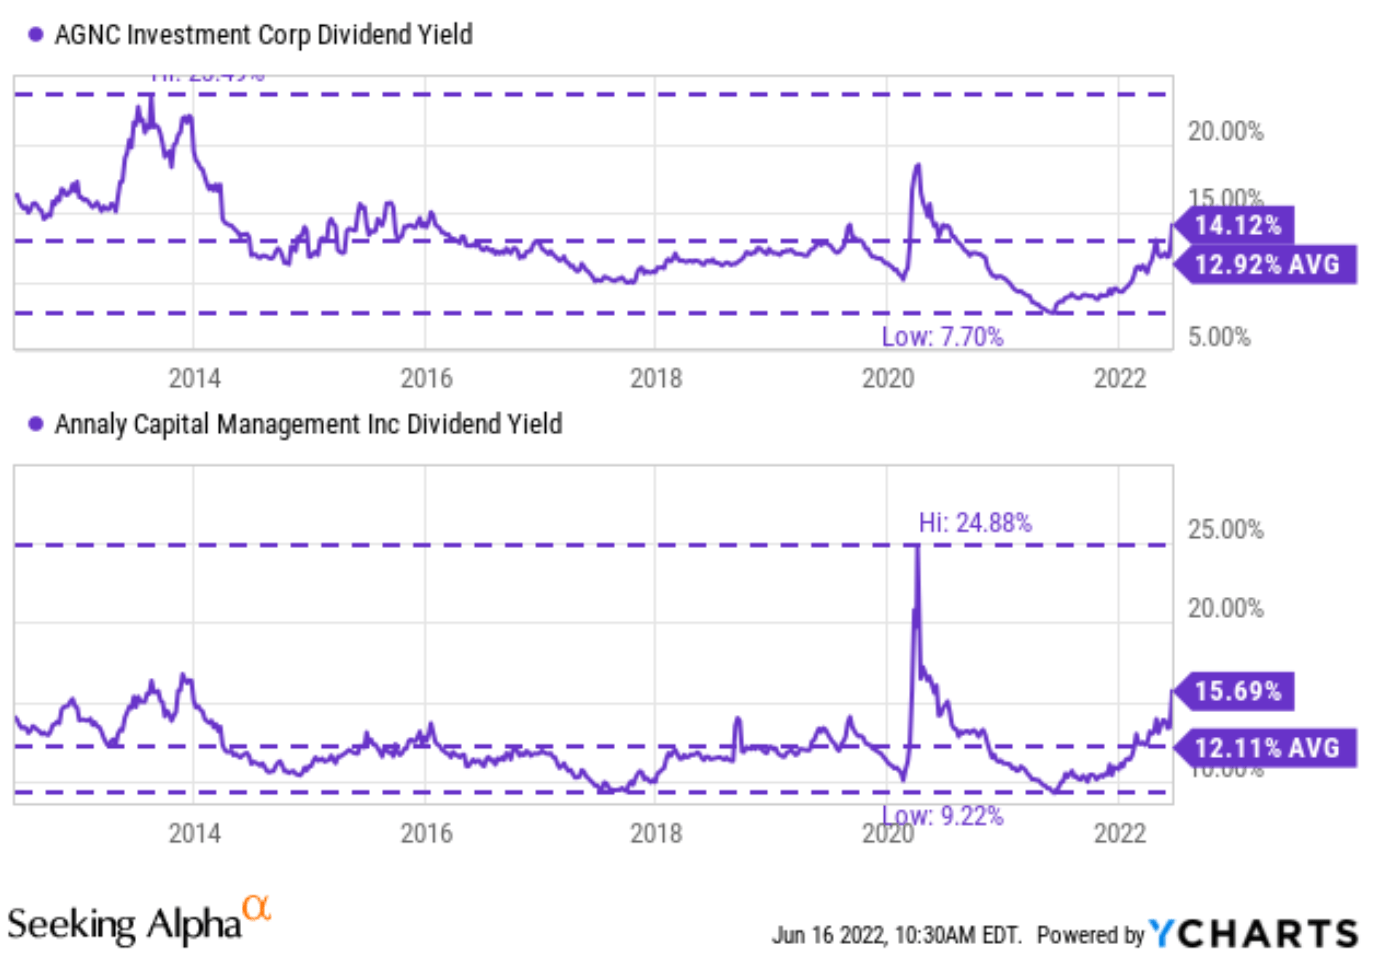
As you can see from the next chart, AGNC has been historically priced at an average of 0.953x of its tangible book value. Currently, it’s priced at 0.766x, a 20% discount from the historical average. NLY has been priced at about 0.974x of its tangible book value on average. And currently, it’s at 0.937x times, only a 4% discount from its historical average. Such mild discounts are insufficient to overcome the risks ahead in my view. As a matter of fact, such discounts are not even sufficient to overcome their loss of book value. Both AGNC and NLY have been suffering book value loss in recent years, and I view such loss as chronological. AGNC has lost more than 20% of its book value over the past year, and NLY more than 26%.
Book value loss hurts mREIT investors twice. First, a stock price decline (even if the valuation stays stable). And second, tangible book value is the farm that mREITs rely on to harvest their profit. As the book value shrinks, the farm gets smaller.
Looking forward, rising interest rates and inflation will keep hurting the demand for new mortgages and at the same increasing the odds of defaults – and both will cause further loss of book value.
Seeking Alpha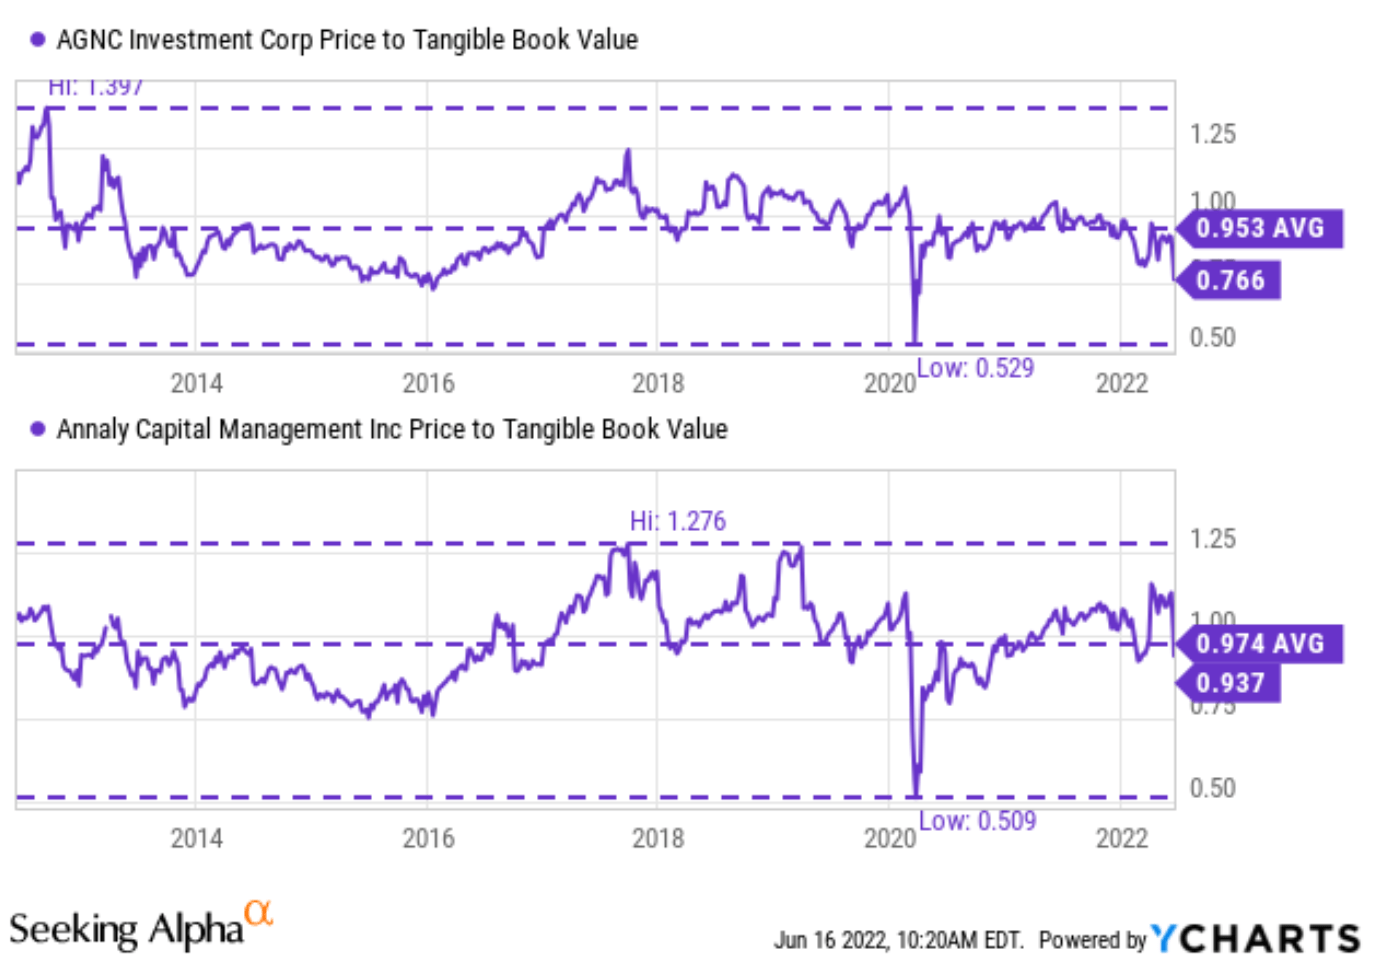
Final thoughts and other risks
No one is safe on a sinking boat. As the mREIT sector gets pressured by the macro credit cycle, it’s a good idea to stay clear of the whole boat, instead of trying to identify winners that could outsurvive the boat – even leaders like AGNC and NLY. Their dividend yields are indeed alluring to income-seeking investors both in relative and absolute terms. AGNC is yielding 9% above its historical average and NLY a whopping 30% above its historical average. However, my view is that such yields are not sufficient to compensate for the risks ahead.
As a matter of fact, they do not even sufficiently compensate for their loss of book value. AGNC has lost more than 20% of its book value over the past year, and NLY more than 26%. Such losses have been chronological over the past quite a few years, and I see them continue with the risks analyzed.
Besides the above risks associated with interest rates, the war between Russia and Ukraine adds another key uncertainty for AGNC and NLY. Since the breakout of the war, energy prices and food prices have surged tremendously and will remain stubbornly high in the foreseeable future. The inflation data that Bureau of Labor Statistics released last week show that CPI rose 8.6% YoY, a new record since 1981. More importantly, the prices of food and fuel increased the most. And according to an estimate from Moody’s senior economist Ryan Sweet, such increases are causing about $460 of extra living expenses per month for an average household. That would be $460 less for each household to use to pay their mortgage (or to save toward their new mortgage). The issue would only compound on a national level with time if the war drags on, which is very likely. Many (including myself) expected a speedy resolution of the war when it first broke out. But it has been sadly going on for about four months by now and still shows no sign of ending.
Be the first to comment