

Lemon_tm
In June of this year, I issued a sell signal for Meta Platforms, Inc. circa $160, after attempting to decipher this equities complex bearish third wave resulting in two targets. The first was $81 and the next is Meta’s distant memory of $18. So far, the $80 region has been achieved, which is the Fibonacci 161 area outlined in the previous article.
Remarkably, just over a year ago, this stock was trading at $384. We have seen an outrageously steep decline in the past 14 months or so. In this article, we will look at what has gone so wrong for Meta along with delving into the technical analysis that has bought this stock to where it is today.
According to CNBC, Meta is contending with a broad slowdown in online ad spending, challenges from Apple’s iOS privacy update, and increased competition from TikTok. Add it up, and Meta has posted consecutive quarters of revenue declines and is expected to post its third straight drop in the fourth quarter.
The company said revenue for the fourth quarter will be $30 billion to $32.5 billion. Analysts were expecting sales of $32.2 billion.
While revenue fell 4% in the third quarter, Meta’s costs and expenses rose 19% year over year to $22.1 billion. Operating income declined 46% from the previous year to $5.66 billion.
Meta’s operating margin, or the profits left after accounting for costs to run the business, sank to 20% from 36% a year earlier. Overall net income was down 52% to $4.4 billion in the third quarter.
At its after-hours level of about $108, Meta is trading at its lowest since March 2016, which was eight months before the election of Donald Trump as president.
Revenue in the Reality Labs unit, which houses the company’s virtual reality headsets and its futuristic metaverse business, fell by almost half from a year earlier to $285 million. Its loss widened to $3.67 billion from $2.63 billion in the same quarter last year.
Meta’s report is the latest sign of trouble in the online advertising market, which is getting hammered by factors including Apple’s 2021 iOS privacy update and fears of an impending recession. Those concerns have caused companies to slash their marketing and ad campaigns.
Now we will move to the monthly chart to examine how this key level of the $80 region has technically been achieved before looking for any signs of a bullish turnaround.
If you have read June’s article, you will be aware that the complexity of this bearish structure lies in the fact that this current wave is actually the second bearish third wave, technically.
Meta monthly structure (C Trader)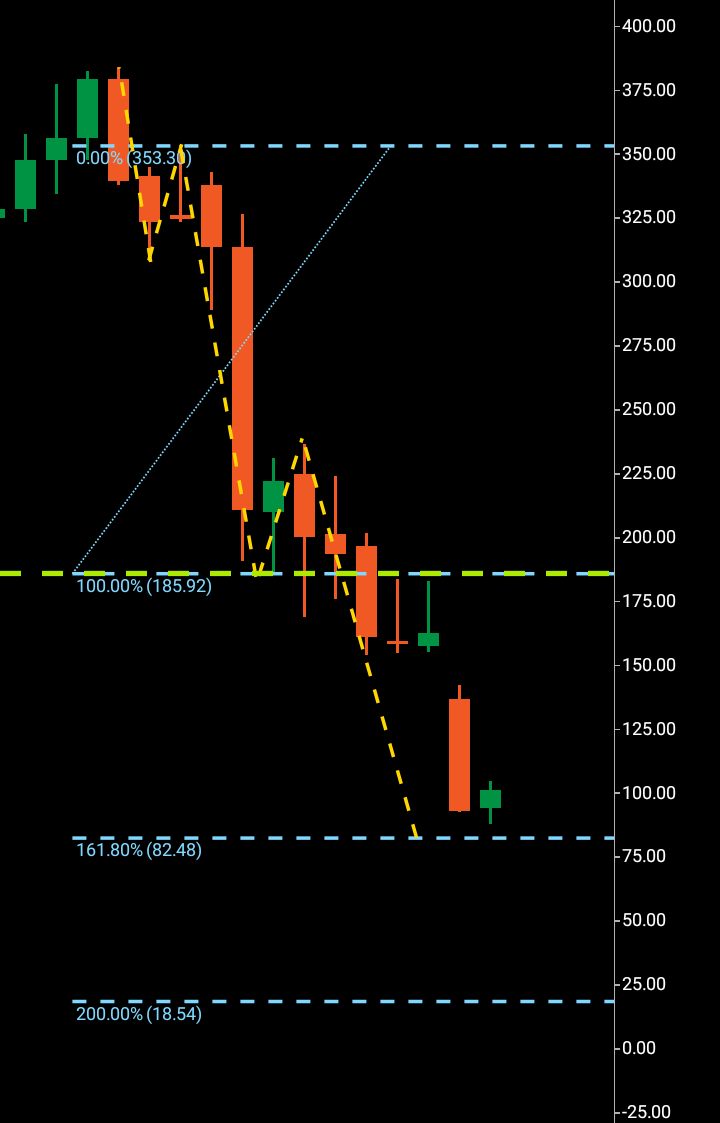
We can see in the chart above the wave one $353-$185 with the wave two $185-$240 region. Issuing the sell signal by the break of support of $185, it is firstly $81. That is the next technical stop, followed by $18, which would be the completion for this large bearish third wave. However, there is a caveat that comes in between all this, and that is the first of the third waves is also showing an additional target that lies between these two numbers.
If we look at the chart below, we can see the Fibonacci 423 completion lies at $58. This additional technical number could also see the share price arrive at if the $80 region is to be broken.
Meta monthly complex first third wave (C Trader)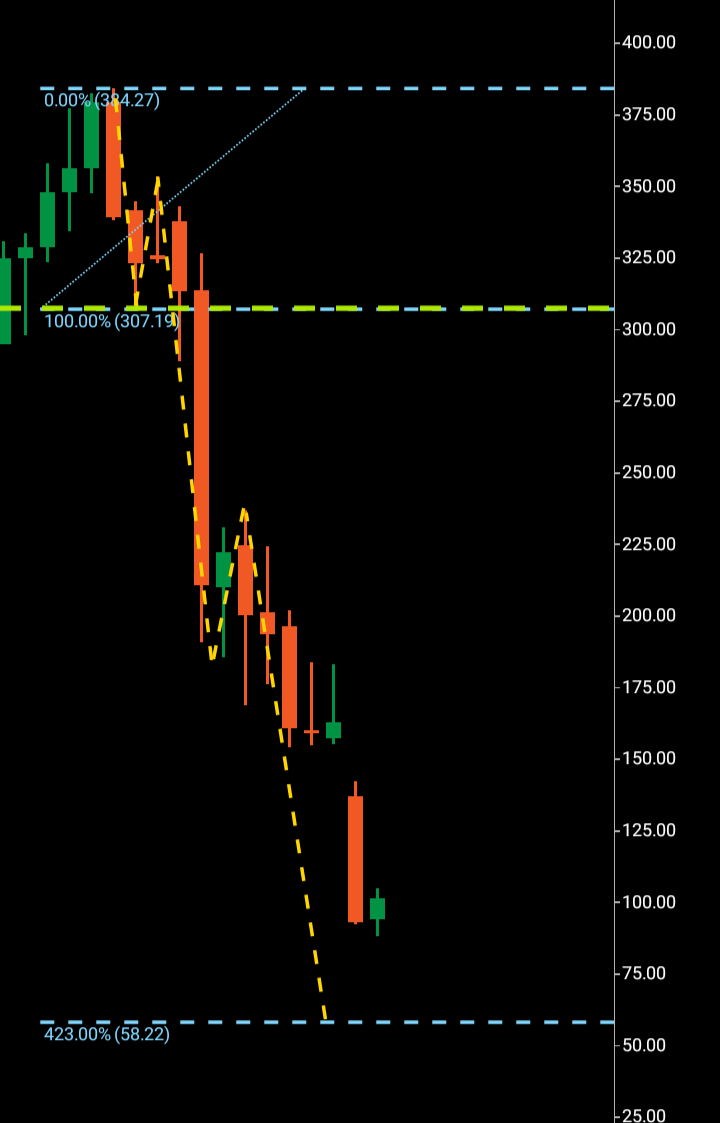
To summarize, I have selected hold on this equity while waiting for a further indication as to whether Meta will go lower again or attempt to gain bullish momentum off the $80 region. Should Meta come lower again, it is possible that the share price may arrive at the $58 area in the next 60-90 days
About the Three Wave Theory
The three wave theory was designed to be able to identify the exact probable price action of a financial instrument. A financial market cannot navigate its way significantly higher or lower without making waves. Waves are essentially a mismatch between buyers and sellers and print a picture of a probable direction and target for a financial instrument. When waves one and two have been formed, it is the point of higher high/lower low that gives the technical indication of the future direction. A wave one will continue from a low to a high point before it finds significant enough rejection to then form the wave two. When a third wave breaks into a higher high/lower low, the only probable numerical target bearing available on a financial chart is the equivalent of the wave one low to high point. It is highly probable that the wave three will look to numerically replicate wave one before it makes its future directional decision. It may continue past its third wave target, but it is only the wave one evidence that a price was able to continue before rejection that is available to look to as a probable target for a third wave.
Be the first to comment