

Bjorn Bakstad
On September 15th, Adobe (NASDAQ:ADBE) reported Q3 results and announced an agreement to acquire competitor Figma for $20 Billion in cash and stock. The market responded with a substantial sell-off, and analysts indicated that the deal was too expensive to make sense. This followed on the heels of a decline in the shares resulting from downgrades from Mizuho and BMO Capital Markets. The shares have climbed off of their late-September lows, largely due to reassuring management guidance on earnings for 2023 and reaffirmation of guidance for 2022. ADBE is currently trading at $300.96, 25% below the $396.36 closing price on September 12th. The shares are currently trading 56% below the 12-month-high closing price of $688.37 on November 19, 2021.
Seeking Alpha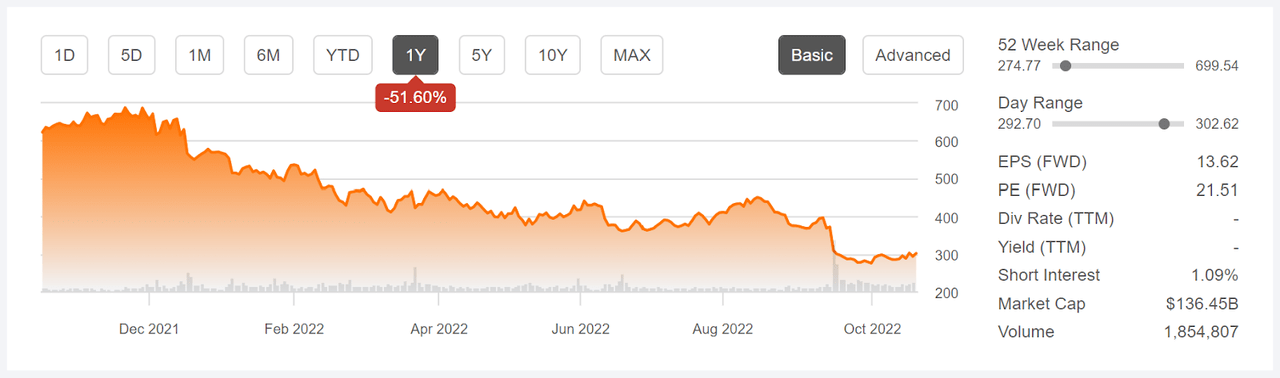
12-Month price history and basic statistics for ADBE (Source: Seeking Alpha)
The synergy of the Figma acquisition is straightforward. Figma offers a web-first collaborative design platform. Adobe is the global leader in digital design and creativity software. Adobe management has stated that Figma will continue to operate autonomously. While the market has expressed that the $20 Billion price tag for Figma is too high with the sell-off, ADBE’s market capitalization is $45 Billion below the September 12th closing price.
Looking at ADBE’s earnings, the stability of growth is notable. The company has obviously done a great job with earnings guidance, because the consensus estimates for each quarter are consistently close to the reported earnings. The consensus outlook for EPS growth over the next 3 to 5 years is 14.8% per year. Another striking feature of the earnings chart is the huge change in the share price even as earnings have climbed steadily.
ETrade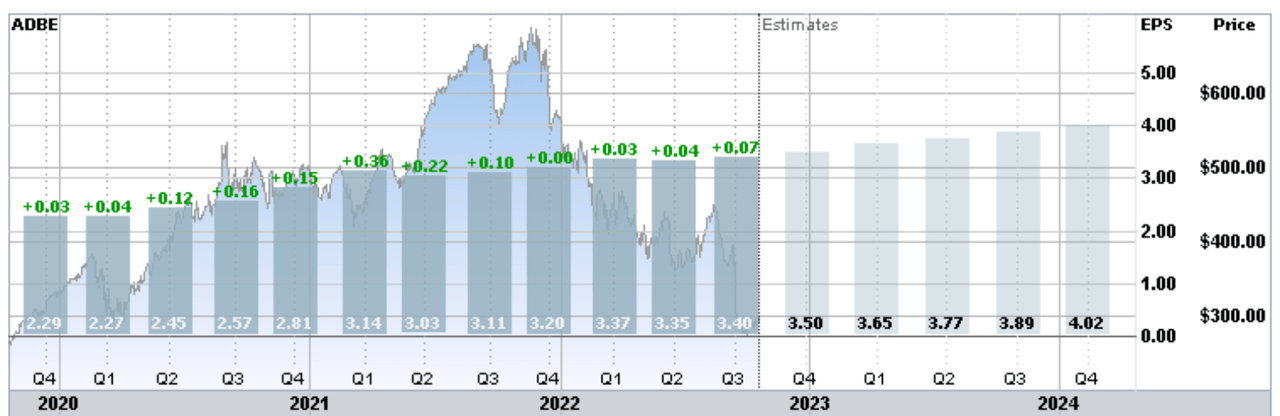
Trailing (3 years) and estimated future quarterly EPS for ADBE. Green values are amounts by which EPS beat the consensus expected value (Source: ETrade)
There are 2 factors that have exacerbated the price decline for ADBE. First, the valuation of the company depends more heavily on earnings that will be realized in the fairly distant future than on near-term results. Back when I wrote about ADBE in August 2021, with the shares trading at $652, the forward P/E was 53. Such a high P/E makes a stock particularly vulnerable to rising interest rates because the discount rate applied to future earnings goes up as interest rates rise. Rising interest rates have also bolstered the strength of the dollar, reducing the dollar value of non-U.S. earnings. The second factor is ADBE’s relatively high beta with respect to the S&P 500. The 3-year beta is 1.25, amplifying market moves. The decline of the broader equity market has had an elevated impact on ADBE.
I last wrote about ADBE on February 9, 2022, at which time I assigned a buy rating on the shares. From the closing price of $521.75 on February 9th, ADBE shares have returned -42.8% as compared to -18.9% for the S&P 500 (SPY) and -27.3% for the NASDAQ 100 (QQQ). In February, ADBE’s valuation had improved considerably as a result of the falling share price, but the shares still looked fairly expensive, with a forward P/E of 36.7. The Wall Street analyst consensus rating on ADBE was a buy, with a consensus 12-month price target that was 30% above the share price at that time. The market-implied outlook, a probabilistic price forecast that represents the consensus view among buyers and sellers of options, was slightly bullish to mid-2022 and neutral to slightly bullish to January 2023, with expected volatility of 35% (annualized). Even though the shares were still quite expensive, the bullish outlooks along with the company’s incredibly stable earnings growth and dominant market position convinced me to assign a buy rating.
For readers who are unfamiliar with the market-implied outlook, a brief explanation is needed. The price of an option on a stock is largely determined by the market’s consensus estimate of the probability that the stock price will rise above (call option) or fall below (put option) a specific level (the option strike price) between now and when the option expires. By analyzing the prices of call and put options at a range of strike prices, all with the same expiration date, it is possible to calculate a probabilistic price forecast that reconciles the options prices. This is the market-implied outlook. For a deeper explanation and background, I recommend this monograph published by the CFA Institute.
I have calculated updated market-implied outlooks for ADBE and compared these with the current Wall Street consensus outlook in revisiting my rating.
Wall Street Consensus Outlook for Adobe Stock
ETrade calculates the Wall Street consensus outlook for ADBE using price targets and ratings from 26 ranked analysts who have published their views within the past 3 months. The consensus rating is a buy, as it has been for all of the past year, and the consensus 12-month price target is 22.2% above the current share price.
ETrade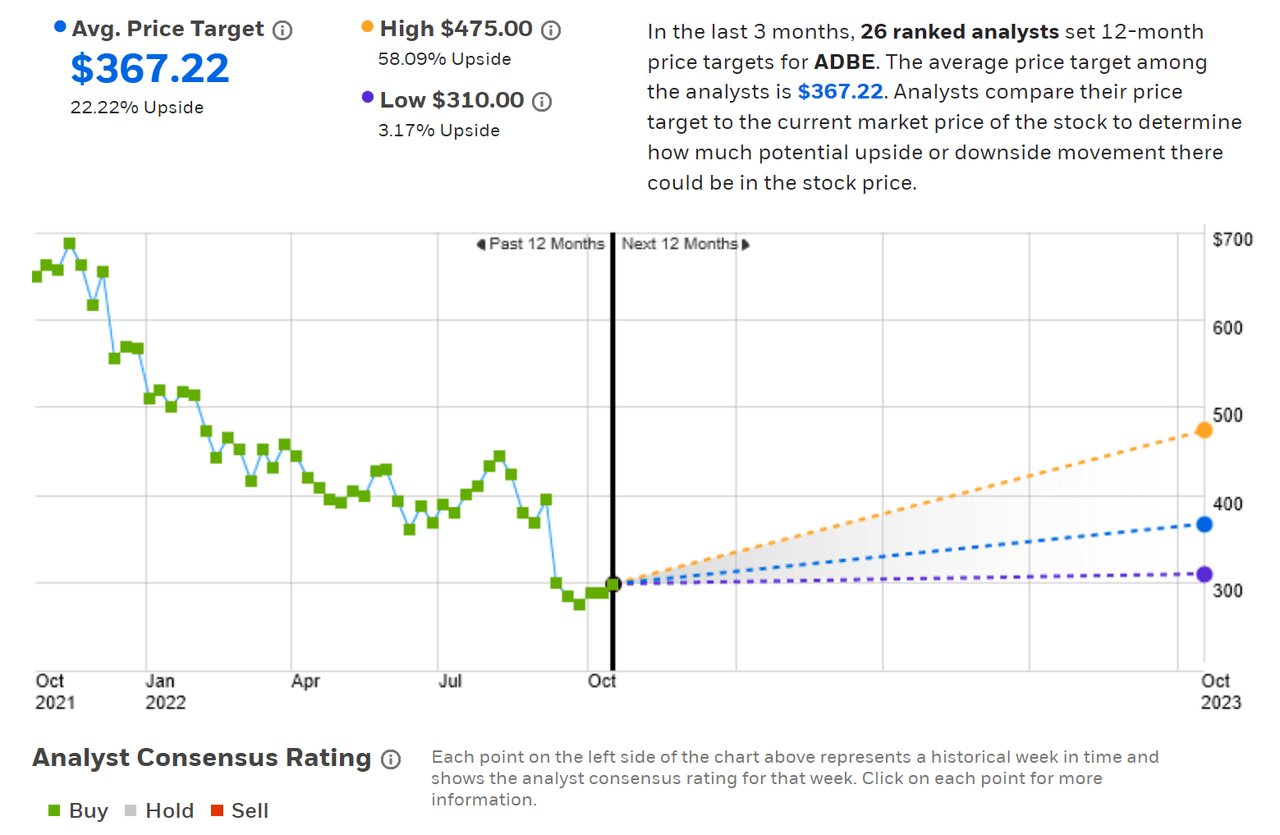
Wall Street analyst consensus rating and 12-month price target for ADBE (Source: ETrade)
Seeking Alpha’s version of the Wall Street consensus outlook is calculated by combining the views of 32 analysts who have published price targets and ratings for ADBE over the past 90 days. The consensus rating is a buy and the consensus price target is 24.0% above the current share price.
Seeking Alpha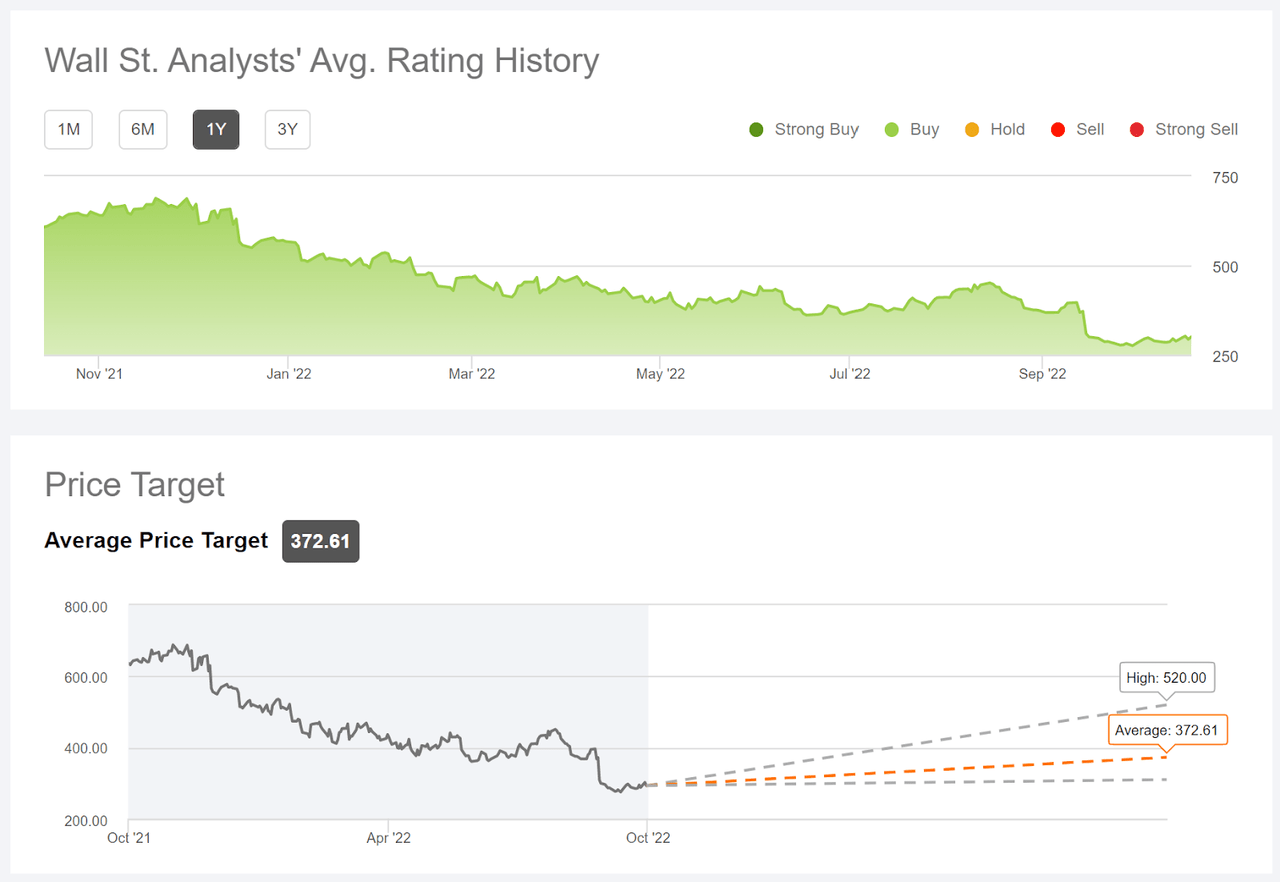
Wall Street analyst consensus rating and 12-month price target for ADBE (Source: Seeking Alpha)
Even though the consensus rating on ADBE has been bullish throughout the last year, analysts have steadily reduced the price targets as the shares declined.
Market-Implied Outlook for ADBE
I have calculated the market-implied outlook for ADBE for the 3-month period from now until January 20, 2023 and for the 7.8-month period from now until June 16, 2023, using the price of call and put options that expire on these dates. I selected these two expiration dates to provide a view through the end of 2022 and to the middle of 2023.
The standard presentation of the market-implied outlook is a probability distribution of price return, with probability on the vertical axis and return on the horizontal.
Geoff Considine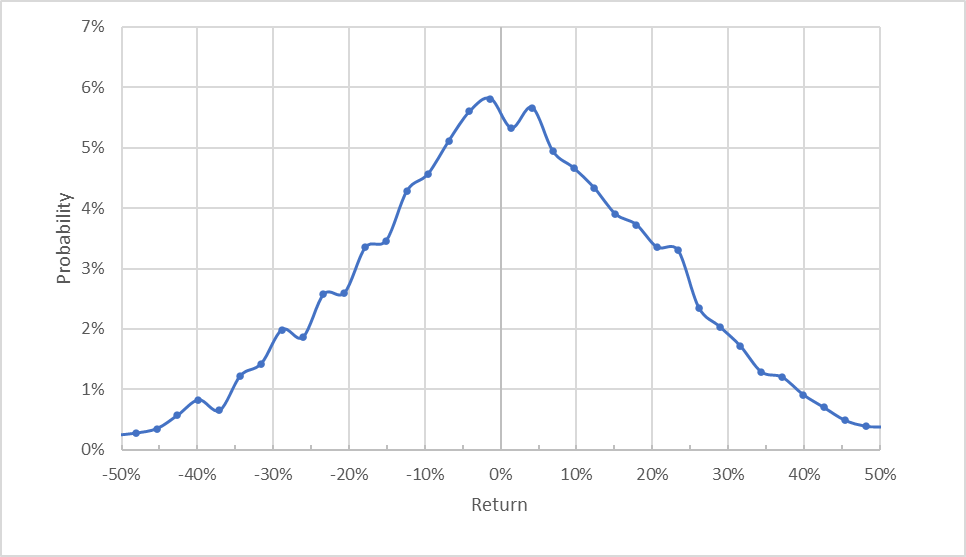
Market-implied price return probabilities for ADBE for the 3-month period from now until January 20, 2023 (Source: Author’s calculations using options quotes from ETrade)
The market-implied outlook for the next 3 months is generally symmetric, with comparable probabilities of positive and negative returns of the same size, although there is a region of elevated probabilities of positive returns (as compared to the probabilities of negative returns of the same magnitude) in the range of +15% to +25%. The expected volatility calculated from this distribution is 44.1% (annualized).
To make it easier to compare the relative probabilities of positive and negative returns, I rotate the negative return side of the distribution about the vertical axis (see chart below).
Geoff Considine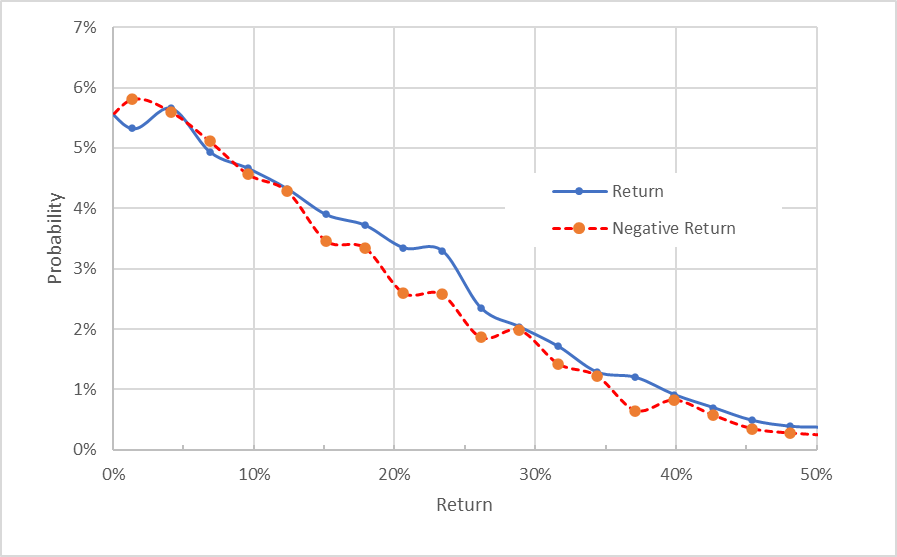
Market-implied price return probabilities for ADBE for the 3-month period from now until January 20, 2023. The negative return side of the distribution has been rotated about the vertical axis (Source: Author’s calculations using options quotes from ETrade)
This view illustrates that the probabilities of positive and negative returns are very similar (the solid blue line is close to the dashed red line), but there is a substantial range of the outcomes with higher probabilities for positive returns. This is a slightly bullish outlook.
Theory indicates that the market-implied outlook is expected to have a negative bias because investors, in aggregate, are risk averse and thus tend to pay more than fair value for downside protection. There is no way to measure the magnitude of this bias, or whether it is even present, however. The expectation of a negative bias reinforces the bullish interpretation of this outlook.
The market-implied outlook for the next 7.8 months is qualitatively similar to the shorter-term outlook, with a consistent minor tilt favoring positive returns. The expected volatility calculated from this distribution is 42.1%.
Geoff Considine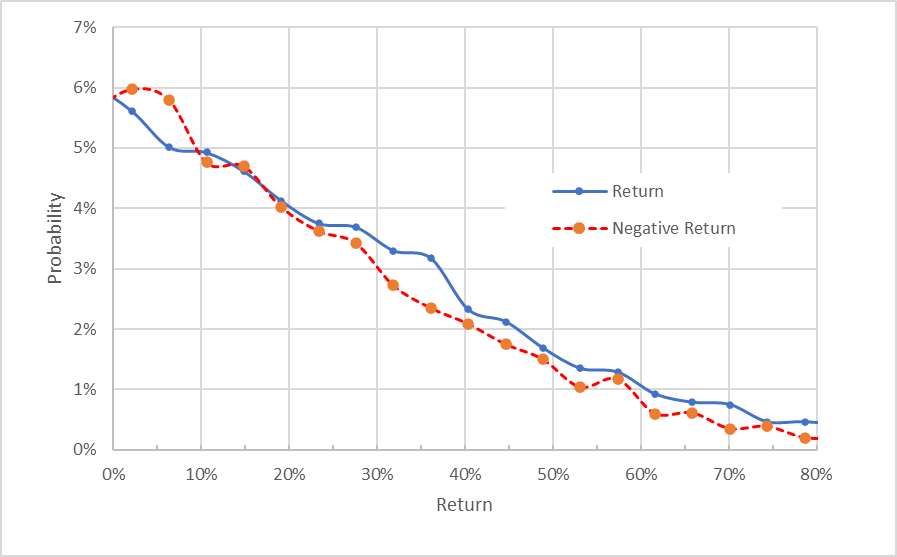
Market-implied price return probabilities for ADBE for the 7.8-month period from now until June 16, 2023. The negative return side of the distribution has been rotated about the vertical axis (Source: Author’s calculations using options quotes from ETrade)
The market-implied outlooks for ADBE are slightly bullish, with expected volatility of 42% to 44%. The market-implied outlooks back in February were also slightly bullish, but the expected volatility was slightly lower.
Summary
ADBE shareholders have taken a drubbing so far in 2022, as rising interest rates have hit growth stocks hard. ADBE was also priced at a substantial premium late in 2021. The magnitude of the recent decline in the shares following the announcement of the planned acquisition of Figma is harder to understand. Adobe is the dominant market leader in creative design software, not to mention broader e-signature and document management. The current sell-off seems overdone, such that ADBE has a forward P/E of 21.5. If interest rates continue to rise, however, the estimated net present value of projected earnings will continue to decline, even if the company can continue its steady earnings growth trajectory. The Wall Street consensus rating continues to be a buy, and the 12-month price target is about 23% above the current share price. As a rule of thumb for a buy rating, I want to see an expected 12-month return that is at least ½ the expected volatility (42%-44%). Taking the Wall Street consensus at face value, ADBE is slightly above this threshold. The market-implied outlooks for ADBE are slightly bullish to early- and mid-2022. I am maintaining a buy rating on ADBE.
Be the first to comment