

CHUNYIP WONG/E+ via Getty Images
[Please note that this article is based on Trading Alerts (“TA”) that were issued for Wheel of Fortune subscribers on Jan. 31st and Feb. 1st. Some of the data has been adjusted for the purpose/presentation of this article.]
The “Arbor Real(beau)ty”
What do you need to know about Arbor Realty Trust, 6.25% Series F (ABR.PF) aside from the normal-common features (Cumulative, Redeemable, Par = $25)?
- Fix-to-Float structure: 6.25% fixed rate per annum ($1.5625 per annum or $0.390625 per quarter) until 10/30/2026 (call date); then after, dividends will be paid at a floating rate based on the Three-Month SOFR plus a spread of 5.442% per annum.
- Rate floor/protection: In no event shall the Floating Rate be lower than 6.125% per annum.
QuantumOnline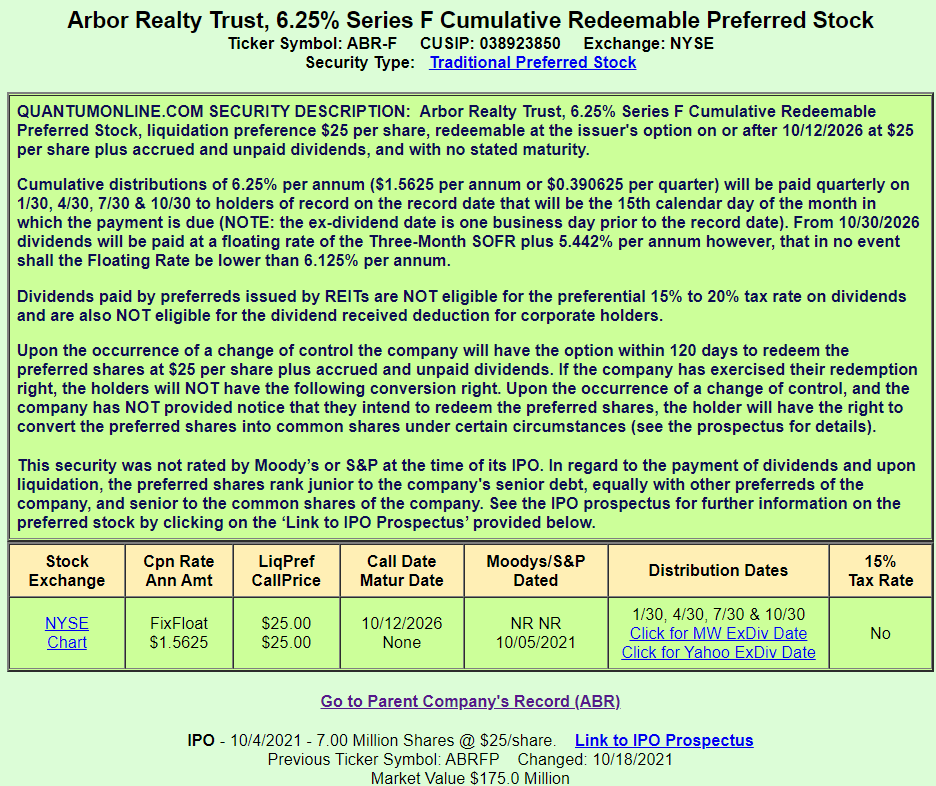
Basic terms of all ABR existing series:
| Series | IPO | Shares* | Type | Cumulative | Coupon | Floor Protection? | Call date | Spread** |
| ABR.PD | 5/25/2021 | 9.20 | Fixed | Yes | 6.375% | N/A | 6/2/2026 | N/A |
| ABR.PE | 8/4/2021 | 5.75 | Fixed | Yes | 6.250% | N/A | 8/11/2026 | N/A |
| ABR.PF | 10/4/2021 | 8.05 | F-t-F | Yes | 6.250% | 6.125% | 10/12/2026 | 5.442% |
Distribution Dates (for all series) are 1/30, 4/30, 7/30 & 10/30
*Outstanding (Underwriters exercised their 15% over-allotment option in all issues); **over 3-month SOFR
Current trading parameters:
| Series | Cur. Price | Cur. Yield | YTC | Next Ex-Date | Quarterly Dividend | Strip Yield | Fwd Yield*** | Total NV |
| D | 24.75 | 6.439% | 6.639% | 4/15/2022 | $0.3984375 | 6.355% | 6.439% | 230.00 |
| E | 24.56 | 6.362% | 6.698% | 4/15/2022 | $0.3906250 | 6.280% | 6.362% | 143.75 |
| F | 24.28 | 6.435% | 6.963% | 4/15/2022 | $0.3906250 | 6.351% | 6.125% | 201.25 |
***Assuming that the Call Date is today
WTF = We Trade (Series) F
When comparing series F to the two other outstanding series (D & E), we conclude that:
- The 3 series are (nearly) equal when it comes to coupons, call dates, current yields, and strip yields; all minor differences.
- The main difference is the structure (fixed vs fix-to-float) and the floor protection which essentially is a key advantage of series F.
- ABR-F is currently offering a YTC which is 30bps+ higher than the other 2 series. Its current and strip yields are at par with series D.
- The main (and only) feature where series F lags is the forward yield. Nonetheless, this calculation of that yield assumes that the call cate is today. Obviously, nobody is in position today to know what would be the 3-month SOFR (currently at 0.201560%) in mid-late 2026. Therefore, we find this “disadvantage” to be something of (complete) insignificance, at least right now, ~4.5 years ahead of the actual call date/s.
- Series F is only the 2nd largest, in terms of size, but frankly, a preferred of over $100M should be (and is) very liquid. For reference, think of us analyzing (though not yet buying a new preferred like MTBCO with a size of only $25M. As a matter of fact, all ABR’s series are sizable and liquid, and we see no problem here whatsoever.
Furthermore, if we think of mid-late 2026, and while we have no idea what rates will look like then, our logic works like this:
- If 3-month SOFR is (equal or) smaller than 0.683%, coupon on ABR-F would be the floor (6.125%), because 5.442% (spread) + <0.683% (3-month SOFR) would be lower than (thus activate) the floor. Meanwhile series D & F will keep paying 6.375% and 6.250%, respectively (so not a major difference, either way).
- If 3-month SOFR is greater than 0.683%, coupon on ABR-F would anyhow be higher than the floor (6.125%) = 5.442% (spread) + >0.683% (3-month SOFR). Meanwhile series D & F will keep paying 6.375% and 6.250%, respectively (so not a major difference, either way).
- If and when 3-month SOFR is greater than 0.933% or 0.808%, series F’s coupon would pay a higher coupon than both series D and F. The higher the 3-month SOFR above these thresholds – the more attractive series F will be compared to its competitor series.
Again, we have no idea where will the 3-month SOFR be around mid-late 2026, but all indications suggest that a year from now the 3-month SOFR supposed to be higher than these thresholds, assuming that the Fed hike rates 4-5 times by then.
On Jan. 31, we issued the following TA:
BUY ABR.PF* @ $24.21
Risk Rating: 2.5 >>> Maximum** Allocation: 6%
We’re taking advantage of the recent price drop, with the preferred now trading >3% below par, and >5% below its peak price.
Seeking Alpha
The following day, on Feb. 1, as the preferred share continued its slide, we issued the following TA:
BUY ABR.PF* @ $24.00
Risk Rating: 2.5 >>> Maximum** Allocation: 6%
We’re buying more today at a pre-placed limit order at $24.00.
Next stop (add-on): $23.79.
These footnotes were relevant to the TAs on both days:
*Note that your broker may have a different symbol for Arbor Realty Trust, 6.25% Series F Cumulative Redeemable Preferred Stock (ABR.PF), e.g. ABR-F, ABR-PF, ABR-PRF, ABR.F, ABR.PRF, ABR/F, ABR/PF, ABR/PRF, ABRpF, ABRprF; **Doesn’t equate suggested!
Keep in Mind
The reason for today’s weakness – actually for the ongoing weakness since this series was issued 4 months ago (on Oct. 4, 2021) is that Treasury yields keep moving up, and that requires fixed-rate instruments to adjust, i.e price going down to cater for a higher yield.
Of course, the impact on a short-duration instrument such as ABR.PF – floating rate starts on Oct. 12, 2026 (call date) – is relatively small, but if you look at the past 4 months, you may understand why this preferred share is now trading 4% below par.
That’s especially true when you look at the 3- (and to a lesser extent 5-) year US Treasury yields (most relevant to ABR.PF’s tenor/duration) that have gone bananas, up nearly one full percentage point!
Y-Charts
*** Added the below after trading ended ***
Pay attention to the last two days, trading volume wise.
Here’s a list of the most active trading days since ABR.PF started trading:
Seeking Alpha, Author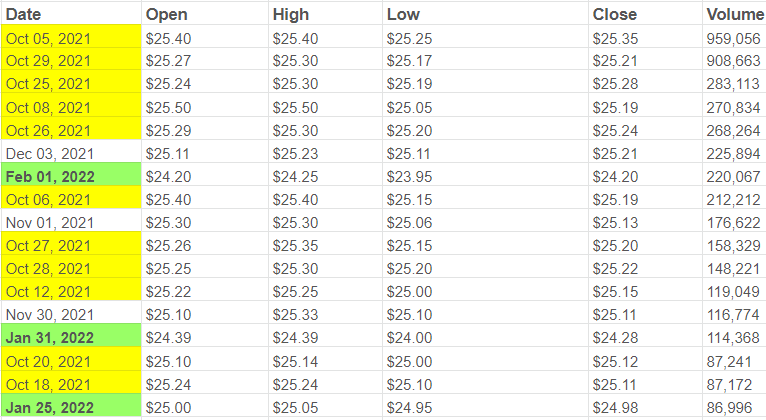
If we eliminate the month of October (first month of trading usually means elevated volumes), we’re left with only 6 days, out of which 3 fall inside the last week.
Average daily volume along the entire period (inc. today) is 67,535 shares.
Apparently, we’re not alone liking ABR.PF this week, around these “24-something” levels.
The “Arbor Real(i)ty”
Let’s take this opportunity to also take a look at the common stock, Arbor Realty Trust Inc (ABR), which we hold (appears on TAD) as a result of debt conversion in May 2021 (of ABR 4.75% 1-Nov-2022, 144A, Senior Unsecured, Convertible debt to common stock at a price of $17.80).
When it comes to its real estate activity, ABR is a “hybrid REIT” that has operating features that match both an equity REIT (where FFO or AFFO, thus P/FFO or P/AFFO, are the main financial metrics) and a mortgage REIT (where EPS and P/E ratio are the main financial metrics). Nonetheless, the company fits the latter (mortgage REIT) way more than the former (equity REIT), therefore it’s more appropriate to classify, surely measure, ABR against mortgage REITs.
Btw, this isn’t the first time that we’re holding the stock, however we parted ways with ABR long ago, in early 2019 (indeed, way too early) as a result of COVERED CALL that got assigned.
Why do we say “way too early”? Because of this:
Y-Charts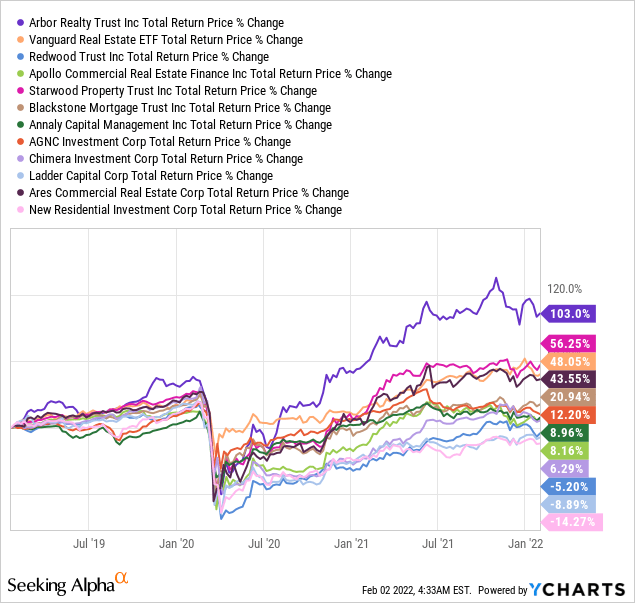
If you examine ABR vs. a peer group of mortgage REITs you risk missing the forest for the trees.
Sure thing, both its forward P/E ratio, as well as dividend yield (see below), make ABR looks attractive; no doubt about that. Nevertheless, it may seem as if there’s nothing out of the ordinary about this company, that is offering, more or less, the average (valuation and yield) of what investors can get out of this peer group.
Y-Charts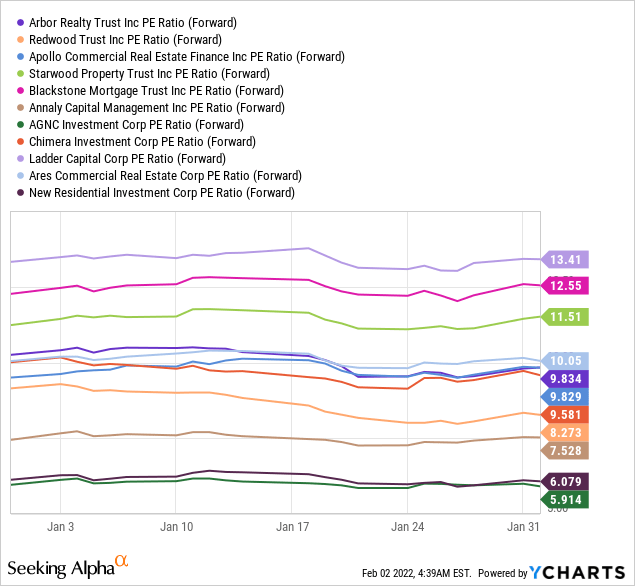
Even if we use FFO – which, again, is not an ideal financial metric for ABR (or mortgage REITs in general) – ABR would come on top of its peer group, posting the 2nd-best TTM FFO growth over the past 5 years.
Y-Charts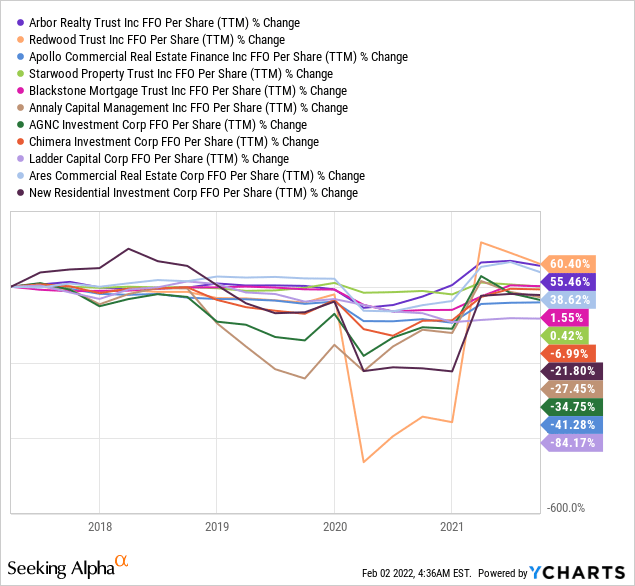
Why do we fear you might be missing the forest for the trees, then?
Because ABR is one of the most impressive REITs in recent years, and that goes to REIT-land as a whole, i.e. when we include both mortgage and equity REITs.
As a matter of fact, it’s probably one of, if not the REIT that has returned the most over the past 12-13 years…
[Note that we also include some of the biggest, most respectful, equity REITs in the below chart; yet, none of those comes close to what ABR has returned]
Y-Charts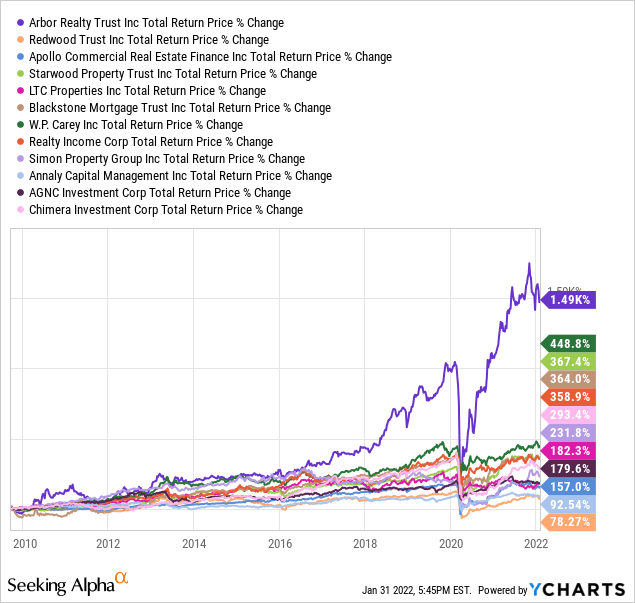
… as well as over the past 5 years.
[Note that we also include some of the biggest, most respectful, equity REITs in the below chart; yet, none of those comes close to what ABR has returned]
Y-Charts Y-Charts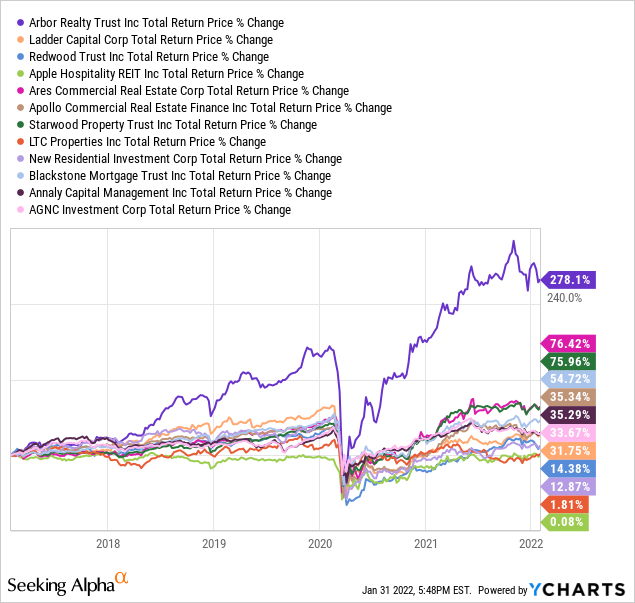
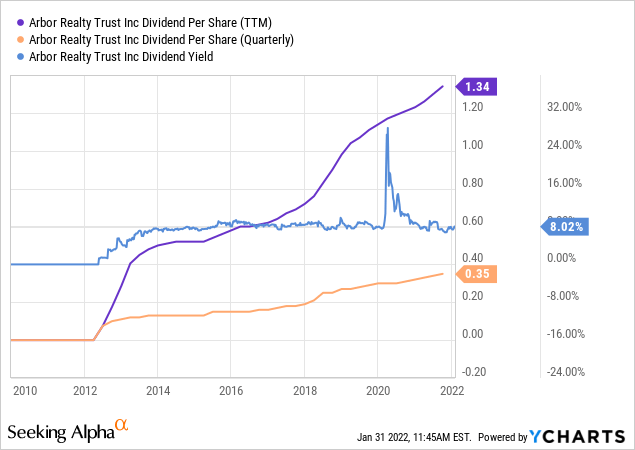
The current forward dividend yield is ~8.23%, based on the last declared (on Oct. 29. 2021) $0.36/share quarterly dividend (which was another 2.9% increase from prior dividend of $0.35; the last increase out of a very long series of dividend increases).
Seeking Alpha
We’re Bullish on ABR but…
We’re practically trading where the short-term support line is, however if the current/recent market turmoil continues, we may see ABR sliding to its long/er-term support line, ~$15.50 (It starts at about 10% lower than current market price).
Y-Charts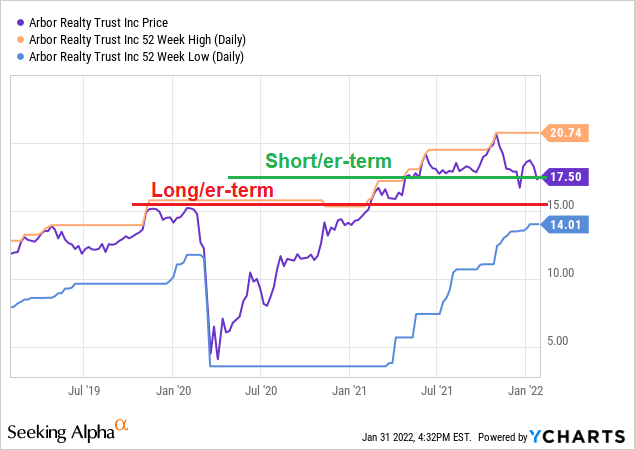
Another factor that prevents us from buying ABR right now, in-spite of the stock looking cheap following a 22.3% drawdown (from a 52-week high of $20.74 to as low as $16.11 on Jan 24, 2022), is the below chart.
Based on the long-term channel, ABR is trading, more or less, at the upper-band of this channel, suggesting that there’s limited upside from here.
Y-Charts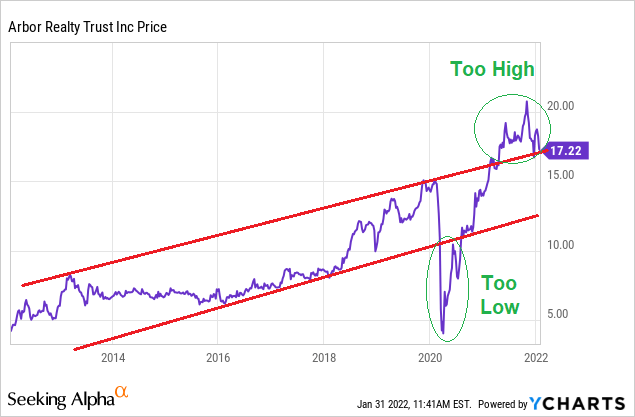
All in all, we really like the stock, but we would employ patience before we buy more, while hoping for a better price to present itself down the road.
Both ABR and (surely) ABR.PF get a BUY rating from us, right here and right now. Nonetheless, we are only rushing into the latter, while employing patience with the former.
After all, we’ve waited 3 years since we sold the stock (or 2.3 years, if we count till the bond conversion into equity time-frame), so we can afford waiting a little bit longer, letting the common faces “real(i)ty” while the preferred functions as our “harbor”.
Be the first to comment