

da-kuk
The main selling point of the Aberdeen Total Dynamic Dividend Fund (NYSE:AOD) is its generous monthly distribution, currently set at $0.0575 / month or 8.7% current yield. The distribution looks a little too high, as it has historically been partially funded by return of capital (“ROC”). Over the long term, ROC decreases the fund’s income earning NAV, which makes future distributions even more unsustainable.
Personally, I prefer the more sustainable distribution model of Tri-Continental Corporation (TY), which pays a base quarterly distribution of ~4%, but rewards investors with special distributions in good years. Investors in TY earn both capital appreciation and high distribution yields.
Fund Overview
The Aberdeen Total Dynamic Dividend Fund (AOD) is a close-end fund (“CEF”) that seeks to provide a high level of current dividend income, with a secondary objective of capital appreciation. The AOD fund has approximately $900 million in assets as of October 31, 2022.
Strategy
The AOD fund focuses on the dividend factor to select securities for its portfolio. It fund invests across the globe and may invest up to 25% of assets in emerging market securities.
Portfolio Holdings
The AOD fund’s sector allocation as of October 31, 2022 is shown in Figure 1. There isn’t a discernable sector tilt to the fund’s holdings relative to the benchmark of Global Large-Stock Blend funds, except for an underweight in industrials of 8.7% vs. 14.3% for the category.
Figure 1 – AOD sector allocation (morningstar.com)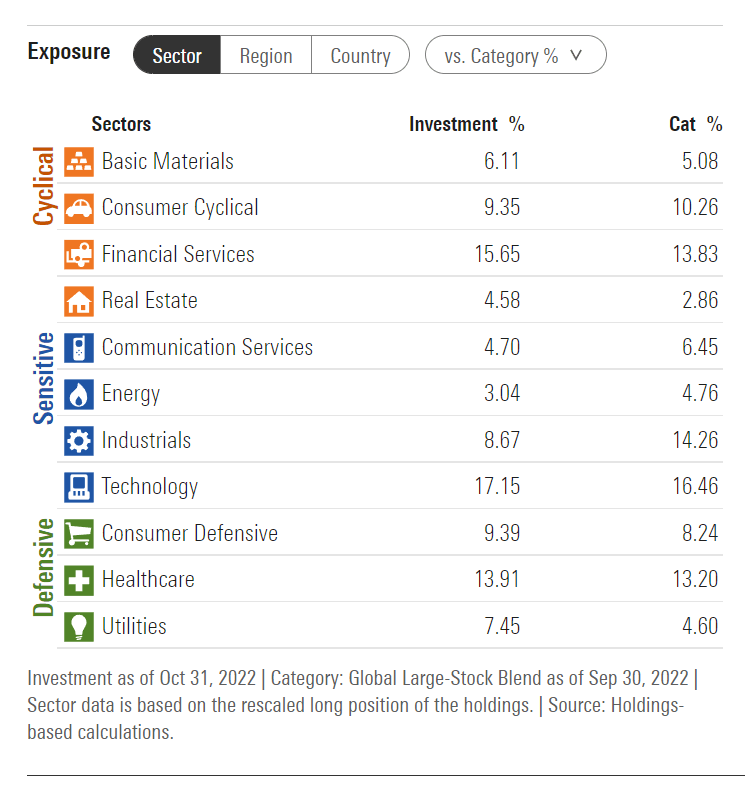
The fund’s top 10 holdings are shown in Figure 2 and account for 18.5% of the fund’s assets. In total, the fund has 85 positions as of October 31, 2022.
Figure 2 – AOD top 10 holdings (morningstar.com)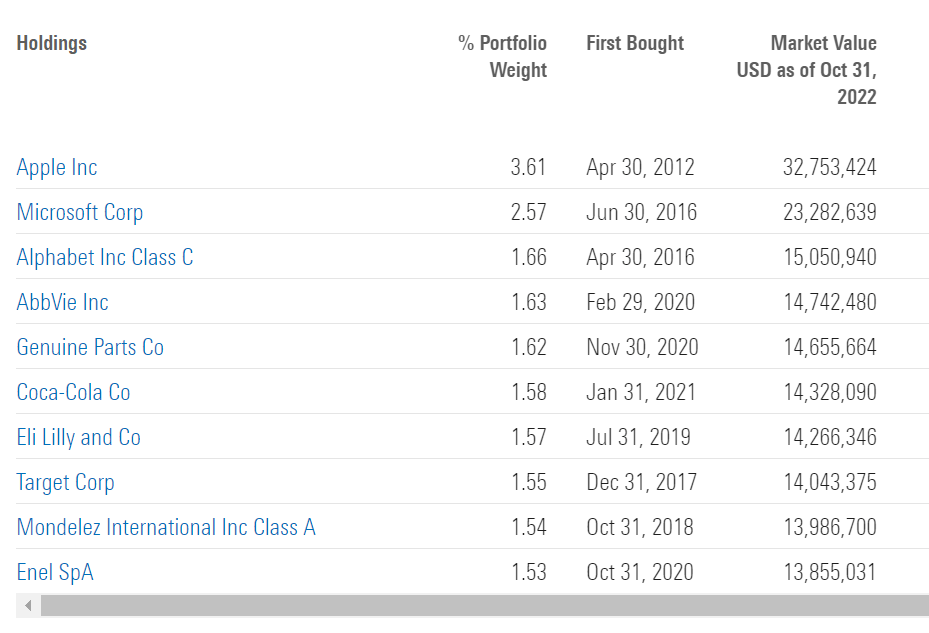
True to the strategy, the fund is broadly invested across the world, with U.S. stocks only accounting for 58.9% of the fund’s assets as of September 30, 2022.
Figure 3 – AOD country allocation (abrdnaod.com)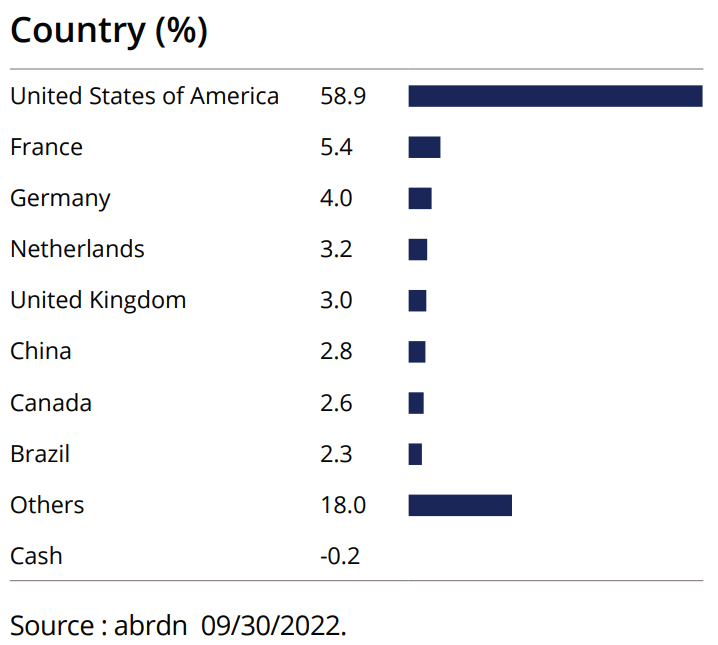
Returns
The AOD fund has had modest, if unspectacular returns. YTD to October 31, 2022, the fund has declined 18.0% on a NAV basis. It has 3/5/10 Yr total returns of 3.6%/4.3%/6.8% respectively (Figure 4).
Figure 4 – AOD fund returns (morningstar.com)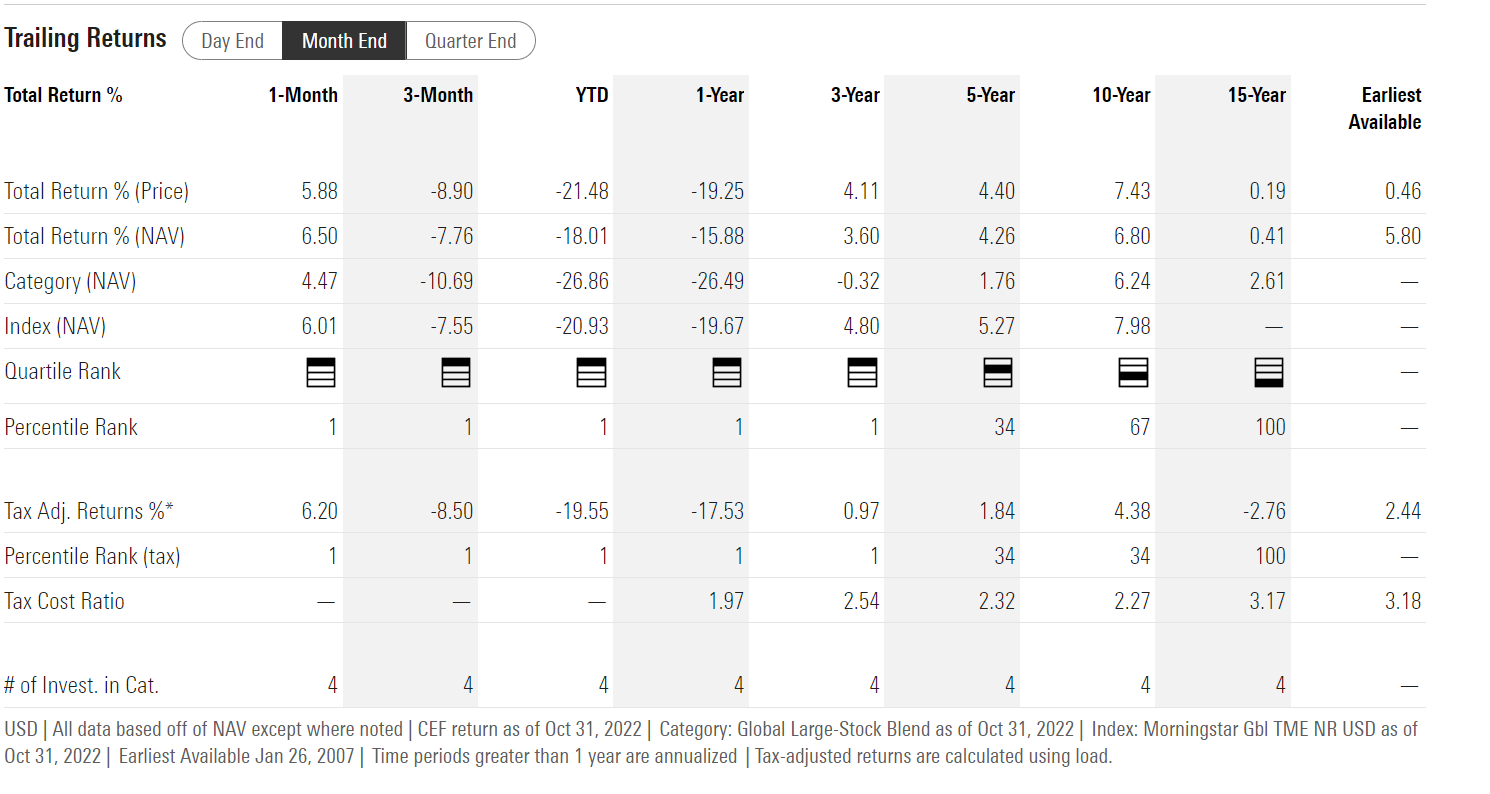
On the same timeframes, the iShares MSCI World ETF (URTH) has YTD/3/5/10Yr total returns of -20.0%/6.3%/6.6%/9.2% (Figure 5). So the AOD fund has underperformed a low-cost global equity ETF by approximately ~2.5% p.a. on a long-term basis.
Figure 5 – URTH ETF returns (morningstar.com)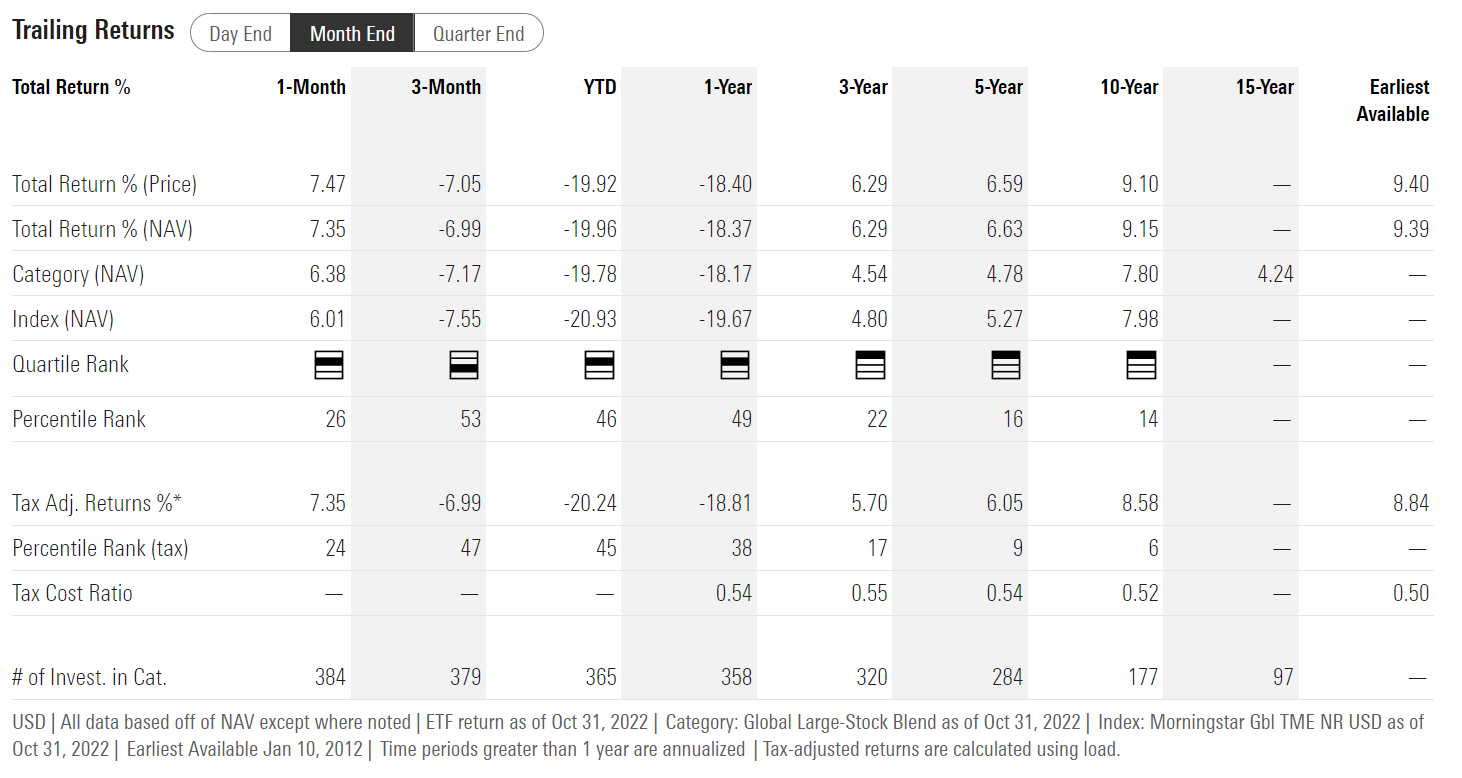
Distribution & Yield
The AOD fund pays a high distribution, currently set at $0.69 / year or 8.7% current yield. On NAV, the distribution rate is 8.1%. The distribution is paid monthly and has been kept at the current $0.0575 / month rate since 2015.
AOD’s distribution has historically been funded through a mixture of net investment income (“NII”) and ROC. 9% of the 2021 distribution was funded from ROC (Figure 6), and 8.5% of the 2020 distribution was funded from ROC.
Figure 6 – AOD 2021 distribution source (AOD 2021 Form 8937)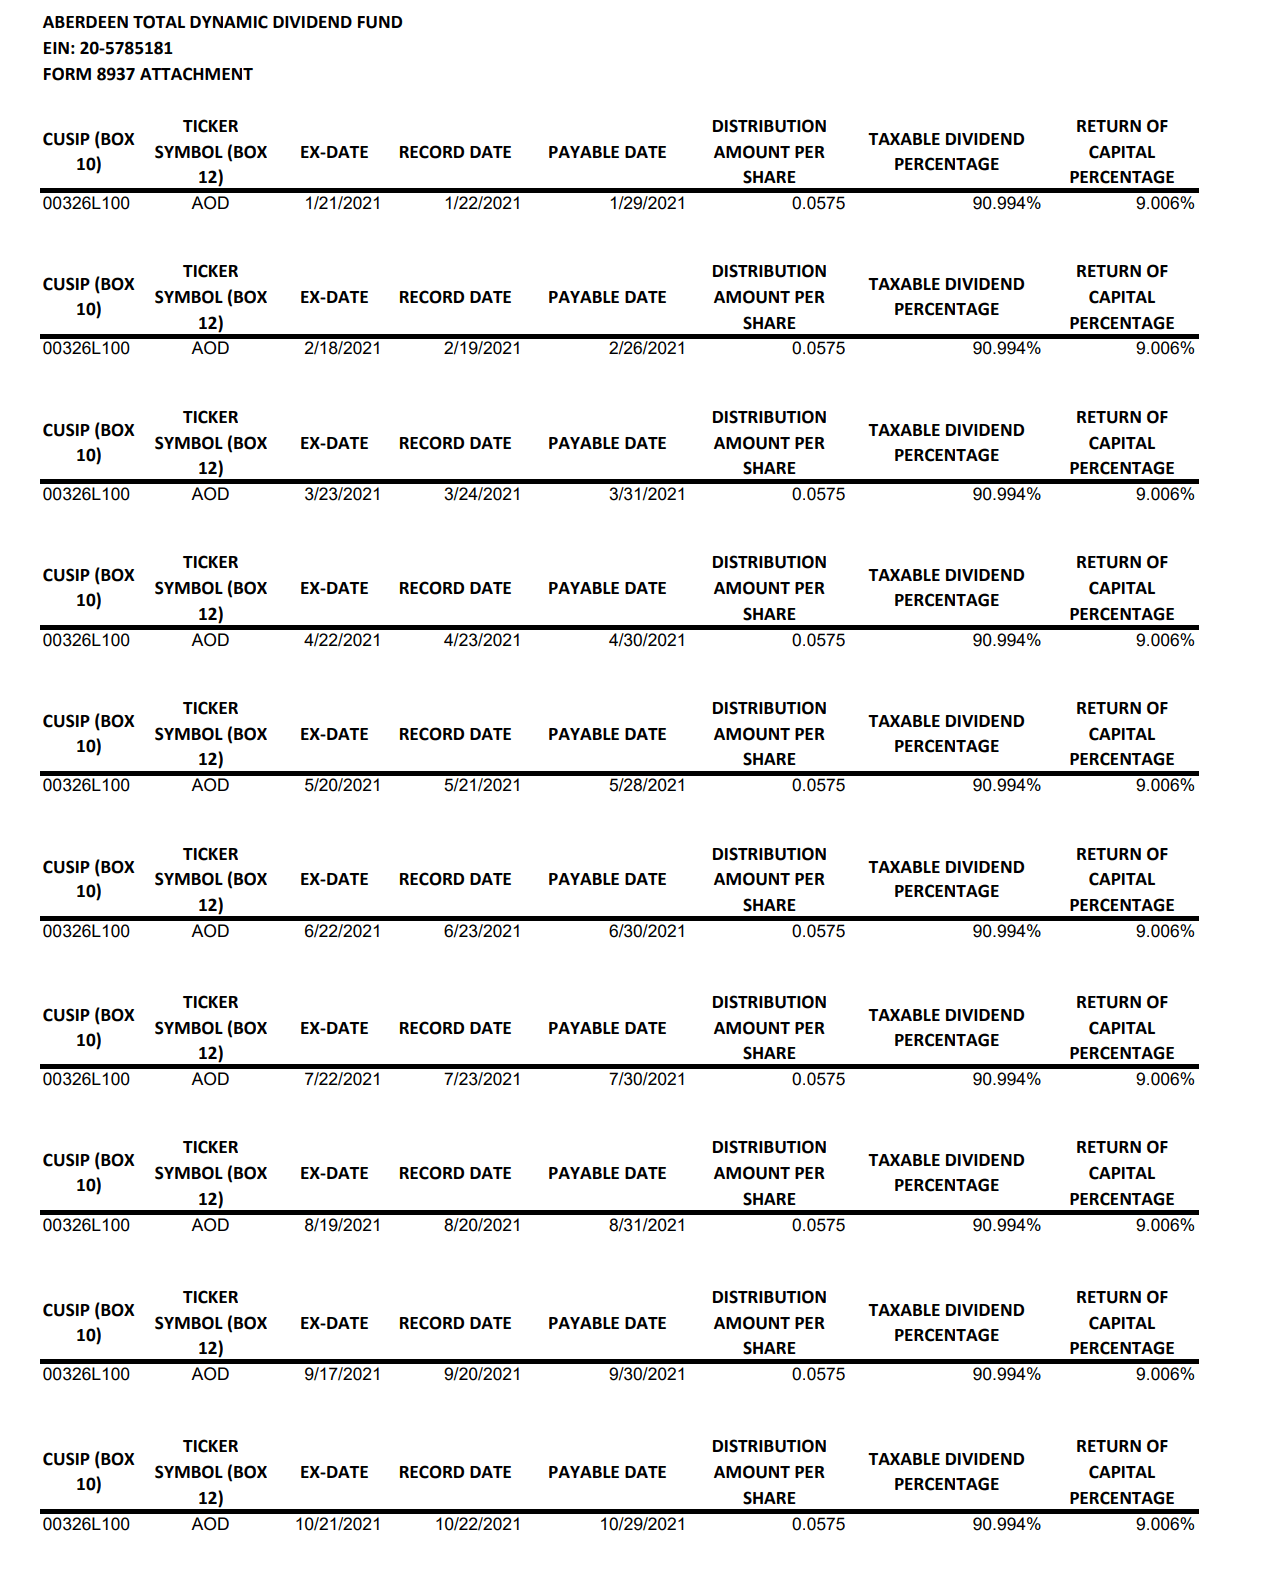
So far in fiscal year 2022, the AOD fund has estimated that 100% of the distribution has been funded by NII (Figure 7). However, this could change by the time the 8937 tax forms are issued.
Figure 7 – AOD 2022 distribution source (AOD October 2022 section 19 notice)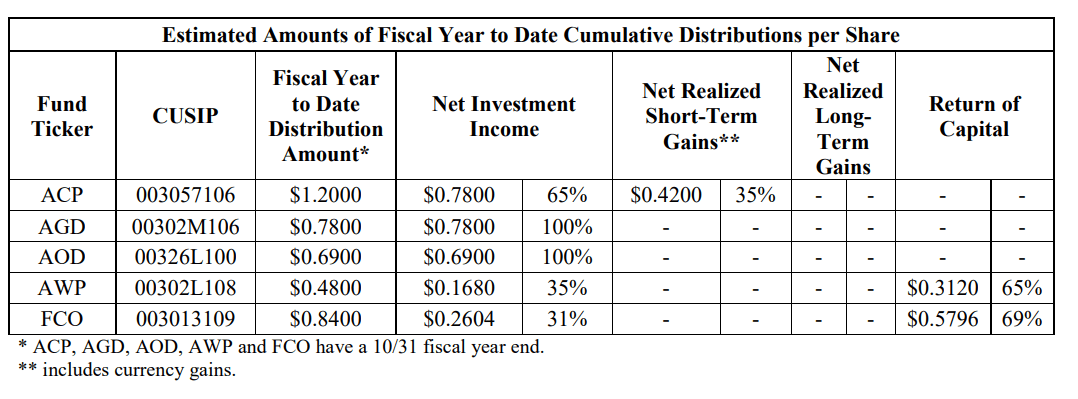
Fees
The AOD fund charges a relatively high 1.2% expense ratio. For context, the URTH ETF charges an expense ratio of 0.24%.
AOD Trades At A Discount
Despite the high distribution yield, the AOD fund has not gotten investor support and has been trading at an 8-15% discount for the past few years (Figure 8). Recently, the discount was 12.8% as of November 10, 2022.
Figure 8 – AOD fund trades at a discount (cefconnect.com)
AOD vs. TY – There Is No Contest
While AOD’s 8.7% current distribution yield (8.1% on NAV) looks attractive, I am concerned that the yield is above the fund’s long-term rate of total returns. What this implies is that in most years, the AOD fund will be funding the distribution payout with ROC that will reduce the amount of income earning assets for future years. Over the long run, this becomes unsustainable.
I have recently written an article highlighting the much more sustainable distribution model of the Tri-Continental Corporation. In contrast to the AOD fund, Tri-Continental pays a base quarterly distribution yield of approximately 4%. TY’s distribution is sustainable as the fund has 5 and 10 Yr average total returns of 9.4% and 11.5% respectively, to October 31, 2022 (Figure 9).
Figure 9 – TY fund returns (columbiathreadneedleus.com)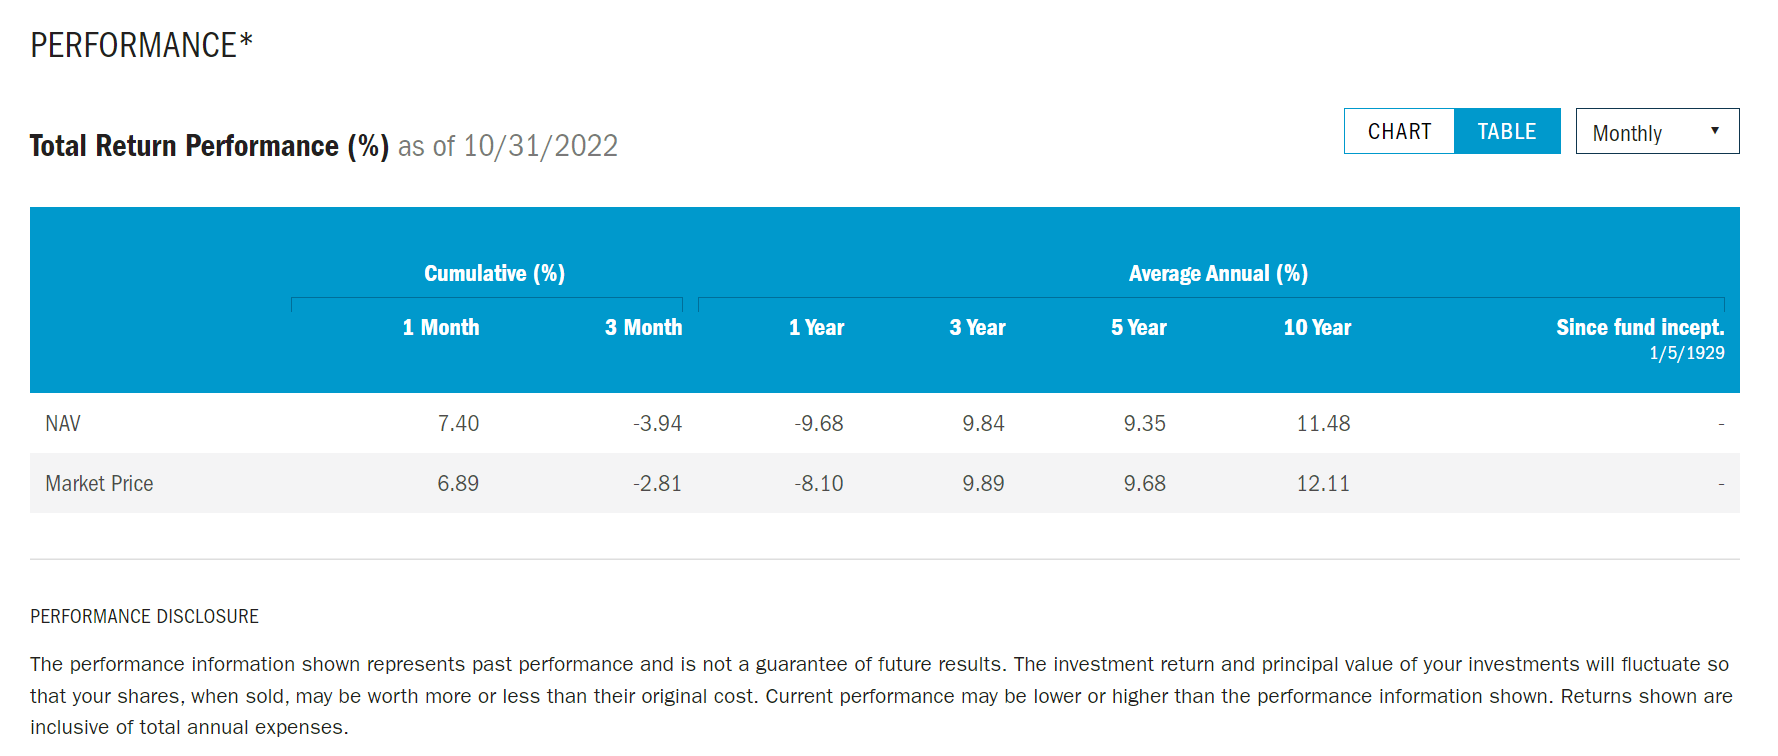
In good years, TY rewards investors with special distributions that could range as high as $4.69 / share in 2021 (17% current yield). However, the fund is not forced to pay unsustainably high distributions that negatively impact income earning assets.
Using Portfolio Visualizer to compare AOD vs. TY, there really is no contest. In the period analyzed (February 2007 to October 2022), AOD has a return CAGR of 0.3% vs. 7.4% for TY. AOD also have much higher volatility with Stdev of 22.9% vs. 17.2% for TY (Figure 10).
Figure 10 – TY outperforms AOD (Author created with Portfolio Visualizer)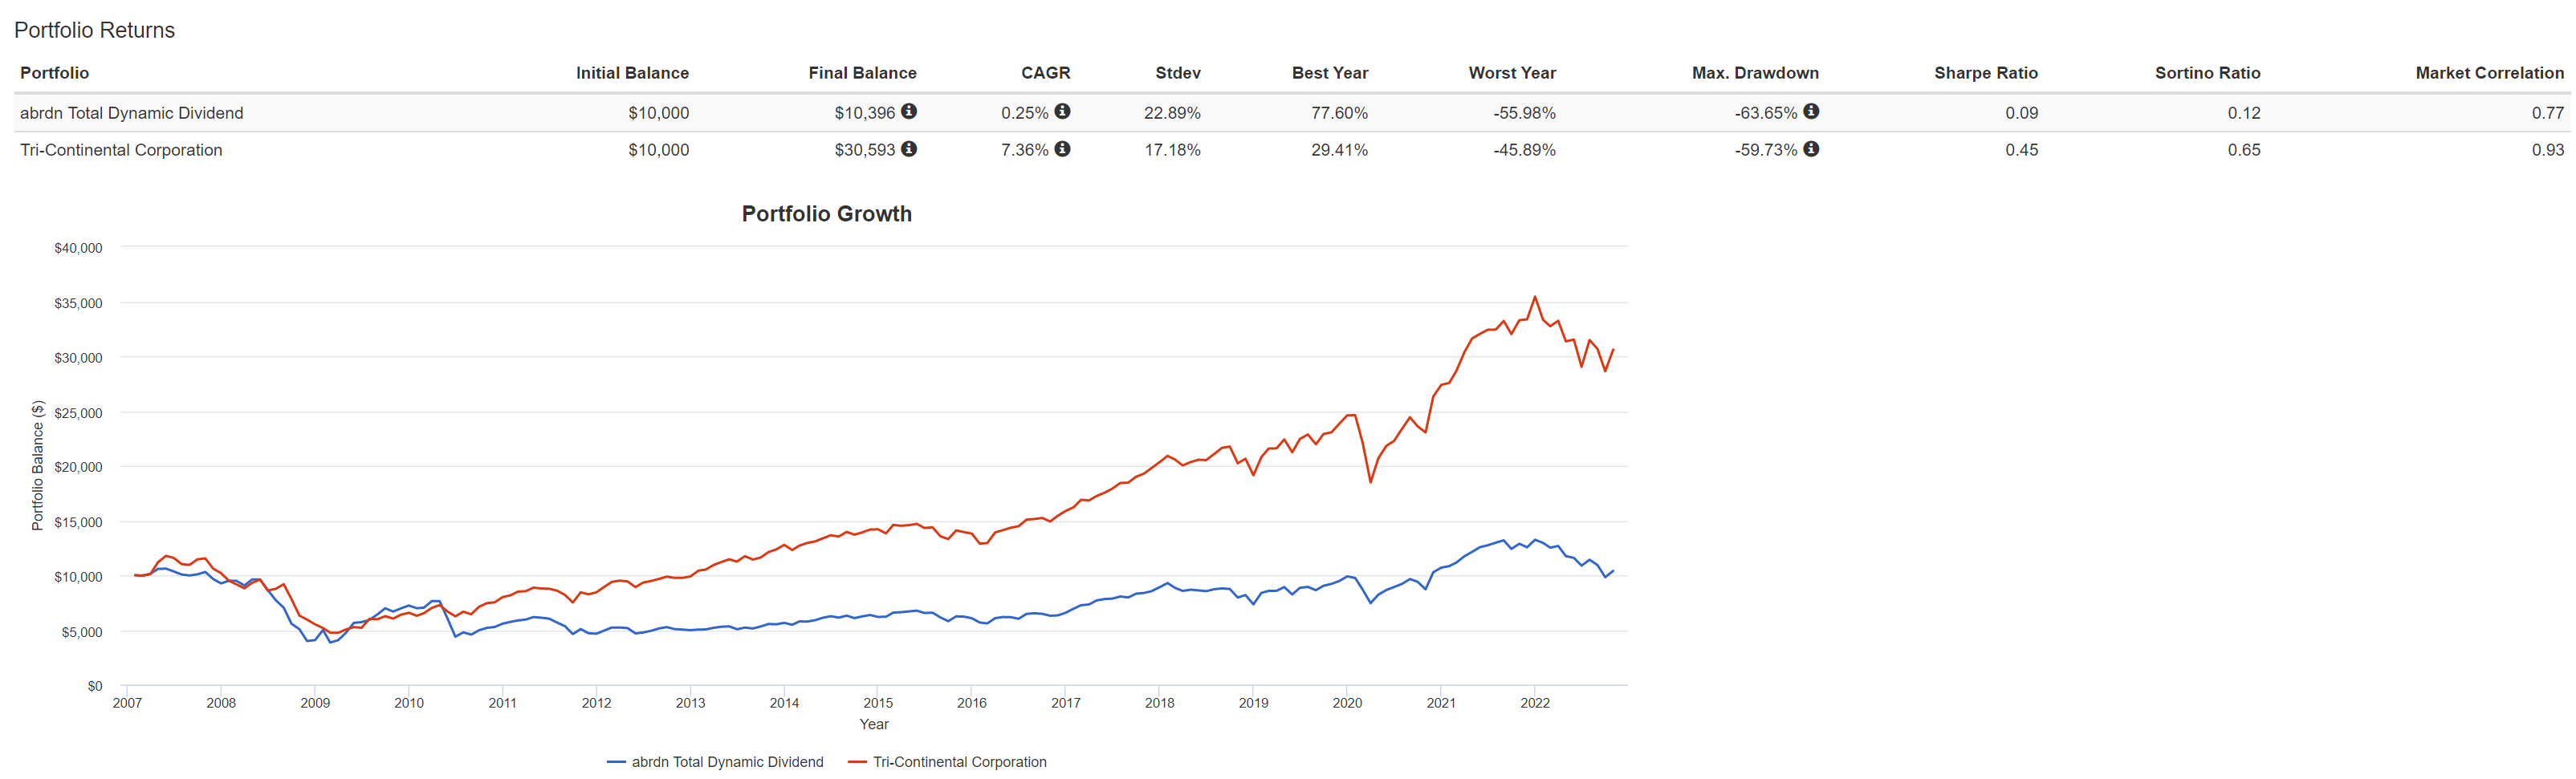
Conclusion
The main selling point of the Aberdeen Total Dynamic Dividend Fund is its generous monthly distribution, currently set at $0.0575 / month for 8.7% current yield. The distribution looks too high, as it has historically been funded partially by return of capital. Over the long term, this could become an issue as overpaying on the distribution will decrease the fund’s NAV, which makes future distributions even more unsustainable.
In terms of total returns, the AOD fund has generated modest, if unspectacular average annual returns that have lagged the URTH ETF by approximately 2.5% per year.
Personally, I prefer the more sustainable model of Tri-Continental Corporation, which pays a base quarterly distribution of ~4%, but rewards investors with special distributions in good years.
Be the first to comment