

Not Panicking But Not Pretending Either
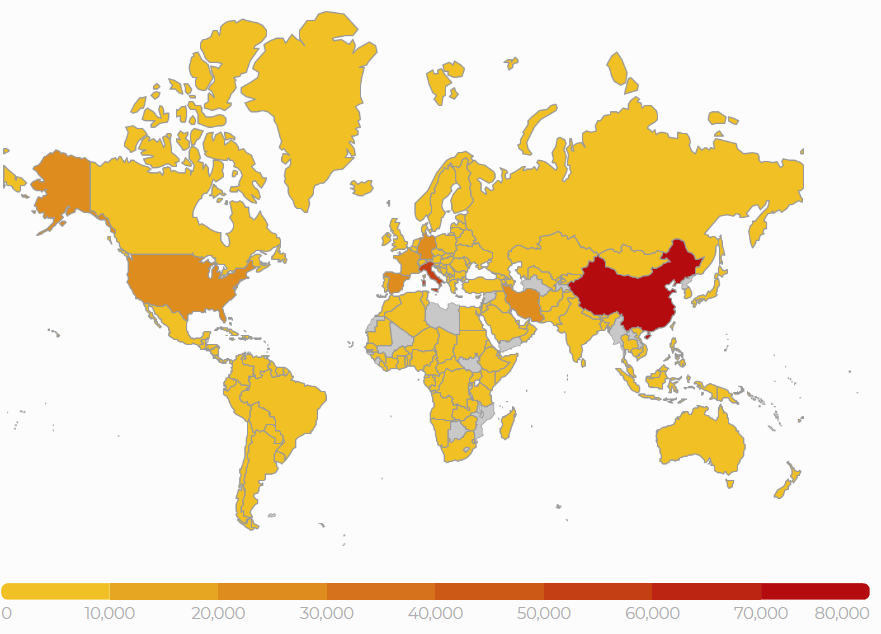
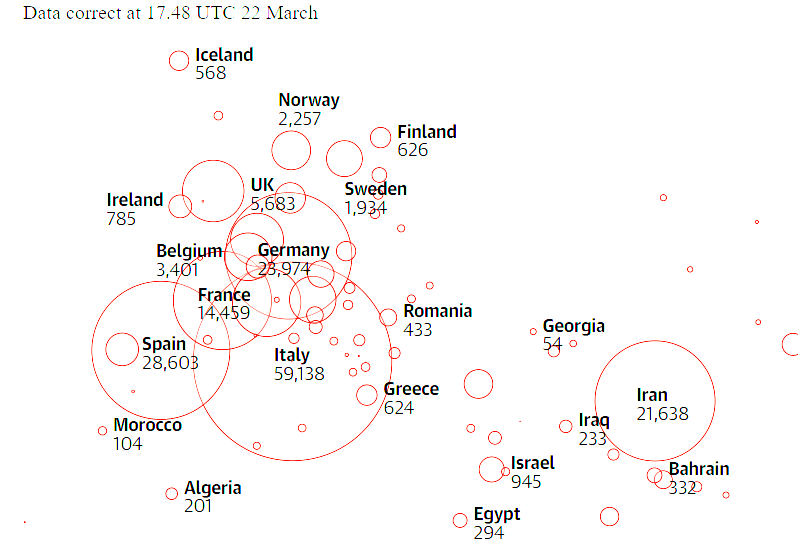
Source: Local governments/Johns Hopkins University. Last update: March 21, 2020
We don’t need to remind anyone that global governments have thrown spears through the hearts of their respective economies. The driver of this behavior is the spread of the coronavirus shown above (infections per country are on the X axis). U.S. unemployment numbers, the velocity of money, and health of our cherished small businesses are all in dire straits. Not unlike the trajectory of the coronavirus itself, each day of the “lock-down” causes financial distress to spread around the world. Every article on Seeking Alpha not assuming the end of the world receives 50 comments doing just that. It’s predictable as hunger after skipping two meals.
In an effort to provide the most relevant and actionable information to our subscribers as humanly possible, we decided to take on the arduous task of evaluating global equities markets against not only their unique coronavirus timelines but also key global news announcements. This article is derived from that research.
Rough Roads But We Are Not Driving Blind
Our challenges in the U.S. are not unique. As the third most populous country in the world with an economy highly dependent on consumer spending, there are aspects of the current reality that do hit us harder than other nations. That being said, stay grounded on what is rather than what could be. Focusing too much on the could be is destructive.

Let’s do what’s now impossible and take a trip around the world. We won’t be visiting the coliseum or the Great Wall of China, but we will take a close look at the Borsa Italiana and Shanghai Stock Exchange.
Our path will mimic that of the coronavirus so we can assess the associated impacts country by country. This provides us a concrete, unemotional data to guide us toward what is likely and unlikely here in the U.S. Along the way, we’ll analyze the impact to various stock markets and finally compare that to the S&P 500 (SPY). We strategically covered the markets we think are most relevant to the discussion which involved discretion.
China
The coronavirus began its global trek in Wuhan, China. This mega-city is best compared to Chicago in the U.S. It’s centrally located, the largest in the Hubei province, and home to many enterprises and 11 million residents. Based on our assessment, it’s one of the worst locations in China for this type of virus to start in based on its inter-connectivity, demographics, population density, and resources. Keep that in mind as we go over the numbers.
Let’s analyze the Chinese stock market’s reaction. While iShares Xinhua China ETF (FXI) is the most common ETF to represent large-cap Chinese stocks, we’ll use the actual Hang Seng (“HSI”) index to analyze the outbreak as we walk through the timeline. When ETFs appeared to provide near identical data as local indices, we used those since they are more appropriate for U.S. investors.
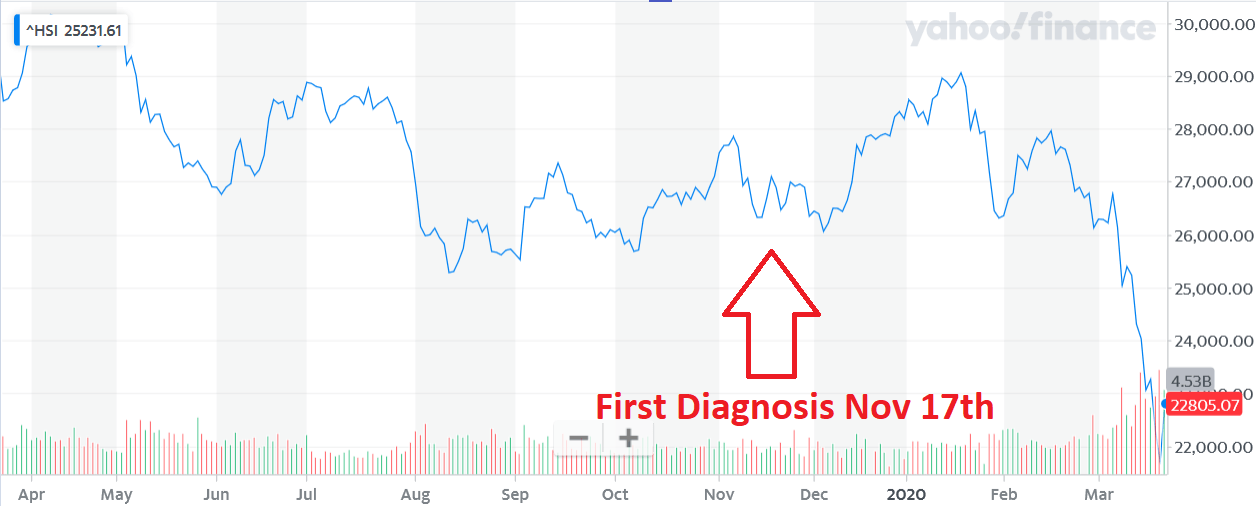
Source: Yahoo! Finance & WER One Year Stock Chart of the HSI.
We’ll use China as the foundation for the coronavirus timeline. The HSI index was at 29,000 a year ago and 26,500 at the time of the first diagnosis of the new coronavirus. Chinese officials began noticing something wasn’t right in November 2019. This version of the flu wasn’t fitting the profile of past outbreaks.
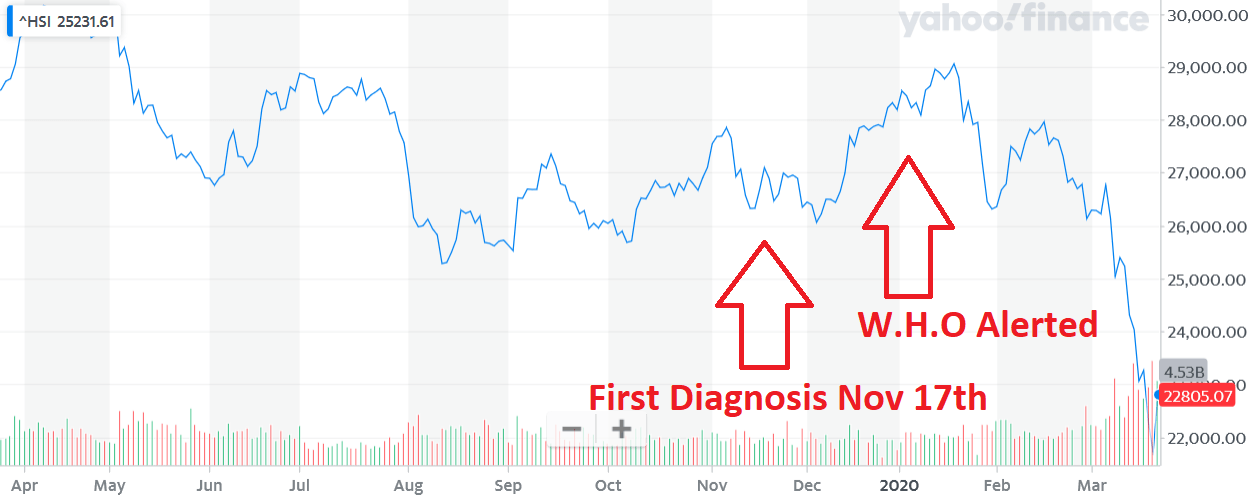
Source: Yahoo! Finance & WER. One Year Stock Chart of the HSI.
On December 31, 2019, China officially alerted the World Health Organization of the new coronavirus. By January 7th, Chinese officials concluded this was not a typical strain of SARS. This is around the time that global media began paying attention. China’s stock market brushed off any concerns and traded back toward 52-week highs of 29,000.
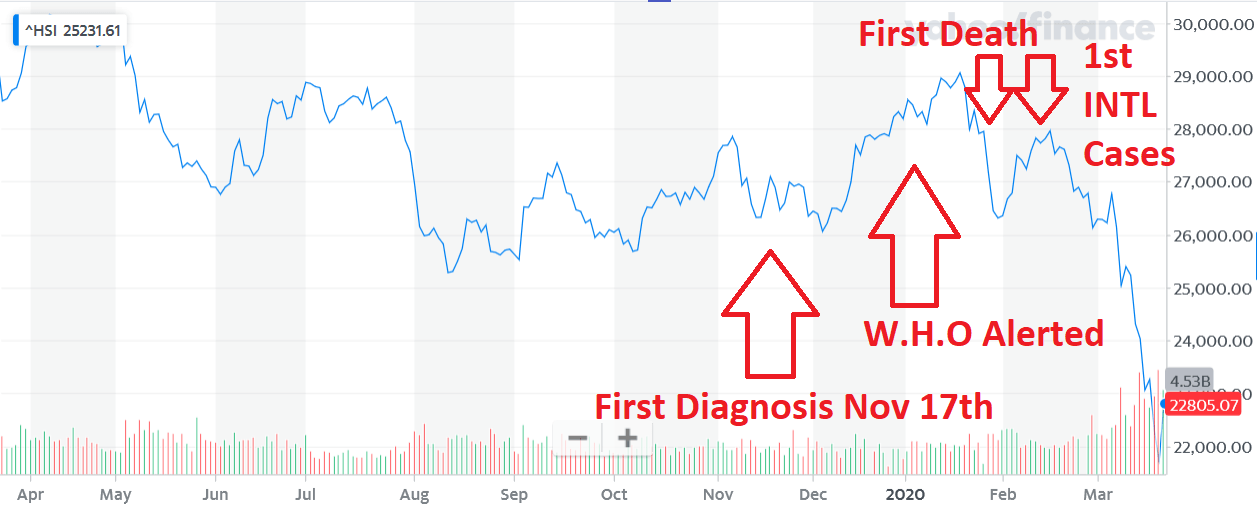
Source: Yahoo! Finance & WER. One Year Stock Chart of the HSI.
The first casualty was reported on January 17th with several nations, including the U.S. and Taiwan, reporting cases shortly thereafter. Notice that even the Chinese stock market did not anticipate problems at this point and was still trading around 28,000. We’ll now move to a three month stock chart as the timeline accelerates.
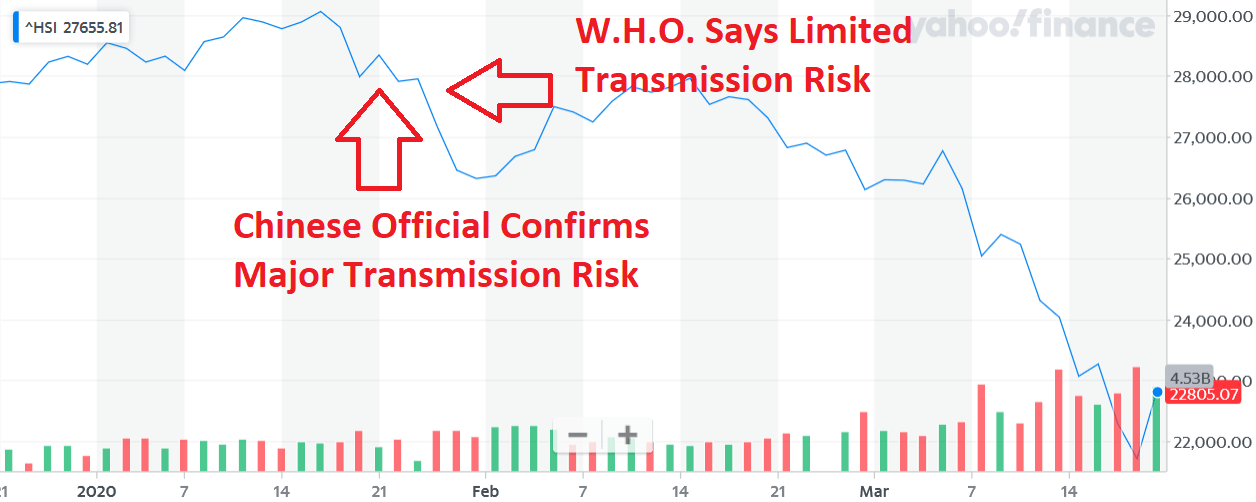
Source: Yahoo! Finance & WER. Three Month Stock Chart of the HSI.
Just as the first cases were recognized overseas, a Chinese expert on infectious disease seemingly inadvertently confirmed human-to-human transmission on live television on January 20th. The World Health Organization (“W.H.O”), however, “confirmed” on the 23rd that there was no human-to-human transmission outside of China. Who knows how things would have progressed differently if the actions on the ground in China reconciled with WHO’s stance. For those that have seen criticism of W.H.O. mentioned in the news, this is one of the sources.
Ironically, January 20th is the same day that Wuhan was forced into quarantine. That’s also the time that western airports began screening passengers arriving from Wuhan. Based on guidance from the W.H.O., this level of action seemed reasonable. Based on what China was doing in Wuhan, it appears insufficient. The first death outside of Hubei province was around January 25th and by that time 41 million people were under lockdown in China though that’s a single-digit percentage of their population.
While the total death toll remained minimal at approximately 60, Hong Kong announced a virus emergency to take proactive measures. They’ve dealt with their fair share of coronaviruses in the past so this was not surprising. The HSI was showing a little weakness at this point but was still well above 2019 lows.
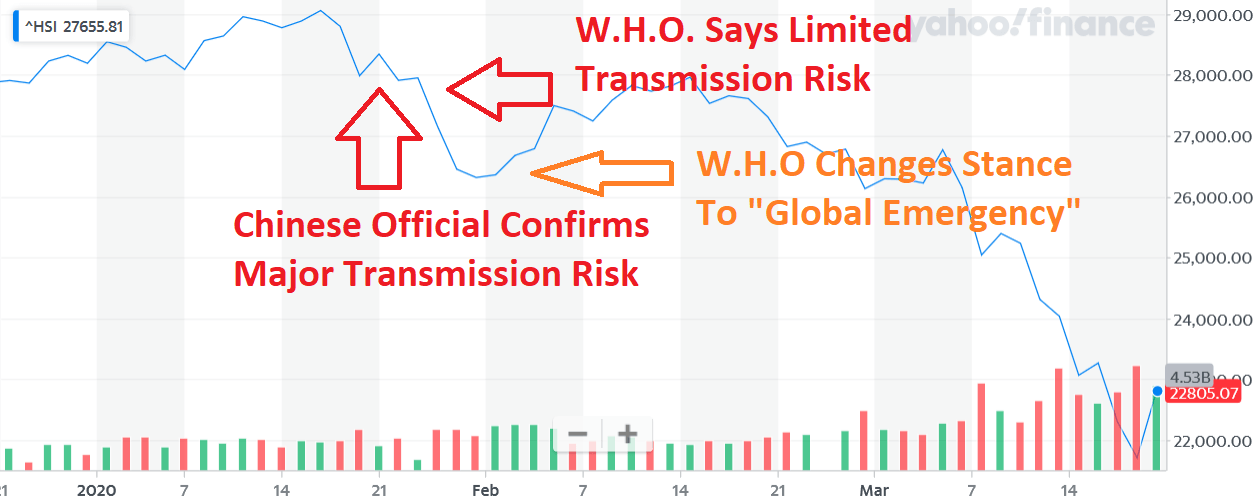
Source: Yahoo! Finance & WER. Three Month Stock Chart of the HSI.
February 1st sees cases rise to 10,000 in China and incidental deaths around the world, mostly from Chinese citizens who acquired the virus in their home country, start being reported. By February 4th, however, reported cases accelerate to over 24,000. The increase in cases and updated guidance from the W.H.O concerning the lack of treatment causes the evacuation of foreigners from Wuhan. February 9th’s case count surpasses 34,500 and the death toll now exceeds that of the 2002-2003 SARS epidemic which killed less than 1,000 people. This is the point at which the Chinese stock market reaches interim highs. Prior to this, the outbreak didn’t look materially different than SARS, MERS, or others that Asia is accustomed to.
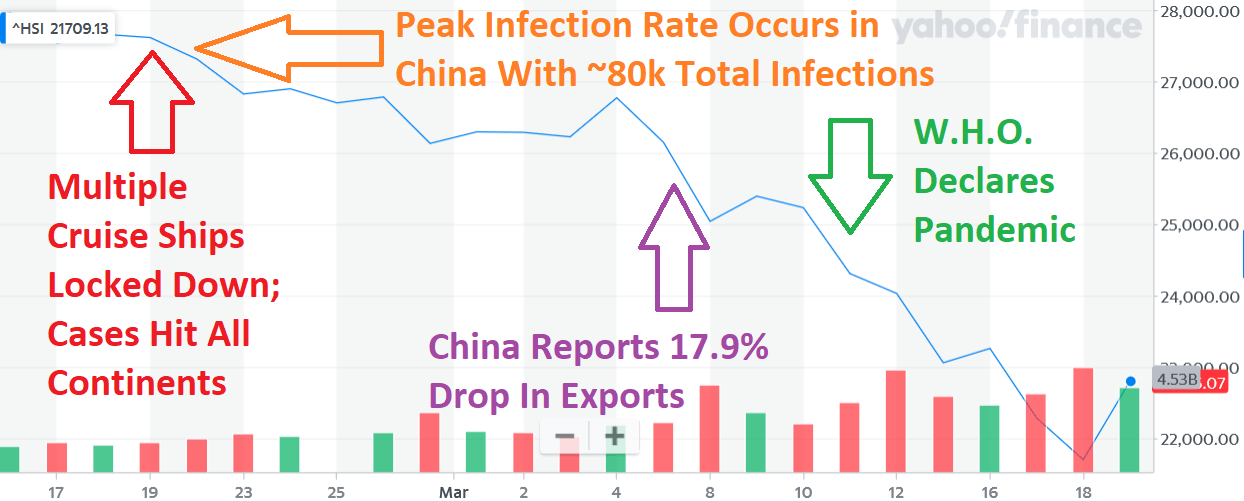
Source: Yahoo! Finance & WER. Two Month Stock Chart of the HSI.
It’s only in the past 7-8 weeks that the Chinese stock market began responding to the pandemic and associated economic consequences. The rate of new infections began to decline in late February with total cases only rising marginally from these levels. The first major economic data encompassing China’s quarantine efforts is reported in early March and shows exports declined by nearly a fifth. W.H.O. finally declares the virus a pandemic on March 11th or a week and a half prior to this article being written. No new cases were reported in China as of March 18th.
Since the start of March, the growth in coronavirus infections globally has caused global GDP estimates to come down sharply. Given China is still an export oriented economy, it’s this news that seems to coincide with a meaningful drop in their stock indices.
Takeaway: China’s stock market bottomed on the second consecutive day no new cases being reported. The death toll will continue to rise but only slowly based on current projections. The HSI index has fallen 13% year-to-date (3/22/2019), a time period that includes all material elements of the coronavirus outbreak.
Like the U.S., Asian markets experienced a strong rally last Friday on greater optimism that the negative impacts of the disease were lessening and that governments were reacting appropriately with aggressive stimulus.
Although data from India is just coming in, we are especially worried about this nation. Without getting into gruesome detail, experts and our independent assessment suggest that it will have the highest mortality in absolute and relative numbers which is frightening given its 1.0+ billion population. Significant downside risk remains in Indian equities though there are a few names we’ll consider (we’ll share with subscribers when appropriate) if their market declines more than 15% from current levels.
Italy & Iran
Now that we have a sense of the timeline, let’s apply it to the next two areas hard hit by the coronavirus. It’s subjective and somewhat irrelevant which geography we visit next, but these nations are certainly among the most impacted.
Iran has nearly as many cases as the U.S. at 21,610 and is struggling to provide basic services. In what we hope is just political posturing, Iranian officials have called the virus a U.S. conspiracy and are struggling to combat its spread or lethality.

While uninvestable for many, Iran does have its own stock indices and market. The nation has persistent double-digit inflation that makes interpreting economic data difficult.
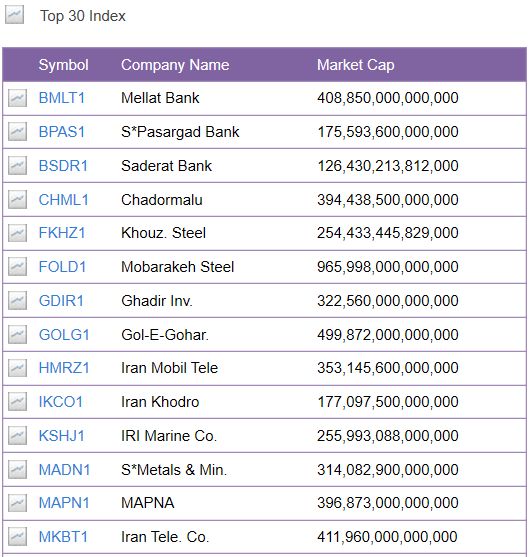
Source: Tehran Stock Exchange
There is one company included in the “Top 30” index with a 16 figure market capitalization which tells you all you need to know. Iran has released at least 70,000 prisoners due to an inability to control the virus. Due to an unstable currency and limited data, even using a Bloomberg terminal, it’s hard to gauge what’s going on with Iran’s stock market except to say it’s volatile so let’s move to Italy.
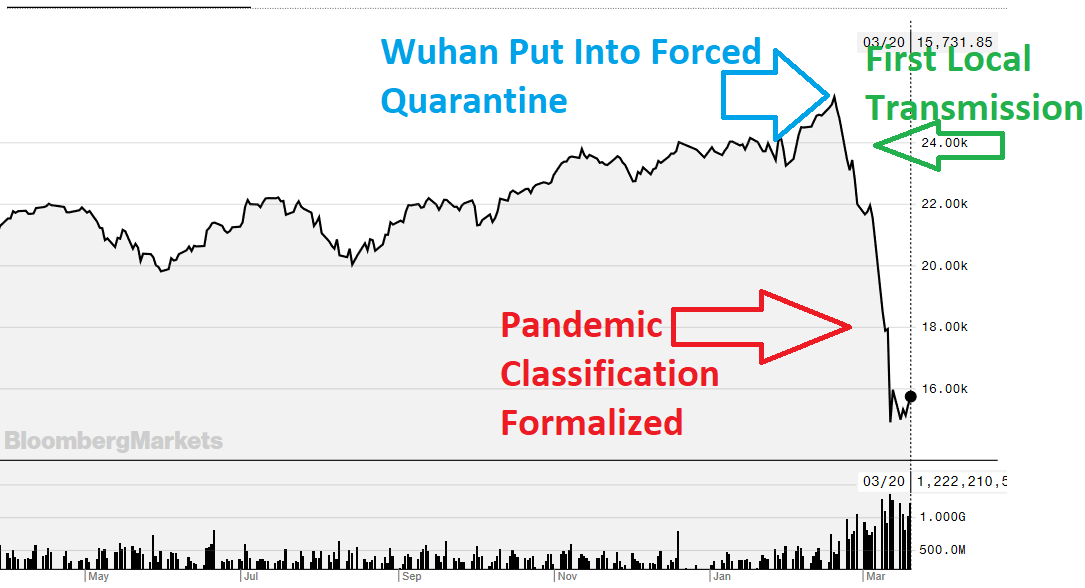
Source: Bloomberg & WER
The Italian stock market (accessible by iShares Italy ETF (EWI)) peaked on the same day that Wuhan was locked down by Chinese officials. Shortly thereafter, Italian officials confirmed the first local transmission of the virus. Only two days later, Italy began rapidly closing public areas including the Venice canals. The first week of rapid transmission corresponded with the sharpest fall in its stock market. Italy’s healthcare system had little to no spare capacity prior to the outbreak resulting in a rapidly climbing death toll. By March 3rd, Italy’s deaths equaled Iran’s at 77.
By March 8th, Italy had quarantined 16 million of its citizens which quickly expanded to most of the country. The current run rate is approximately 800 deaths per day but appears to be stabilizing. Unlike China, there is insufficient information to confirm if the virus’s transmission has slowed or continues to accelerate.
Takeaway: Italy, the new epicenter of the pandemic, has experienced thousands of deaths and is certain to realize at least that many more even if it gets the spread of the virus under control. The Italian stock market has fallen 37% from 52-week highs and is down 24.7% year-to-date. The nation’s stock market fell quickly after the first local transmission confirmed it would be an issue and appears to be bottoming now that daily mortality rates have stabilized (for the time being). Iran isn’t investable for most westerners but its outlook looks grim for local citizens.
Spain & France
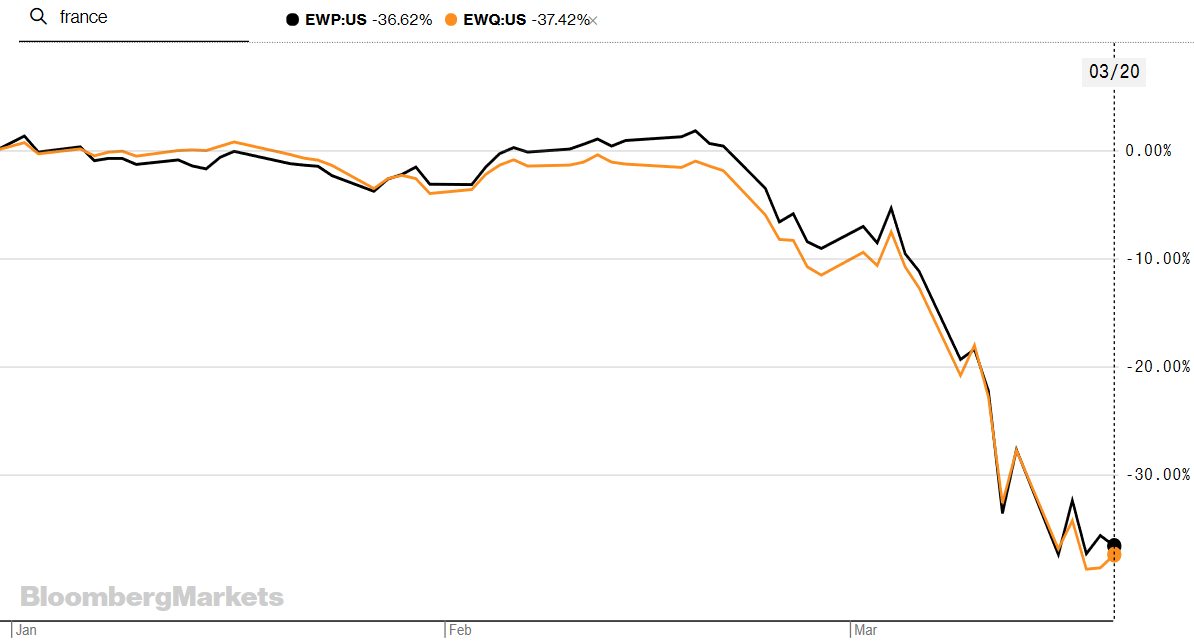
Source: Bloomberg
Spain (iShares Spain ETF (EWP)) and France (iShares France ETF (EWQ) are not far behind Italy in cases. As of March 19th, Spain’s fatality rate began accelerating and totaled 767 at a 200 daily run-rate. It remains the second hardest hit nation with over 21,000 infections as of March 21st. Due to their proximity to Italy and integration into the EU, France and Spain are facing similar circumstances and their stock markets reflect that.
As someone who has traveled throughout most of Europe, outside of Eastern Europe and Switzerland there are few remnants of the old border infrastructure. This makes containing the virus even more difficult than here in the U.S. or in Canada. It’s unclear if Spain has a grasp on the situation and it’s feasible the situation will get worse before it gets better. In line with what we’ve already seen with Italy and China, a nation’s equity markets don’t tend to bottom until the maximum infection rate stabilizes. At that point, nations can reliably ascertain the final outcome but not before.
Takeaway: As we can see above, both France and Spain have lost approximately 37% of their equity markets’ values year-to-date. Spain in particular looks like the worst is still ahead of it and the normalizing of negative data has not yet occurred in these markets.
Germany & the U.K.
Source: Bloomberg
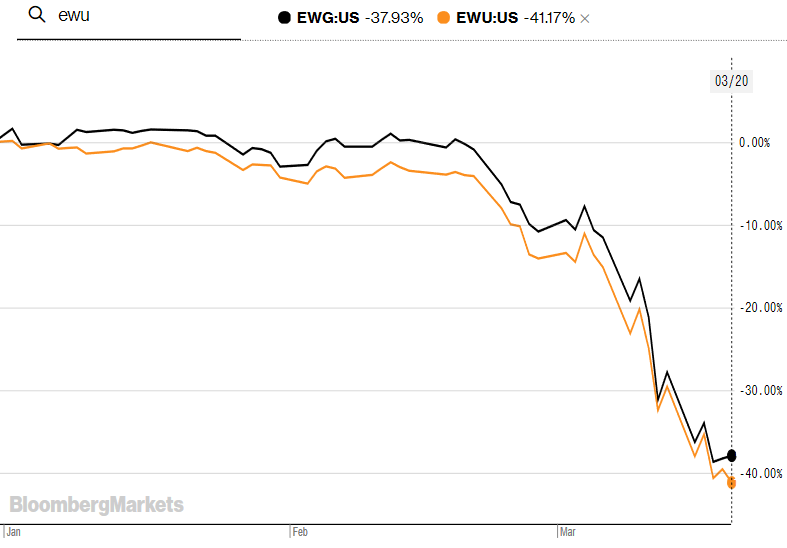
While Switzerland, Norway, and Luxembourg have much higher per capita wealth, the U.K. (iShares UK ETF (EWU)), France, and Germany (iShares German ETF (EWG)) are the largest economies in Europe with Italy and Russia in fourth and fifth place, respectively. The U.K. and Germany both have an independent streak and very high levels of integration with global trade.
Germany has implemented among the strictest measures by banning meetings of more than two people unless those groups are working specifically on virus-related issues. As of March 9th, Germany had 1,100 confirmed cases which quickly grew to 13,957 as of March 14th. Merkel has self-quarantined after making contact with an infected doctor. Thus far, Germany has had an unusually low fatality rate though experts believe that will deteriorate after it spreads from mostly young people to broader demographics. It’s clear Germany is taking the issue very seriously and their federal government has significant resources to tackle the issue. Specifically, John Hopkins noted that Germany has 0.3% mortality rate compared to 9% in Spain and 4.6% in the U.K. Before jumping to conclusions on demographics, Germany actually has the highest percentage of citizens of 65 and is tied only be Italy. Italy is rated as having a healthier population than Germany as well.
In addition to a >90% lower fatality rate, Germany’s number of infections is favorable relative to Spain and Italy considering their populations. While not as diligent as South Korea, Germany has been testing and isolating people at a faster rate than its neighbors. We expect the lack of post-mortem testing and other structural issues strongly influence this figure and the real number of fatalities is closer to Spain and Italy than it currently appears. That’s likely one reason why the German index has fallen slightly more than Spain and France year-to-date. The primary reason, based on what we can ascertain, is Germany’s exports based economy. With demand perceived to be slowing globally, it’ll take a big hit and that’s unsurprisingly demonstrated by its forward-looking equity markets.
At just over a 40% decline, it’s not Italy or China but the U.K. that has experienced the greatest stock market losses of the countries we’ve analyzed thus far.
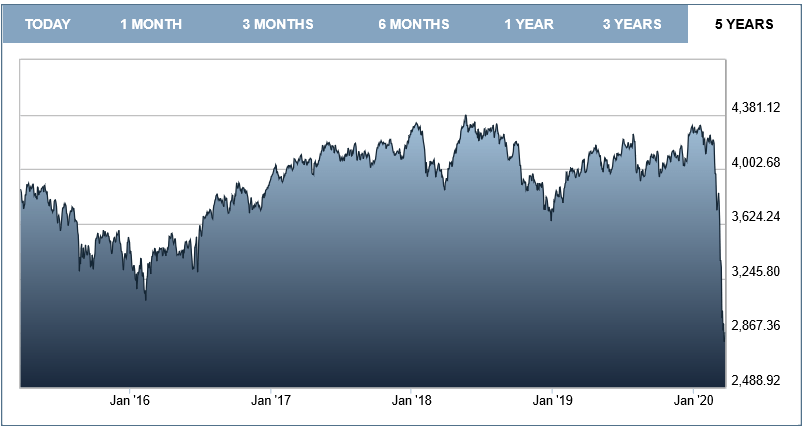
Source: London Stock Exchange
In fact, the FTSE 350 is well below 5-year lows. While most of the news related to the coronavirus from the UK has been political rather than scientific in nature, it is possible to navigate an array of government websites to find useful information:
As of 9am on 22 March 2020, 78,340 people have been tested in the UK, of which 72,657 were confirmed negative and 5,683 were confirmed positive. 281 patients in the UK who tested positive for coronavirus (COVID-19) have died.
After some hesitation, the UK is now embracing similar social distancing and forced closure of many businesses in line with continental Europe. Based on extrapolating current data, the UK is considered two weeks away from an Italian type catastrophe. That uncertainty is apparent in the UK’s stock markets’ activity.
Takeaway: Compared to its neighbors and somewhat surprisingly, it appears there is greater relative downside risk in German equities. If the low mortality rate holds, then the country may be among the first to rebound but that scenario seems unlikely. The UK’s situation appears to be mirroring Italy a few weeks ago and that has equities selling off harder than any other nation we’ve covered. The old saying that the market hates uncertainty more than any other variable seems true. Until markets believe a steady-state in infection levels has been obtained, expect immense volatility in these markets. The German and UK equity markets are down 38% and 41%, respectively.
Turkey & Middle East
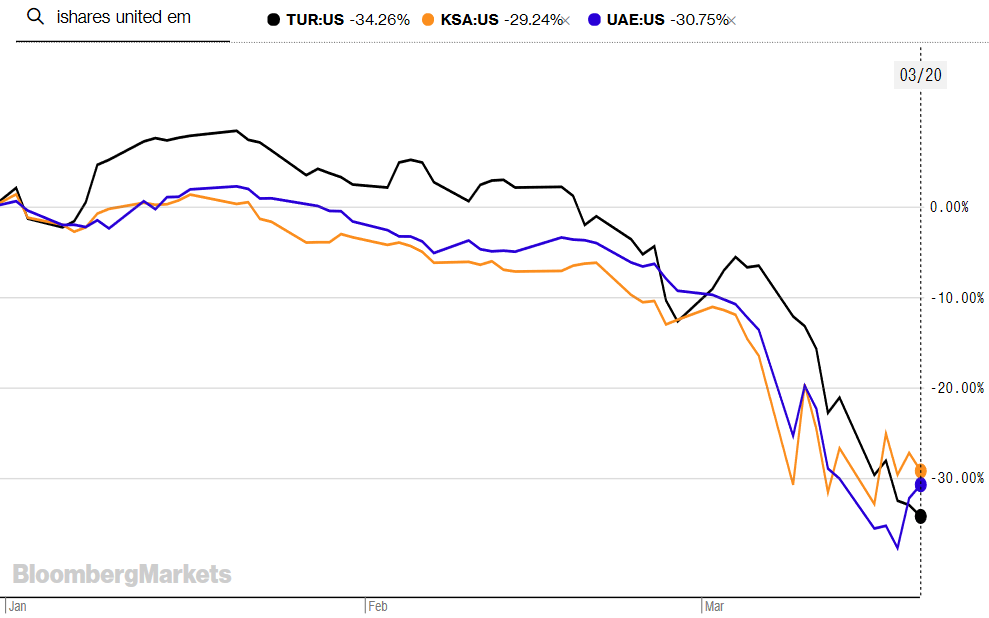
Source: Bloomberg
Here we have Turkey (TUR), Saudi Arabia (KSA), and the UAE (UAE) as benchmarks for the Middle East and Eurasia. These nations’ cases are relatively new but the richer Arab nations have now implemented the standard measures to slow the spread. We aren’t familiar enough with Saudi Arabia or the UAE to give especially useful commentary on how their medical systems might handle this situation. Their impact on the global economy outside of the commodity space is limited, however.
Turkey, on the other hand, is a nation WER’s lead PM is intimately familiar with. It’s a key military and economic power within Europe/Eurasia and its health matters to the rest of the world. As the literal and figurative bridge between Europe and Asia, we can expect a high rate of infection which is almost certain to increase due to Syria’s ongoing humanitarian crisis. Turkey’s market was already moderately undervalued prior to the crisis, unlike many other nations, and that helped minimize 2020’s losses. The nation is just beginning its battle with the coronavirus which is both good and bad. On one side, the nation knows what to do based on what’s occurred around the world. Opposite that, we’ve seen that equity markets tend to decline until a steady-state infection rate is achieved and Turkey is at least weeks away from that short of a miracle. A significant outbreak is already priced in as shown in the stock chart but we urge caution until TUR trades well below $20 if not $15 per share to be safe.
Japan, Korea, Taiwan, & Hong Kong
We saved these nations for last as they are likely the best proxies of what’s to come long-term.
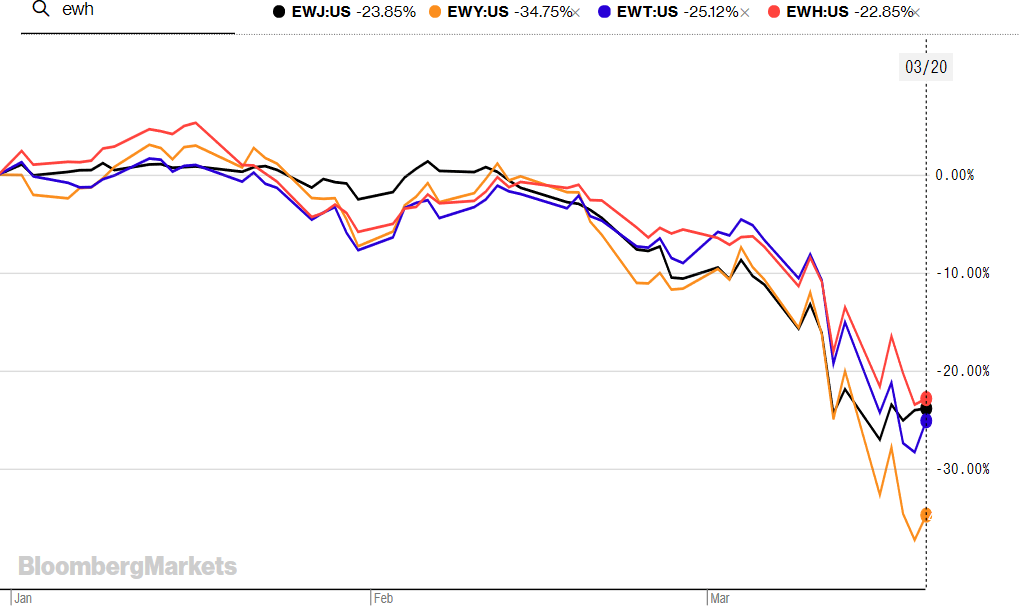
Source: Bloomberg
Notice how similar Taiwan (iShares Taiwan ETF (EWT)), Hong Kong (iShares Hong Kong ETF (EWH)) and Japan (iShares Japan ETF (EWJ)) have traded. They experienced a moderate decline starting in mid-February which didn’t turn into a crash until the day the pandemic announcement was made by W.H.O. These markets have held up quite well and are down 22-25% year-to-date. Outside of China, these are the best performing stock indices discussed in this article thus far. South Korea (EWY), on the other hand, is down nearly 35% or about the same as Spain and France though better than Germany and the UK’s -40%. Taiwan effectively avoided the crisis to date by acknowledging the danger and taking real action early on. Given its economic and cultural integration with China and past experience dealing with other coronaviruses, Taiwan was sufficiently informed and prepared to battle the virus without letting it get past its defenses.
Taiwan’s deep integration with the global economy and heavy reliance on trade has caused its stock market to fall a little 25% but it remains flat over the past five years, excluding dividends, which is better performance than most. Hong Kong has suffered the lowest decline of the group year-to-date which is quite a feat given its proximity to mainland China and extremely heavy population flows to and from the region. Couple that with an ongoing political crisis, and its equity markets’ performance during the coronavirus outbreak is admirable. Hong Kong’s markets are down modestly in the last five years but there are more factors involved than just the coronavirus.
It’s too early to tell how things will play out in Japan but its natural geographical defenses are weakened by its very high population of older people. So far, Japan has experienced relatively few cases and appears to have stopped widespread transmission. It’s too soon to tell but the situation looks positive for Japan for the time being. This is another case where downside risk is prevalent.
We’ve all heard about South Korea and its massive testing campaign. The nation is often mentioned as the “how to do it right” example. It seems odd that its stock market has suffered far more than its Asian peers and even most European nations. South Korea began experiencing rapid transmission around February 20th. As we’ve seen over and over again, the date of the first few deaths ends up correlating with the time the virus begins spreading very quickly. Through February, South Korea had a multiple of Italy’s cases. February 9th saw the highest daily number of recorded cases. Just recently on March 17th, things began turning in the right direction as new cases declined markedly. Widespread testing and voluntary isolation have been effective for South Korea.
Takeaway: South Korea, like Germany, is an industrial power reliant on exports. It seems its stock market is more sensitive to global GDP than any direct impact from the coronavirus and has subsequently fallen over 40%. Japan appears to be minimally impacted but it is too soon to tell; the Japanese stock market seems comfortable its situation will be more like Taiwan and Hong Kong rather than Europe.
Ironically, Taiwan and Hong Kong, both effectively Chinese satellite states, are doing well and are barely down 20%. They engaged with the coronavirus very early and therefore there is data providing clarity to investors. The news is mostly good but the trend suggests that clarity is more important than whether that vision sees good or bad data.
So far, it seems the best recipe for domestic stock markets is a low reliance on physical exports coupled with a steady-state infection rate. Proximity to China is statistically beneficial and certainty combined with a high number of infections results seems to result in better stock market performance. Countries that have done the worst are actually farthest from Wuhan, have relatively few infections, but the lowest certainty regarding probable aggregate infections.
The United States
The U.S. is a big nation with among the world’s busiest airports; we should expect significant levels of infections. New York now has more documented cases than France or South Korea. New York’s testing regime is also very robust so that partially reduces the headline’s fear-factor. No other U.S. state has over 2,000 compared to New York’s 15,000+, but that’s mostly a result of a higher testing rate per capita. Given the U.S.’s infection rate is almost guaranteed to climb not just linearly but exponentially, our analysis suggests more downside risk for U.S. equity markets.
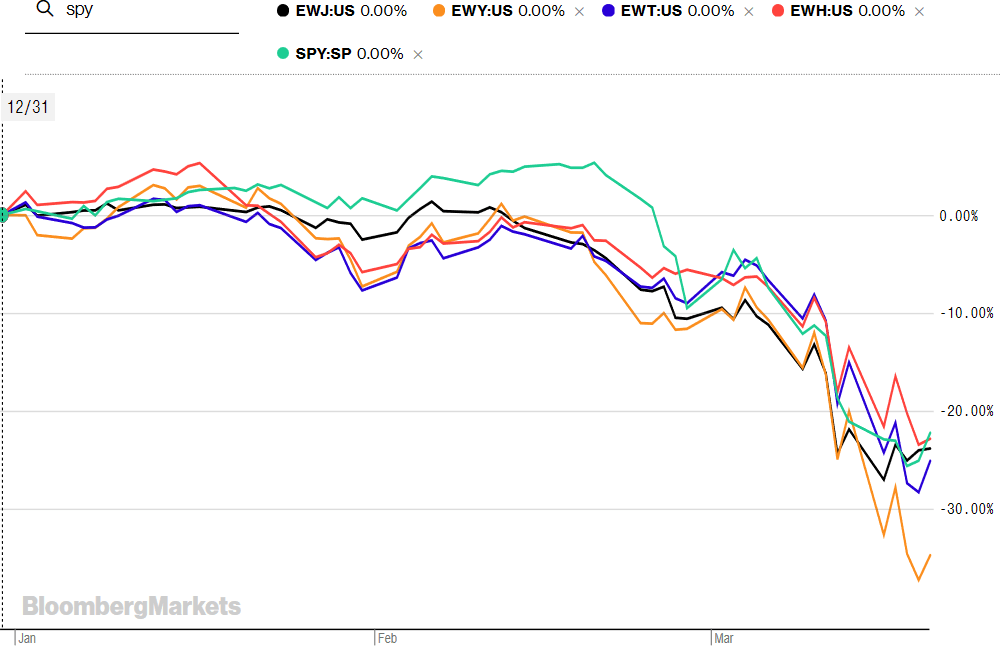
Source: Bloomberg
On the other hand, the iShares S&P 500 (SPY) is right in line with Asian countries that have already experienced most of the expected damage from the coronavirus. We are less export reliant than Germany and South Korea. Remember that the export factor appears more statistically tied to stock market performance than the domestic infection rate.
What does all this data tell us about the S&P 500?
- Clarity on the total impact of the coronavirus is more important than the impact itself;
- Most nations’ equity markets have sold off roughly 30% on average compared to SPY’s decline of approximately 25%;
- Equity markets tend to keep falling until a steady state in the daily infection rate is achieved, and perhaps most importantly;
- A pessimistic assumption of the coronavirus’s toll on the U.S. equates to a 40% correction in the S&P 500, a market neutral assumption suggests we are within 5% of crisis lows, and a bullish assessment equates to the bottom already being in.
Want to take advantage of the sell-off but worried about choosing the wrong stock or buying too early? After thoroughly assessing the current environment, we built a brand new “Crisis” portfolio to aid our subscribers with fresh recommendations on REITs, BDCs, and high-quality dividend stocks. It includes crisis buy ranges, company quality ratings, risk-tolerance commentary, and more to navigate the volatility with confidence based on today’s circumstances, not the old paradigm.
Start a free trial of our Institutional Income Plus service. We explain how institutional investors source, analyze, and manage their investments but with the individual investor in mind. Join the growing community!
Disclosure: I am/we are long TUR. I wrote this article myself, and it expresses my own opinions. I am not receiving compensation for it (other than from Seeking Alpha). I have no business relationship with any company whose stock is mentioned in this article.
Be the first to comment