

Michael Vi
Hybrid Business Model
Since Lending Club (NYSE:LC) acquired the banking charter with its Radius Bank acquisition in early 2020, it revamped its business model to leverage its banking and FinTech capabilities intended to:
- Use its online banking platform to attract low-cost funding
- Shift its loan portfolio from the traditional commercial loans (from Radius Bank) to unsecured personal loans (Lending Club) with a higher yield.
- Keep its lending marketplace (FinTech arm) which generates fee-based revenue that is intended to offset its operating expense.
The below diagram from its presentation explains its hybrid business model.
Its finTech arm (marketplace) processes 75-80% of loan origination, with origination and servicing fees as its primary revenue source.
Its banking arm takes the remaining (20-25%) loans, with net interest income as its primary revenue source.
Lending Club crossover Model (Lending Club)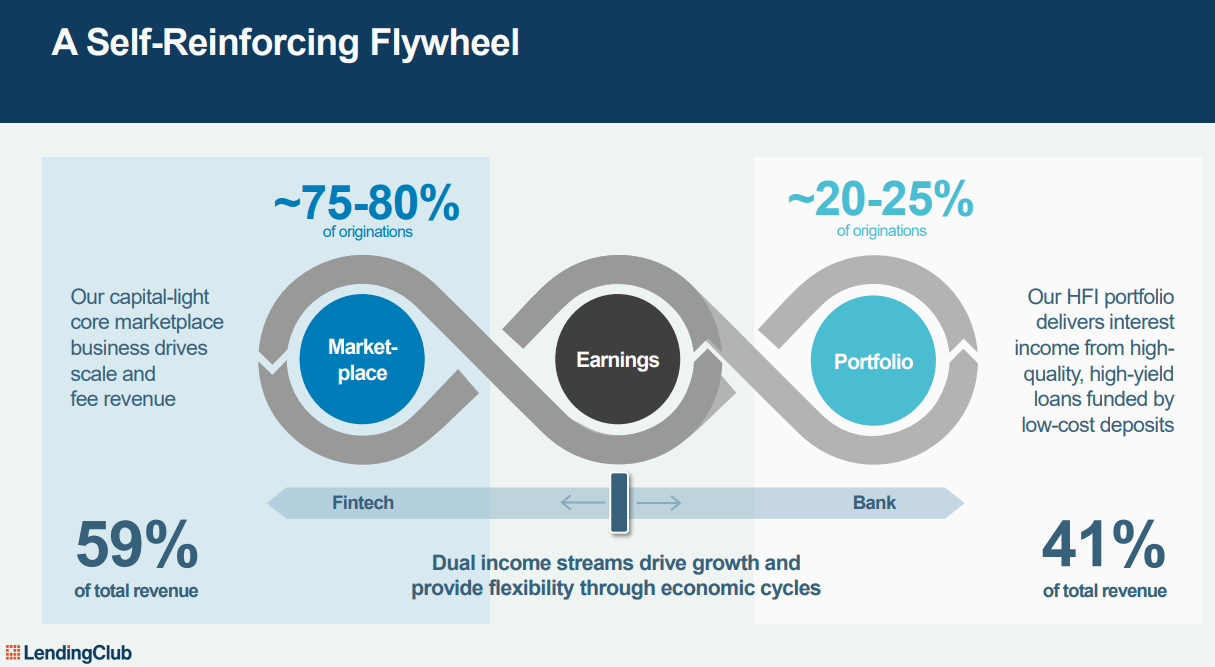
The strategy offers incredible operating leverage and a distinct advantage over traditional banks and many popular FinTech names as I dive into the following chapters.
My last Model Valued it at $70/share
I started to follow LC in early 2021 when its management team laid out its new business model. With its past proven record to originate $12-13Bn in unsecured loans a year and its newly acquired banking capability, I saw a viable path to ramp up its high-yield loan book to $7-8Bn with a profitable unit of economics and scalable business model.
You might read my initial analysis (written in Nov 2021), I modeled ~$700Mn operating income by 2024 and valued its stock at $70/share with a 12x Market Cap/Operating Income multiple.
LC lost 70% of its market cap and currently trades at $13-14/share.
How I Approach It
Allow me to start by saying I try not to allow price drive narrative, I don’t subscribe to the idea that price tells all truths. While a 70% price drop is certainly painful, that alone is not enough for me to fold with no questions asked.
Having said that I’m also not in the ‘never sell’ camp.
I take efforts to study a company and build a conviction, but I don’t treat it as immutable truth, I continue to evaluate data/facts and revise my thesis/model when things change.
What Went Wrong/Right
Going through its last few quarterly results, I compiled a list of what I got right vs. wrong in my initial analysis.
What I get right:
- Its unsecured loan book indeed increased at a jaw-dropping pace from $100Mn in 1Q21 to $2.9Bn by 2Q22,
- Its non-interest income from the marketplace by and large covers all of its operating expenses.
- Its loan book performed well with a low net charge-off rate, with healthy/increasing reserves.
What I get wrong:
- My initial projection of a $7-8Bn loan book by 1Q24 was too optimistic, partly because I miscalculated its average loan duration, thus underestimating the amount of retiring loan each quarter.
- 12x market cap/Operating Income multiple is too aggressive.
Let us dive into the above points, together with its latest 2Q22 result.
Loan Book Growth
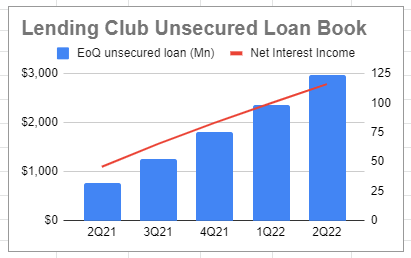
In 5 quarters from 2Q21 to 2Q22, Lending Club’s unsecured loan book increased from $776Mn to $2.9Bn, with impressive QoQ growth. As a result, its net interest income increased from $46Mn to $116Mn.
LC Unsecured Loan Book (Y21-Y22) LC Unsecured Loan Book (Y21-Y22)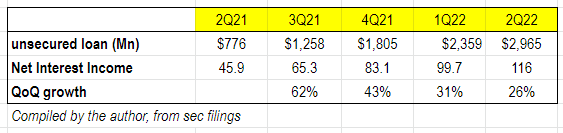
During the same period of time, % of loans allocated to its own loan book (as opposed to the marketplace) increased from 20% in 2Q21 to 27% in 2Q22 (its split ratio guidance was in the range of 20-25%).
It is important to note that an underwriting loan has superior economics compared to a marketplace loan over the life cycle. However, due to CECL (Current Expected Credit Loss) requirements, the expected loss is an upfront accounting expense item at the time of underwriting, thus net income for that period takes an initial hit.
In other words, high % loans allocated to its own loan book decreases the current quarter’s accounting profit, in exchange for the future quarters’ better economics.
Here are the management comments in 2Q22 with how they think about managing the split ratio. I think LC will likely continue to maintain the split ratio at or above 25% in the next quarter or two.
And while we can not control or predict the macro economy, we are leveraging our enhanced set of tools to control what we can control. In a bull market, we can leverage the capitalized advantages of our pure FinTech to seize market share. And in a bear market, we can lean on the funding stability and advantages of a bank to drive resiliency and profitability.
In today’s environment, we are leaning more towards the bank model, being conservative on credit and using our low cost deposit funding to hold more loans for investment and drive recurring revenue. As the economy improves, we’ll be ready to lean into our FinTech advantage, dialing up the marketplace to drive scale capture market share.
Non-interest income Covers Op Ex
Over the last 5 quarters, its non-interest income (mainly from origination fee and servicing fee) by and large covers its operating expense (Sales/Marketing, G&A, and R&D) precisely as how I expected from my initial analysis.
Compiled by Author 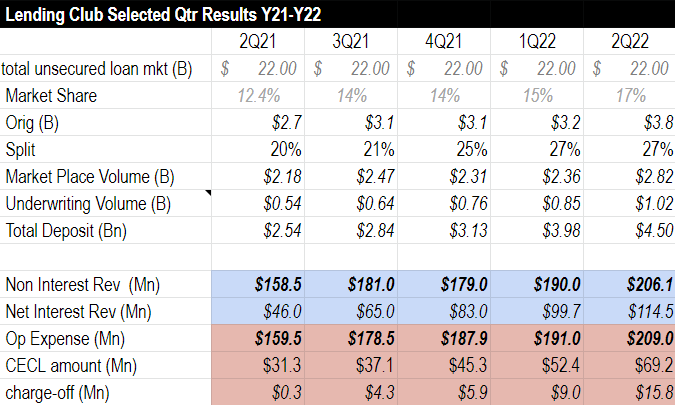
Furthermore, that offset is an intended effort by the design of the business model, as long as the underwriting vs marketplace split ratio is within or near the management guidance. As many non-interest income items (e.g. origination/servicing fee) and expenses (e.g. marketing) share similar drivers such as loan origination and servicing portfolio size.
This offers incredible operating leverage, as it ramps up its loan book, its net interest income after allowance for loan loss goes straight to net profit, a far superior model to traditional regional banks where many well-run banks’ efficiency ratio hovers around ~50-60%, while non-interest income is a negligible portion of its revenue.
Its competitive advantage over FinTechs such as Upstart (UPST) is clearly underscored by the challenges Upstart faced recently as its CEO said last month (both are non-issues for Lending Club as it has its own bank charter):
Our revenue was negatively impacted by two factors approximately equally. First, our marketplace is funding constrained, largely driven by concerns about the macroeconomy among lenders and capital market participants. Second, in Q2, we took action to convert loans on our balance sheet into cash, which, given the quickly increasing rate environment, negatively impacted our revenue.
Deposit
Thanks to its bank charter (LendingClub Bank), its deposit has been increasing to ~$4.4Bn (from $3.5Bn 1Q22, and $2.5Bn 2Q21). While its deposit interest rate is relatively high compared to JP Morgan (JPM) or Wells Fargo (WFC) alike, it still has a distinct advantage over non-bank lenders and FinTech firms, which often pay 5x-10x higher costs to secure funding through debt borrowings.
Book 2Q22 (Lending Club)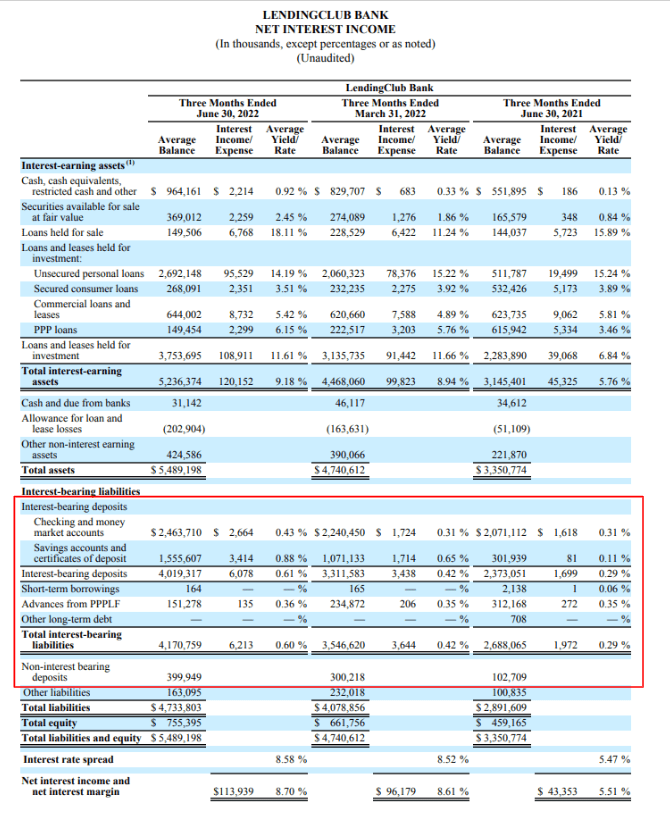
Loan Performance
Consumer loan charge off $14.7Mn in 2Q22, given its average unsecured loan balance at $2.6B, its NCO (Net Charge-off) is ~2.2%, and its CECL (Current Expected Credit Loss) is at 6.8%. The table below provides NCO/CECL numbers among a few lenders including JP Morgan, American Express (AXP), Discover (DFS), Capital One (COF), and Synchrony Financial (SYF).
Loan Performance (LC/JPM/AXP/DFS/COF/SYF)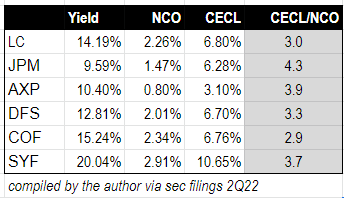
* For peer comparison purposes, JP Morgan and Capital One numbers are their credit card business units only.
NCO usually goes up as yield moves up (from prime to non-prime borrowers).
CECL% usually ranges from 2.5-4.5x NCO. LC’s CECL/NCO ratio of 3x is reasonably conservative especially considering its relatively short loan duration.
Now let us move to the tough part – what I get wrong.
Mature State Loan Book Size
In my initial analysis, I estimated its unsecured loan book will grow to a mature state at $7-8Bn by early 2024.
I was wrong after examining its recent quarter data. Given what we know today, I estimate that its end state unsecured loan book size is around ~$5B.
To be clear, many factors could alter Lending Club’s mature state loan book size significantly. For example, it could:
1. Gain larger market share, exceed $12-13Bn annual loan origination;
2. Increase split ratio above 25%;
3. Expand to other loan markets (e.g. auto).
My projected $5Bn in a mature state is a quite conservative estimate based on the current business model and guided operating metric without looking out what’s possible in the future.
Here is the back of the napkin math of how I reach the $5Bn estimate: $3.3Bn origination each quarter, 25% of it goes to unsecured loans – that is $825Mn new loans.
Average loan duration is ~18 Months (*), which yields to $830Mn retired loans each quarter when the loan book reaches $5Bn.
New and retiring loans reaches a balance.
(*) loan duration is not disclosed in its quarterly result. This is my estimate after tracking its beginning / ending loan balance over the past few quarters, as well as my past experience as a P2P lender. Details are shown in the valuation model in the last chapter.
Valuation Multiple
My initial valuation model used 12x MCap/Y24 Operating Income (discounted to NPV), a ratio I consider conservative after comparing to some of its FinTech peers Upstart Sofi (SOFI). Well, let me admit I drank my fair share of kool aid.
In search of its peers, I find credit card businesses with banking operations as a more appropriate peer group such as American Express, Discover, Synchrony Financial, and Capital One because:
- Banking charters (all 4 above have full-service banking operations) are subject to the same regulatory oversight/requirement, thus they share similar revenue and profitability drivers.
- The majority of Lending Club’s clients are credit card debt refinancing (targeting a high FICO score user base), thus they share a similar customer base and I expect similar loan performance.
At first glance, other than AXP trade at 16x LTM P/E, the other 3 trade between 5-6.5x PE today, much lower than LC’s 10x.
Multiple (LC/AXP/DFS/COF/SYF)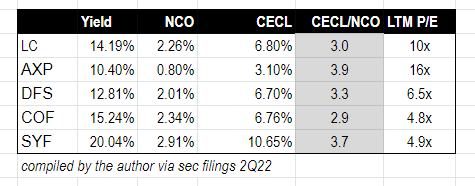
If we dive into their historical P/E, they are around 10-12x (except American Express).
A part of the multiple shrinkages is due to the recent overall market drawdown, the other factor is recent quarters’ sizeable reserve release among many credit card operators.
For example, Discover TTM net income is $4.3Bn, which includes ~$700Mn reserve release benefit, thus its adjusted net income shall be $3.6Bn, or an adjusted TTM P/E ~8x.
Important to note that Lending Club didn’t have the same reserve release benefit as it started to build its loan book from the ground up in late 2020. On the contrary, it pays a slight penalty as CECL are upfront expenses deducted from income. Equally important to note, LC’s net profit continues to rise at a rapid speed as it ramps up its unsecured loan book.
In summary, LC’s LTM 10x P/E is not an apple-to-apple comparison to SYF 4.9x, COF 4.8x, and DFS 6.5x
Why does American Express demand a higher multiple? First off, its high-quality clientele is quite self-evident (as one might note from its remarkably lower Net charge-off (NCO) with a slightly lower yield rate). Secondly, unlike most loan businesses, AXP’s non-interest income (mostly fee-based revenue) is larger than interest income, and well covers its operating expense, quite unusual among its peers. (hint: something LC shares in common)
I don’t suggest LC has a quality like American Express. I indeed consider AXP’s multiple (16x P/E) the ceiling for this space.
However as LC passes its current fast-growing period and reaches its mature state, a P/E ratio of 8x – 10x would be reasonable, when E represents its mature state earnings.
Valuation Model Revisited
The painful part of a valuation exercise, as a real example I laid out above, is I might get many things right, but it only takes 1 or 2 wrong assumptions to throw off the whole valuation.
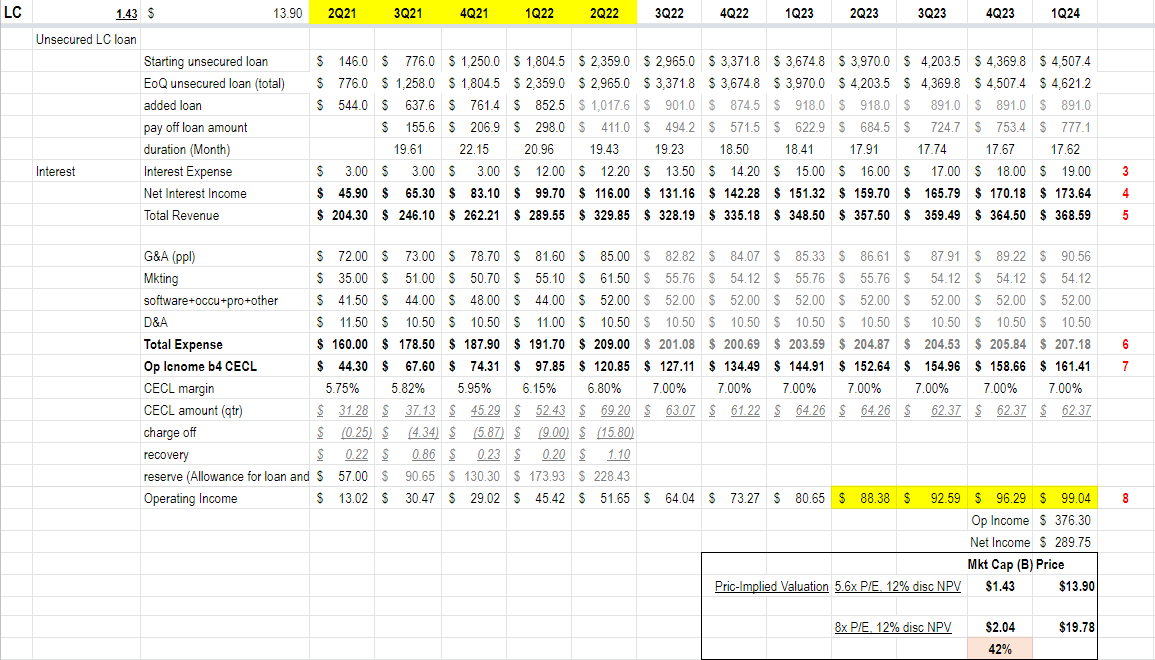
In the revised model below, I laid out my best (quite conservative) estimate of how its unsecured loan book progress in the next 1.5 years, and how it generates an LTM operating income of ~$380M (i.e. net income ~$290M) by 1Q24. With its current $1.4Bn market cap, that has a price-implied valuation of 5.6 x P/E (12% discount to NPV) today.
8x Y2023 P/E would equate to ~$20/share today, a fair valuation P/E multiple under a reasonably conservative model (as discussed in the last section).
LC Valuation Model (Aug 2022) LC Valuation Model (Aug 2022)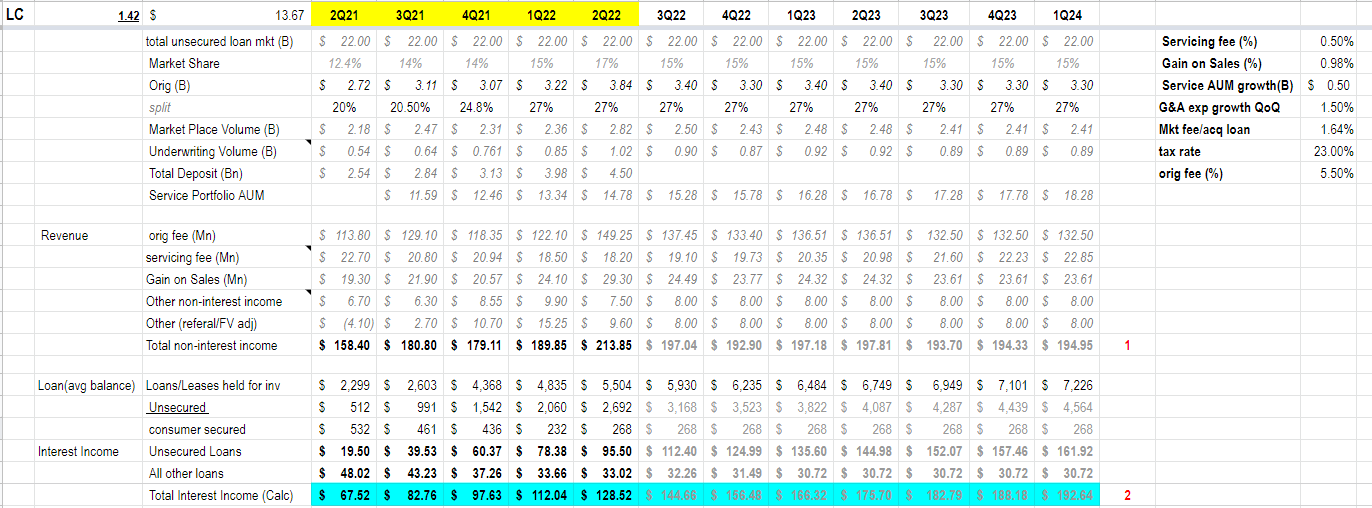
Valuation Caveat and Optionality
Let me highlight one thing to underscore why I consider the model reasonably conservative.
I model the mature state unsecured loan book at $5Bn, plus its $1Bn other loans (commercial, consumer secured) make its total loan book at $6Bn.
As of 2Q22, LC’s CET1 capital is $895Mn. Adding its projected accumulated net income of ~$400Mn, its CET1 capital would be $1.3Bn by 1Q24, which is a CET1 ratio of ~21.6%.
US Basel III requires a minimum 7% (4.5%+2.5% buffer) CET1 ratio, and Lending Club commits to 11%. As a reference, JP Morgan has an 11.9% CET1 ratio today, and most banks (global/regional) currently have a CET1 ratio between 8-14%
In other words, at $1.3B CET1 capital in early 2024, Lending Club would have plenty of room (~$6Bn) to increase the size of its loan book (provided low-cost funding can be sourced), either via tuning up its split ratio, or expanding to the new loan market.
If/when that takes place, a re-rating discussion would certainly be on the table. That’s what I call free optionality.
Conclusion
Lending Club has a superior business model with a distinct advantage over both traditional banks and FinTech firms. Since its business model pivot over one year and a half ago, it has flawlessly executed its strategy and (more than) delivered what it promised.
Its true value is buried under a misleadingly higher P/E multiple (compared to some of its peers) as discussed in the ‘Valuation Multiple’ section.
Looking 1.5 years ahead, with a relatively conservative valuation model, it offers a compelling value today with 40% upside potential and free optionality.
Be the first to comment