

GlennVermeesch
This article was co-produced with Chuck Walston.
I was hiking with a buddy in Smoky Mountain National Park last week when our conversation turned to our retirement accounts. His 401K lost 40% of its value this year, while my fully invested accounts had only dropped by 8%.
My friend relies on a respected financial advisor, that invested heavily in FAANGs and other growth companies prior to this bear market. In contrast, my account is almost exclusively devoted to dividend-bearing stocks.
My friend intended to wait years before taking Social Security, but has now decided to take his payments immediately. He reasons that selling positions while they are down by 40% would be deleterious to his long-term financial health.
This led me to ponder the effect Required Minimum Distributions ((RMDs)) will have on my retirement accounts, and I realized that RMDs could wreak havoc on my 401K.
Ponder this: a widely followed rule states that retirees should withdraw 4% from their accounts each year. However, on your 75th birthday, you will be required to withdraw over 4% of your account to meet RMDs. By the age of 80, the annual RMDs will have crept up to nearly 5%, and by 84 nearly 6% of your account must be withdrawn each year.
My hiking buddy’s account consists largely of stocks paying low or no dividends. To meet his RMDs, he would be required to sell some of his positions at a valuation that on average is 40% below that of just a year ago.
Here is another ugly aspect of RMDs: if you are like me, you hold investments that provide a double-digit yield on cost. By liquidating those positions, I lose a very attractive income flow.
I’ll anticipate the reaction of those that adhere to the shibboleth, “you can’t take it with you.” I get that, but I don’t know my expiration date. (If I did, I might be spending a great deal more, or less, at this juncture.) Furthermore, how about readers that wish to pass along their wealth to following generations, or that have a spouse that depends upon their account?
I propose that there is a means to counter the ill effect that RMDs can have on your retirement accounts, provided you design your portfolio to meet the challenge.
A Quick Review Of RMDs
Those holding IRAs, 401Ks, and other employer-sponsored retirement plans are required to begin lifetime RMDs following the year they reach the age of 72.
RMDs are not eligible for rollovers and must be withdrawn. However, taxes are not required to be withheld at the time of withdrawal. Following a distribution, you can delay filing taxes until you file your annual Federal tax return.
Failure to withdraw the minimum required amount results in a federal penalty consisting of an excise tax equal to 50% of the minimum amount plus interest.
The RMD is calculated by a formula that translates into a percentage of the retirement accounts, and it increases annually. At the age of 72, the percentage is 3.65%. By age 75, the RMD is 4.06%, by age 80 it is nearly 5%, and it is close to 6% at age 84.
How RMDs Can Wreck Your Portfolio
One strategy would be to simply create a portfolio that increases at a greater rate than the required RMD withdrawals. While we would likely meet with reasonable success during bull markets, bear markets might force us to liquidate positions to meet RMDs. However, an account weighted with dividends could shield us from the potential toll created by RMDs.
Allow me to use my retirement accounts as an example. The average yield for my portfolio is 4.4%, so that means (assuming that figure holds for the next decade) that I can meet my annual RMDs until I reach the age of 78 with dividend income alone. However, from that day forward, I will be forced to sell shares to meet my RMDs. At 80, I would be required to sell 1% of my portfolio each year, and at age 84, I would be forced to liquidate 2% of my positions on an annual basis.
Another concern is that many of my stocks now provide a very high yield to cost. That means I, or an investor in a similar position, could lose a relatively large income stream by being forced to sell shares to meet RMDs.
Here are a few yield on cost examples I’m providing for stocks that are favored by many investors. Each case is over a ten-year period.
Author / Seeking Alpha Data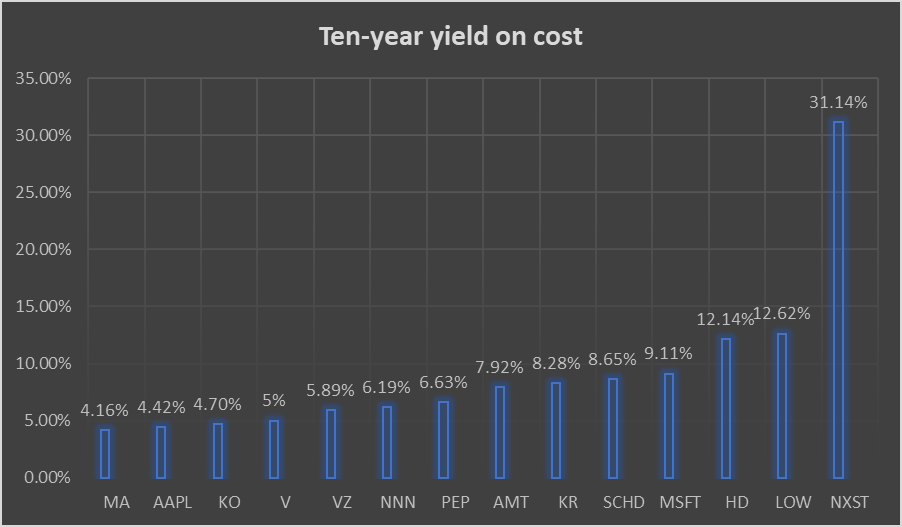
(In order of listing: Mastercard (MA), Apple (AAPL), Coca-Cola (KO), Visa (V), Verizon (VZ), National Retail Properties (NNN), PepsiCo (PEP), American Tower (AMT), Kroger (KR), Schwab U.S. Dividend Equity ETF (SCHD), Microsoft (MSFT), Home Depot (HD), Lowe’s (LOW), Nexstar Media (NXST))
When evaluating the chart, consider that Verizon shares were selling at a premium relative to today while Microsoft was out of favor ten years ago.
My purpose in providing the yield on cost figures is to emphasize the magnitude of the income stream investors would lose should they be forced to liquidate positions due to RMDs. However, this chart also highlights the results of practices that are common among investors.
For example, settling for a relatively robust yield ten years ago in Verizon results in lagging income today relative to over half the displayed tickers.
The chart also points to the strength of dividend investing and a buy and hold strategy.
Obviously, those with longer holding periods would face greater losses in terms of yield on cost. I’ve illustrated the potential RMDs have to damage one’s portfolio. Now let me provide a solution to the problem.
Sometimes The Best Investment Ain’t The Best Investment
There seems to be an eternal debate among investors regarding which investing strategies provide the best returns. Value or growth? Buy and hold or rebalance your portfolio periodically? High yield or dividend growth stocks?
Whatever strategy you pursue, it cannot be denied that if your portfolio does not provide a level of income above the required RMD in a given year, then you must liquidate a portion of your investments. Therefore, stocks with prospects of high growth that provide little or no dividend income may result in lesser gains in your portfolio over the long run.
I propose that by focusing on certain high yield investments in the years leading up to your 72nd birthday you can preserve your portfolio.
Let me emphasize that I am not one that seeks high yield investments. However, in my recent article outlining my portfolio, I advised readers that I am embracing two differing investment strategies: I am pursuing dividend growth investments for my taxed accounts, and I am adopting a relatively high yield investment strategy for my 401k / 457 accounts.
It is important to note that I am a half decade away from my first RMDs, and I do not advocate a high yield strategy for those with longer time spans before their RMD date.
A list of prospective investments follows.
The Bank of Nova Scotia (BNS)
- Yield 6.19% 5-year dividend growth rate 6.07%
U.S. Bancorp (USB)
- Yield 4.44% 5-year dividend growth rate 10.29%
Global Finance ranks The Bank of Nova Scotia among the five safest banks in North America. About 40% of the firm’s revenue stems from Canada, while most of the remainder is generated in Mexico, Chile and Peru.
Safest Banks in North America 2021 (Global Finance)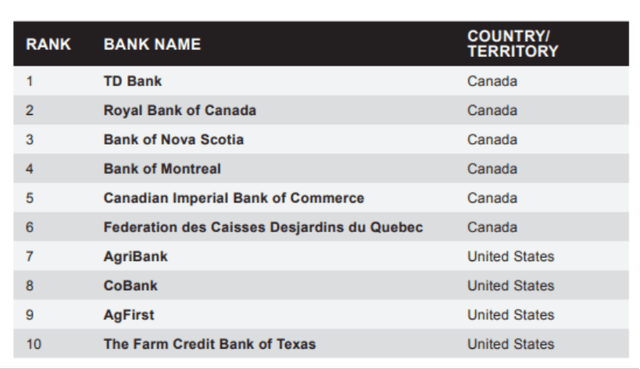
The bank’s debt is rated High Grade/ Investment Grade by Moody’s and Fitch, and the BNS has paid a dividend since 1833.
The bank’s domestic operations focus on mortgages and auto lending, with BNS leading market share in auto loans.
Another bank I favor is USB. I initiated a position in U.S. Bancorp a week ago, and I discovered today that the stock is among Charlie Munger’s five largest investments. USB has consistently posted returns on equity well above peers and its own cost of equity for at least 15 years.
U.S. Bancorp does not have the same rate sensitivity as peers. Consequently, the bank benefits less than most financial institutions as rates rise. However, this is balanced by the bank’s payments and trust businesses. Those divisions tend to outperform when interest rates fall.
Testimony to the firm’s outstanding management lies in the fact that U.S. Bancorp never reported an unprofitable quarter throughout the 2007/2008 subprime mortgage crisis.
Enbridge Inc. (ENB)
- Yield 6.8% 5-year dividend growth rate 8.65%
ONEOK, Inc. (OKE)
- Yield 6.15% 5-year dividend growth rate 6.58%
ENB transports over 70% of Canada’s takeaway capacity in heavy crude. The firm also operates the second largest natural gas pipeline network in the U.S.
Since contracted services comprise 98% of the company’s revenue, ENB has minimal exposure to gyrations in crude prices.
The firm has 67 years of dividend payments to its credit, with an average annual dividend growth of nearly 12% over the past 20 years. ENB also has investment grade credit ratings.
Like Enbridge, ONEOK’s revenue is largely based on contracts. Furthermore, over 80% of the company’s clients have investment grade credit ratings.
OKE operates processing plants, storage facilities and fractionators, but its bread and butter lies in the firm’s NGL gathering system. Covering approximately 38,000 miles, it provides connections to 90% of the processing plants in the midcontinent.
Like ENB, ONEOK has investment grade credit ratings.
Ares Capital (ARCC)
- Yield 10.08% 5-year dividend growth rate 1.95%
Owl Rock Capital Corporation (ORCC)
- Yield 10.26% 5-year dividend growth rate N/A
ARCC and ORCC are Business Development Companies (BDCS). BDC’s must distribute over 90% of their profits to shareholders and are required to invest at least 70% of assets in the debt and/ or equity of U.S. businesses with market values below $250 million.
Their use of leverage and focus on smaller or distressed companies means many BDC’s have a higher degree of risk than many potential investments. However, since banks are often unable to lend to this segment, that also means BDCs can demand higher returns.
Ares is the largest BDC and has a sterling track record. ARCC has investment grade debt and well laddered debt maturities.
The company also maintains conservative leverage and has an excellent track record of minimal loan losses. At the end of last quarter, less than 1% of ARCC’s total investment portfolio were on non-accrual status.
ARCC Q3 Investor Presentation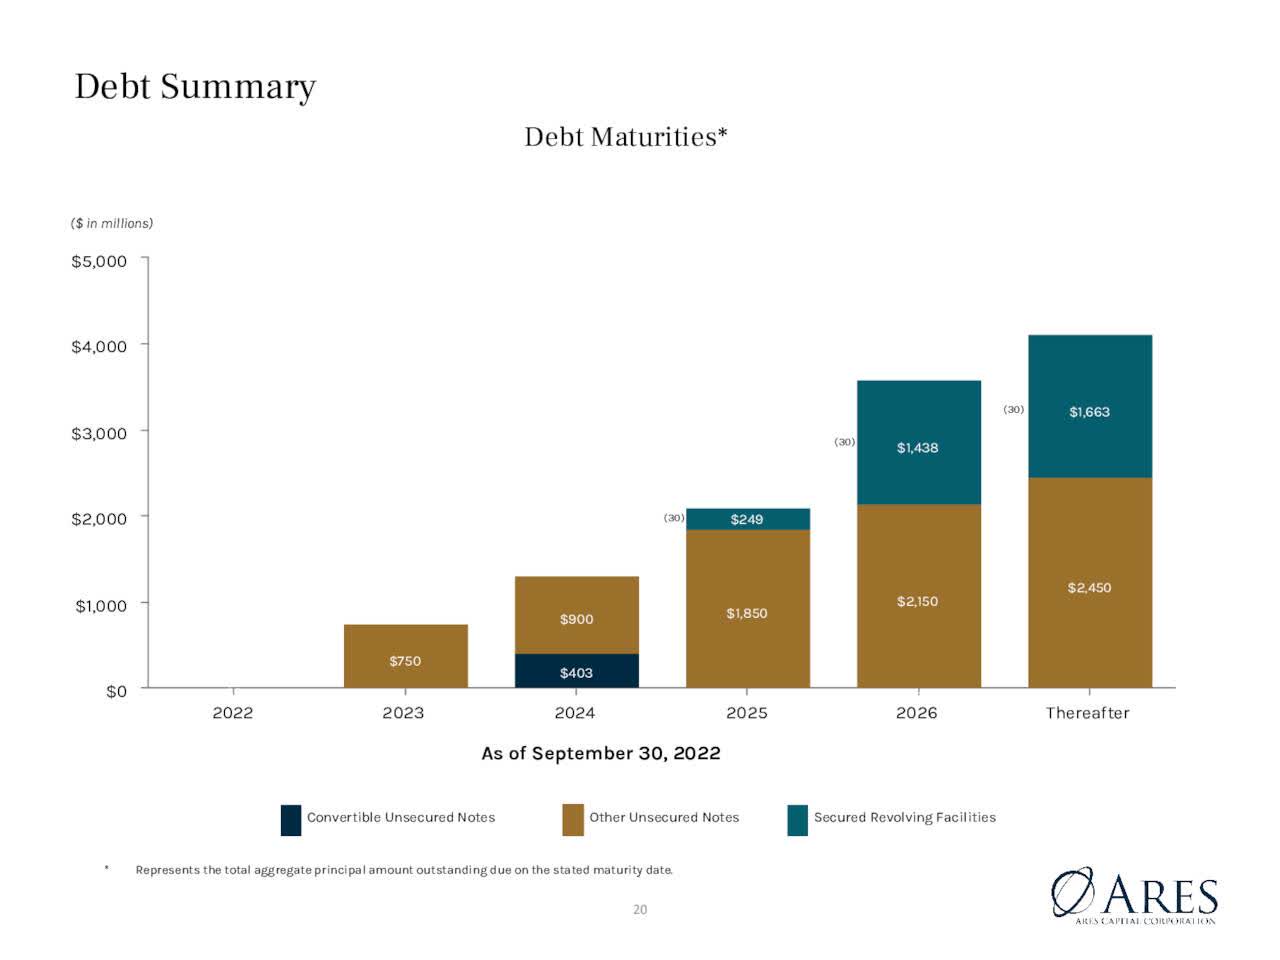
The following chart gives insight into the diversified nature of ARCC’s backlog and pipeline.
ARCC Q3 Investor Presentation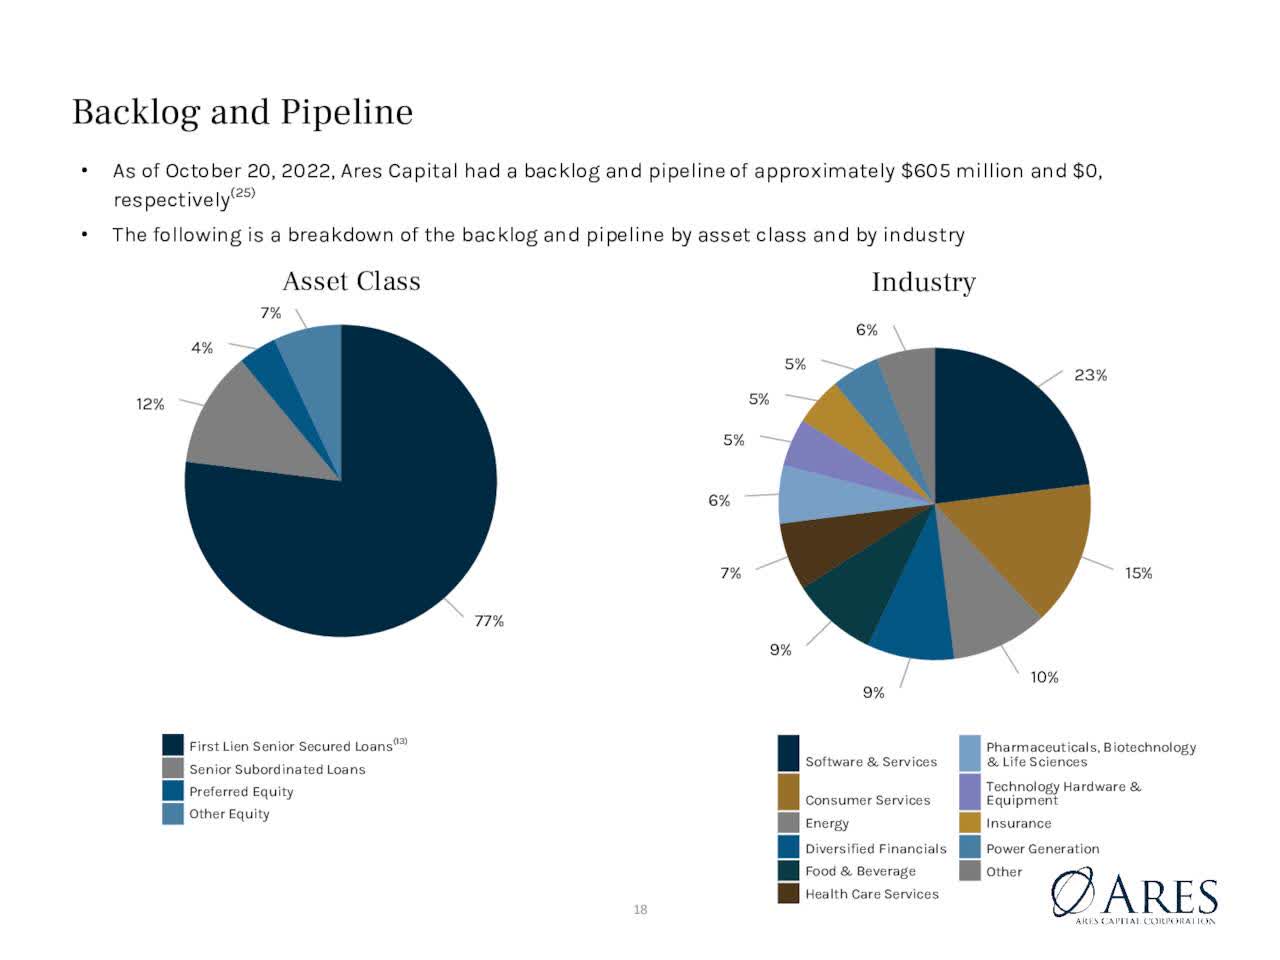
ORCC is a relative newcomer to this space, but it now ranks as the third largest BDC. ORCC has recorded an enviable record: since its inception, it has maintained a loan loss rate of less than 15 basis points per year.
Like ARCC, ORCC has operates with conservative leverage and maintains an investment grade credit rating from the leading agencies.
ORCC Q2 2022 Investor Presentation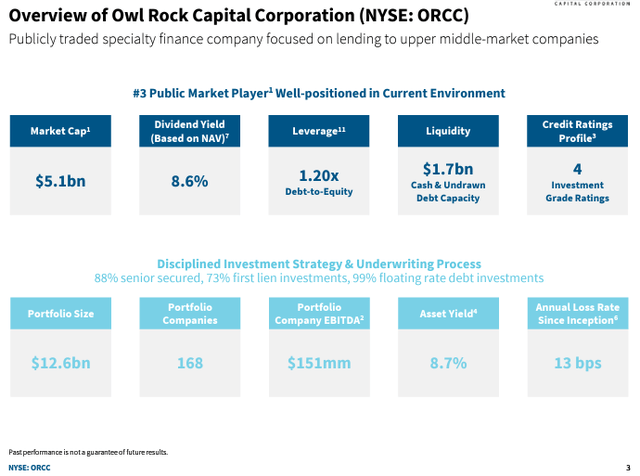
During the recent earnings call, management reported ORCC notched the highest quarterly NII since the first quarter of 2020. ORCC’s investments lean heavily to first lien loans supported by significant equity cushions, with an average loan-to-value ratio of roughly 45%.
I note that the top-notch BDCs recorded solid results during the pandemic inspired market downturn, yet their share valuations plummeted. I will posit that we could see a repeat of that scenario should the market suffer a significant decline in the coming months.
National Retail Properties, Inc. (NNN)
- Yield 5.01% 5-year dividend growth rate 3.04%
Essex Property Trust, Inc. (ESS)
- Yield 4.24% 5-year dividend growth rate 4.87%
Here we have two stalwarts: REITs that are also Dividend Aristocrats.
It might surprise you that NNN has a 25-year average annual total return of 11.6%. Not too shabby for an investment that is noted for providing a steady, robust dividend.
NNN is well diversified from a geographic perspective, with 3,305 properties and more than 33 million square feet of leasable space. Last quarter the company posted occupancy levels of 99.4%, well above the REIT’s long-term average of roughly 98%.
NNN Investor Presentation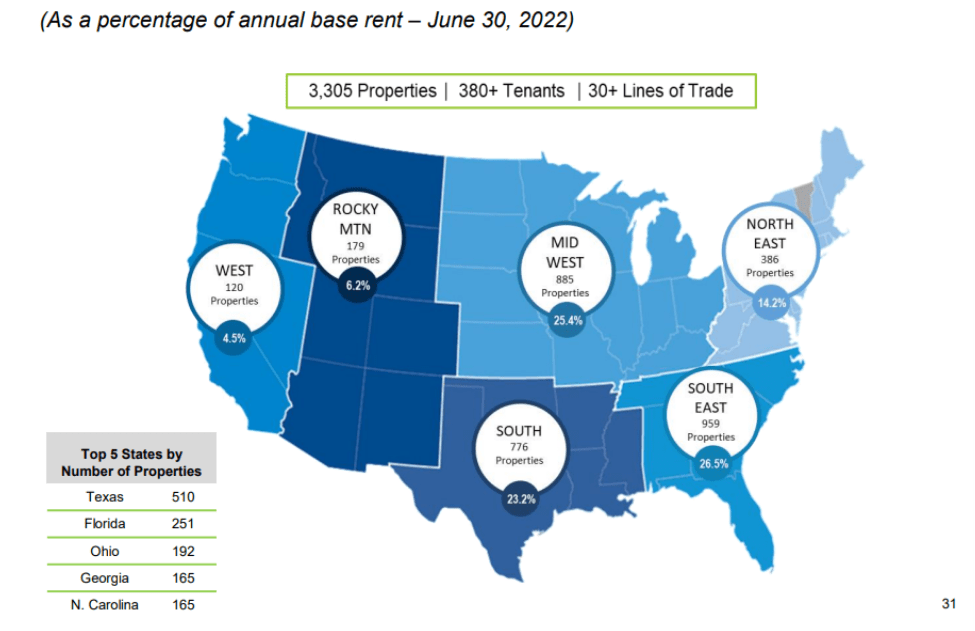
Reviewing NNN’s debt maturity schedule reveals a strong balance sheet with a weighted average debt maturity of 14.5 years.
NNN Investor Presentation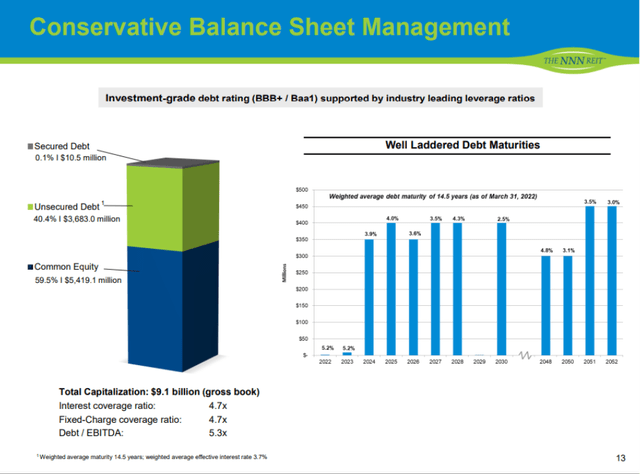
Essex is a REIT that operates in 8 major West Coast markets. With 253 apartment communities and 62,000 units, ESS focuses on high-end apartments with average monthly rents approaching $2,800. Like NNN, the debt Essex holds is well laddered with a weighted average interest rate of 3.2%.
ESS Investor Presentations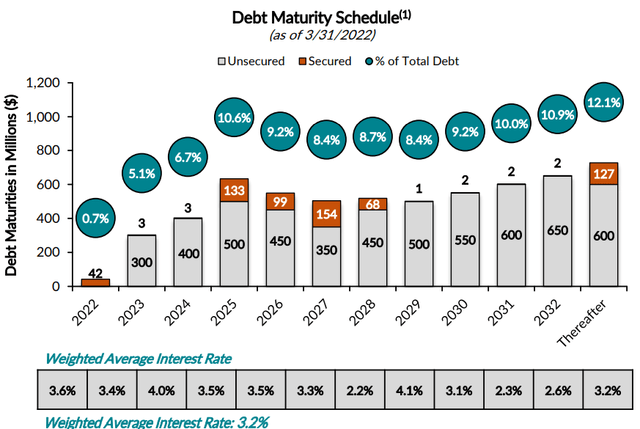
Essex currently trades at a 30% discount to NAV.
Summation
The toll RMDs may take on your retirement account can depend largely on your portfolio’s average yield. For investors that favor high growth, low yield stocks, RMDs could begin to cut into holdings at a relatively early age. I propose that investing in high yield stocks can kick the date RMD can down the road, preserving your portfolio and maintaining the income derived from your investments.
Perhaps you are of the opinion that losing a portion of your portfolio at the age of 75 is of little consequence. I will readily admit that I do not know my “expiration date.” However, if I did, I might be spending a great deal more, or just a little less.
Aside from providing for their own retirement needs, investors should consider that their spouse may rely on their retirement funds. Furthermore, I would much prefer leaving my hard-earned money to my descendants. While high yield investments may not qualify as the “best” investments, they will serve me well in preserving my portfolio.
The markets rise, and the markets fall, but my stream of passive income continues to grow.
Be the first to comment