

solarseven/iStock via Getty Images
By Tajinder Dhillon
U.K. equities have generally underperformed their global peers consistently over the last decade. The FTSE All Share has experienced a compound annualized growth rate (CAGR) of 4.7% and 7.3% over the last 5 and 10 years respectively. In comparison, the Russell 1000 CAGR over this same period is 16.5% and 14.9%, while the Datastream World Market CAGR is 11.1% and 9.9% respectively.
The start of 2022 has been one of the most volatile on record which we highlight in a prior note (Data Insight: A Turbulent Start to the Year for Global Equities, January 27, 2022). To this point, the range of returns to begin the year has been dramatic, with many indices declining upwards of 20% at one point.
However, U.K. equities have been one of the stronger markets year-to-date, outperforming most of its European counterparts as shown in Exhibit 1. The FTSE 100 has gained 3.1% in local currency terms compared to a decline of 4.7% for the STOXX 600 index.
Exhibit 1: Year-to-date Performance for Global Benchmarks
Refinitiv Datastream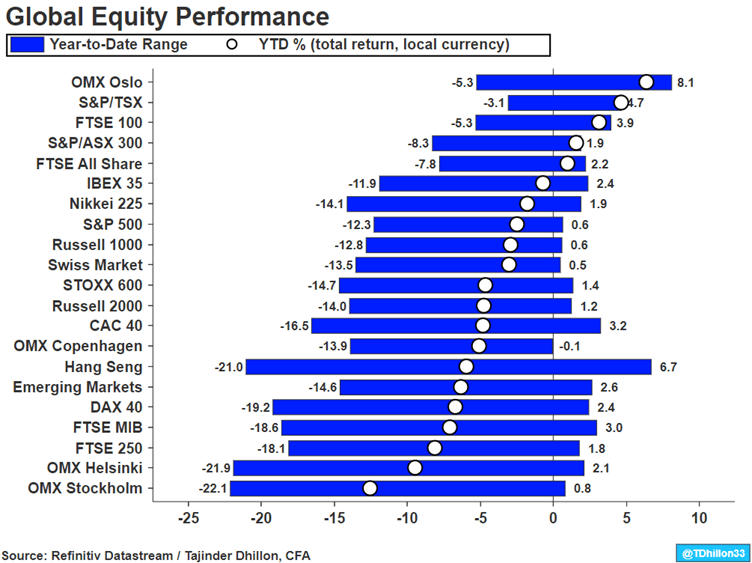
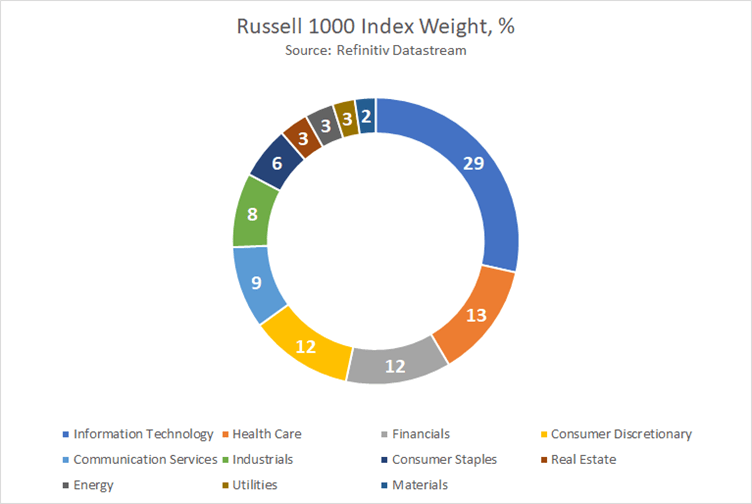
Part of this outperformance can be explained by the index composition of the FTSE 350 given its higher weight to Financials and Energy, which are well-positioned to benefit from higher interest rates and commodity prices.
In a higher interest rate environment, growth tends to underperform while value-oriented sectors outperform. The FTSE 350 has an immaterial weight of 1.7% within Information Technology, the smallest of any sector. This provides a shield to investors who are looking to position away from growth and into value. In comparison, the Russell 1000 Index has a 28.3% weight in Information Technology. Index weights for FTSE 350 and Russell 1000 are provided in Exhibit 2.
Financials are positioned to benefit in the long-term as interest rates rise, which make up the largest component in the FTSE 350 at an 18.5% weight. To put this exposure in perspective, only the S&P/TSX Composite has a higher financial exposure at a 32.0% weight.
Higher inflation has led to higher commodity prices across precious metals, industrial metals, and agriculture. Energy is the sixth largest component in the FTSE 350 Index with a 9.8% weight compared to only a 3.7% weight within the Russell 1000 Index.
Exhibit 2: FTSE 350 & Russell 1000 Index weights by sector, %
Author Author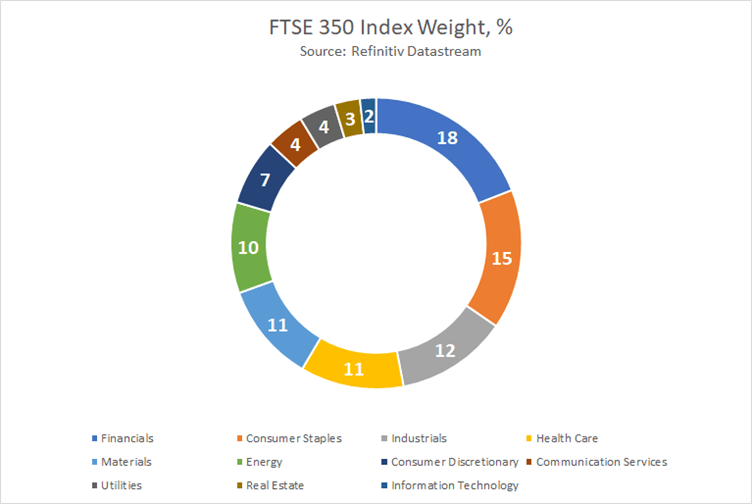
As mentioned, U.K. equities have generally underperformed its global peers, thus being consistently undervalued on a forward P/E basis as shown in Exhibit 3. The current forward P/E for the FTSE 350 is 11.5x, which is 14.2% below its 10-year average of 13.4x.
The Russell 1000 Index is trading at a forward P/E of 19.2x, a 67.0% premium to the FTSE 350, while the STOXX 600 and S&P/TSX are trading at 14.1x and 13.3x respectively.
For believers in ‘reversion to the mean’, these disparities in valuation multiples will contract eventually which may allow for non-U.S. markets to outperform on a relative basis in the future.
Exhibit 3: Forward P/E Ratio
Refinitiv Datastream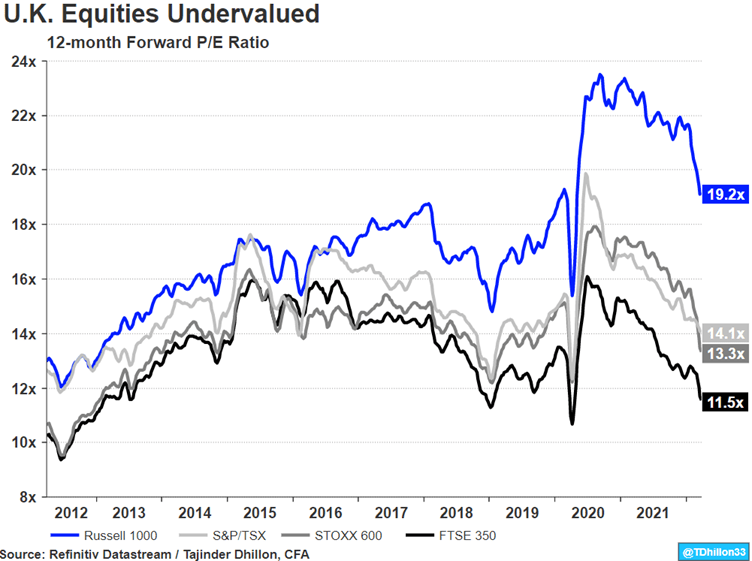
Even though the FTSE 350 is undervalued on a forward P/E basis, it provides the highest dividend yield out of the selected indices shown in Exhibit 4. Using Refinitiv Datastream Indices, the aggregate U.K. equity market offers a 3.6% dividend yield given the higher relative weights in Financials, Energy, and defensive based sectors such as Consumer Staples.
Exhibit 4: Refinitiv Datastream Indices – Dividend Yield
Refinitiv Datastream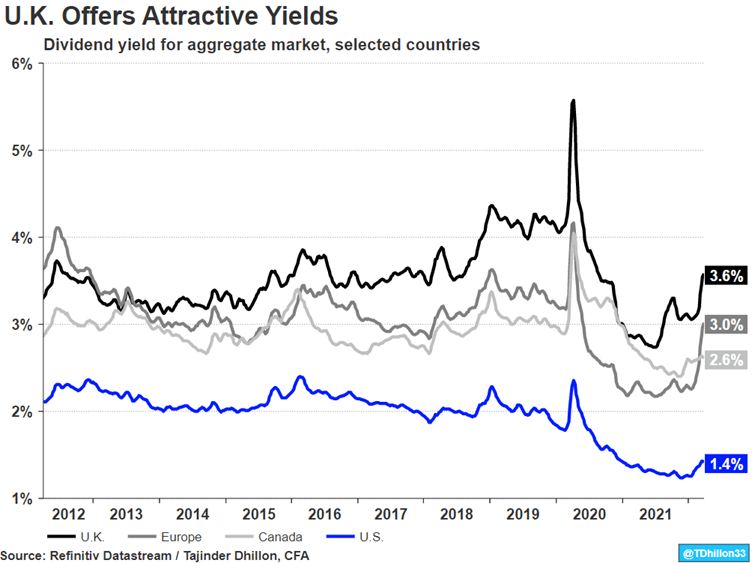
While the case for U.K. equities looks appealing from a valuation and dividend yield perspective, the island is facing one of the largest squeezes in cost-of-living standards given higher inflation and commodity prices.
Petrol prices are at record levels (£1.65/litre), wholesale energy prices have sharply risen, consumer confidence is declining rapidly, while the personal savings rate in the U.K. has declined from a record high of 23.7% in Q2 2020 to 8.6% in Q3 2021.
Despite the Bank of England raising interest rates by 65 basis points over the last three months, inflation expectations remain high as the five-year inflation swap rate is 5.0%, significantly higher than the 3.5% and 3.2% in U.S. and Europe.
A look at U.K. Fund Flows
Dewi John, Head of Lipper Research, U.K. & Ireland, at Refinitiv has concluded that taking mutual fund and ETF flows during 2021 as an indicator, investors are shunning U.K. equities, despite their decent performance over the year: Equity U.K.[1] funds returned an average 17.4%, a few basis points ahead of Equity Europe ex U.K., although well behind Equity US’ 24.4%.[2]
Despite this, U.K. investors dumped £9.8bn-worth of Equity U.K. over 2021. However, global negative flows were a touch lower, at £8.7bn, indicating ex-U.K. investors have increased their allocations.
Because of the attractive dividend story outlined above, there is growing speculation that Equity U.K. Income is about to return to favour. Investors, however, remain unconvinced, with outflows of £8.2bn, all attributable to domestic investors, as non-U.K. flows remain flat for the year. That doesn’t seem to have abated as a result of the U.K.’s more resilient start to 2022, as global outflows from Equity U.K. were £2.8bn, and for Equity U.K. Income £575m.
The ‘income’ part of the flows is dominated by active money, whereas it’s a more even split between actives and passives with Equity U.K.
[1] Lipper Global Classification
[2] FY2021, net return in GBP terms.
Conclusion
Certainly, a case for U.K. equities appears from a valuation and yield perspective. How this will be balanced against a cost-of-living crisis, higher inflation and rising interest rates remain to be seen. To complicate matters further, Sterling has declined from 1.37 (£/$) to 1.31 since the beginning of the year which may provide a tailwind for large-cap multinationals.
Even with an attractive valuation and yield environment, fund flows do not appear to be rushing into U.K. equity funds. All in all, this setup may provide opportunities for the long-term value investor if reversion to the mean eventually occurs.
Editor’s Note: The summary bullets for this article were chosen by Seeking Alpha editors.
Be the first to comment