

CalypsoArt
Companies with a track record of growing dividends tend to outperform the market. Management’s announcement of dividend increases signifies strong business performance and a commitment to shareholder rewards. I monitor companies with a proven history of dividend growth to provide you with up-to-date information on pending increases. The lists below offer valuable insights on stocks that will raise their dividends in the coming week. This information is particularly relevant in today’s inflationary environment.
This list is a trimmed-down version, only covering dividend increases. A full upcoming dividend calendar is always available here.
How I Created The Lists
I created the information below by combining the “U.S. Dividend Champions” spreadsheet hosted here with upcoming dividend information from NASDAQ. This meshes metrics about companies with dividend growth history with upcoming dividend payments. These companies all have a minimum five-year dividend growth history.
Companies are required to have higher total dividends paid out each year. Therefore, a company may not raise its dividend each calendar year, but the total annual dividend can still increase.
What Is The Ex-Dividend Date?
The ex-dividend date marks the cutoff point for eligibility to receive the upcoming dividend or distribution. To qualify, you must have purchased shares by the close of the preceding business day. For example, if the ex-dividend date falls on a Tuesday, you must have bought (or already owned) the shares by the market close on Monday. Note that if the ex-dividend date is on a Monday (or a Tuesday if Monday is a holiday), you must have acquired the shares by the prior Friday.
Dividend Streak Categories
Here are the definitions of the streak categories, as I’ll use them throughout the piece.
- King: 50+ years
- Champion/Aristocrat: 25+ years
- Contender: 10-24 years
- Challenger: 5+ years
| Category | Count |
| King | 0 |
| Champion | 3 |
| Contender | 4 |
| Challenger | 2 |
The Dividend Increasers List
Data has been sorted by the ex-dividend day (ascending) and then by the streak (descending):
| Name | Ticker | Streak | Forward Yield | Ex-Div Date | Increase Percent | Streak Category |
| WEC Energy Group, Inc. | (WEC) | 20 | 3.4 | 13-Feb-23 | 7.14% | Contender |
| Otter Tail Corporation | (OTTR) | 9 | 2.6 | 13-Feb-23 | 6.31% | Challenger |
| AFLAC Incorporated | (AFL) | 41 | 2.38 | 14-Feb-23 | 5.00% | Champion |
| Enbridge Inc | (ENB) | 26 | 8.98 | 14-Feb-23 | 3.65% | Champion |
| International Bancshares Corporation | (IBOC) | 14 | 2.56 | 14-Feb-23 | 5.00% | Contender |
| Amgen Inc. | (AMGN) | 12 | 3.55 | 14-Feb-23 | 9.79% | Contender |
| Eli Lilly and Company | (LLY) | 9 | 1.33 | 14-Feb-23 | 15.31% | Challenger |
| Chevron Corporation | (CVX) | 36 | 3.55 | 15-Feb-23 | 6.34% | Champion |
| Avista Corporation | (AVA) | 20 | 4.33 | 16-Feb-23 | 4.55% | Contender |
Field Definitions
Streak: Years of dividend growth history are sourced from the U.S. Dividend Champions spreadsheet.
Forward Yield: The new payout rate is divided by the current share price.
Ex-Dividend Date: This is the date you need to own the stock.
Increase Percent: The percent increase.
Streak Category: This is the overall dividend history classification of the company.
Show Me The Money
Here’s a table mapping the new rates versus the old rates. It also reiterates the percentage increase. This table is sorted the same way as the first table (ex-dividend day ascending, dividend streak descending).
| Ticker | Old Rate | New Rate | Increase Percent |
| WEC | 0.728 | 0.78 | 7.14% |
| OTTR | 0.412 | 0.438 | 6.31% |
| AFL | 0.4 | 0.42 | 5.00% |
| ENB | 0.631 | 0.654 | 3.65% |
| IBOC | 0.6 | 0.63 | 5.00% |
| AMGN | 1.94 | 2.13 | 9.79% |
| LLY | 0.98 | 1.13 | 15.31% |
| CVX | 1.42 | 1.51 | 6.34% |
| AVA | 0.44 | 0.46 | 4.55% |
Additional Metrics
Some different metrics related to these companies include yearly pricing action and the P/E ratio. The table is sorted the same way as the table above. A value investor may find stock ideas with those companies near their 52-week lows, as they could provide more margin of safety and inflated yield.
| Ticker | Current Price | 52 Week Low | 52 Week High | PE Ratio | % Off Low | % Off High |
| WEC | 91.67 | 79.55 | 106.5 | 24.61 | 15% Off Low | 14% Off High |
| OTTR | 63.56 | 52.2 | 81.84 | 17.25 | 22% Off Low | 22% Off High |
| AFL | 70.47 | 51.43 | 74.02 | 7.06 | 37% Off Low | 5% Off High |
| ENB | 39.55 | 34.48 | 46.22 | 46.92 | 15% Off Low | 14% Off High |
| IBOC | 46.81 | 37.5 | 53.71 | 13.26 | 25% Off Low | 13% Off High |
| AMGN | 240.24 | 209.61 | 294.64 | 18.27 | 15% Off Low | 18% Off High |
| LLY | 340.7 | 229.7 | 384.44 | 24.13 | 48% Off Low | 11% Off High |
| CVX | 170.07 | 127.3 | 188.22 | 0 | 34% Off Low | 10% Off High |
| AVA | 40.6 | 35.31 | 45.45 | 20.94 | 15% Off Low | 11% Off High |
Tickers By Yield And Growth Rates
I have arranged the table in descending order by yield for investors who prioritize current yield. As a bonus, the table also features some historical dividend growth rates. Moreover, I have incorporated the “Chowder Rule,” which is the sum of the current yield and the five-year dividend growth rate.
| Ticker | Yield | 1 Yr DG | 3 Yr DG | 5 Yr DG | 10 Yr DG | Chowder Rule |
| ENB | 8.98 | -0.8 | 6.2 | 7.5 | 8.9 | 16.2 |
| AVA | 4.33 | 4.2 | 4.3 | 4.3 | 4.3 | 8.5 |
| AMGN | 3.55 | 10.2 | 10.2 | 11 | 18.4 | 14.5 |
| CVX | 3.55 | 7 | 6.1 | 5.6 | 4.9 | 9.1 |
| WEC | 3.4 | 7.4 | 7.2 | 7 | 9.3 | 10.4 |
| OTTR | 2.6 | 5.8 | 5.6 | 5.2 | 3.3 | 7.8 |
| IBOC | 2.56 | 4.4 | 4.6 | 12.7 | 11.6 | 15.2 |
| AFL | 2.38 | 21.2 | 14 | 13 | 9.1 | 15.4 |
| LLY | 1.33 | 15.3 | 15 | 13.5 | 7.2 | 14.8 |
Historical Returns
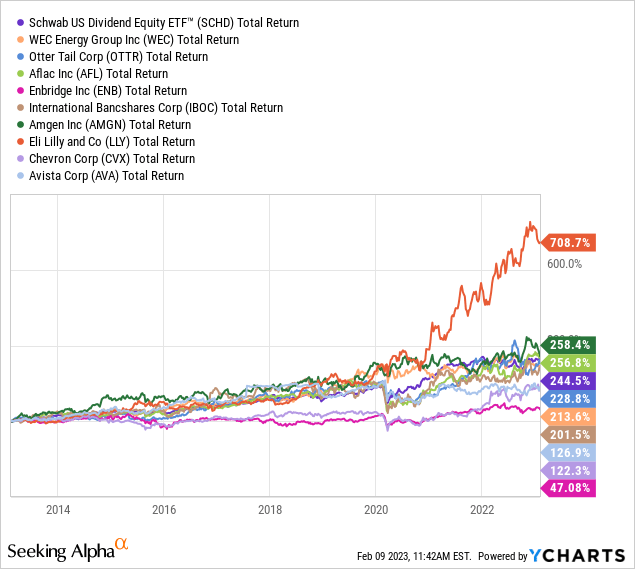
I am constantly seeking out dividend growth stocks with a proven track record of outperforming the market. I use the Schwab U.S. Dividend Equity ETF (SCHD) as my benchmark, as it boasts a solid history of exceptional performance, a higher yield compared to the S&P 500, and a history of growing dividends.
Historically, SCHD has outperformed both companies in question. However, my research stops here, as neither of these companies has consistently surpassed my benchmark over a prolonged period.
Eli Lilly was the huge winner, though most of the outperformance has come in the past two years. Besides LLY, there were several companies that equally performed SCHD. There were also quite a few names, such as ENB, CVX, and AVA, that dramatically underperformed.
Please do your due diligence before investing, and thanks for reading.
Be the first to comment