

peshkov/iStock via Getty Images
It’s been an exceptional few weeks for the market and many investors are breathing a sigh of relief.
Ycharts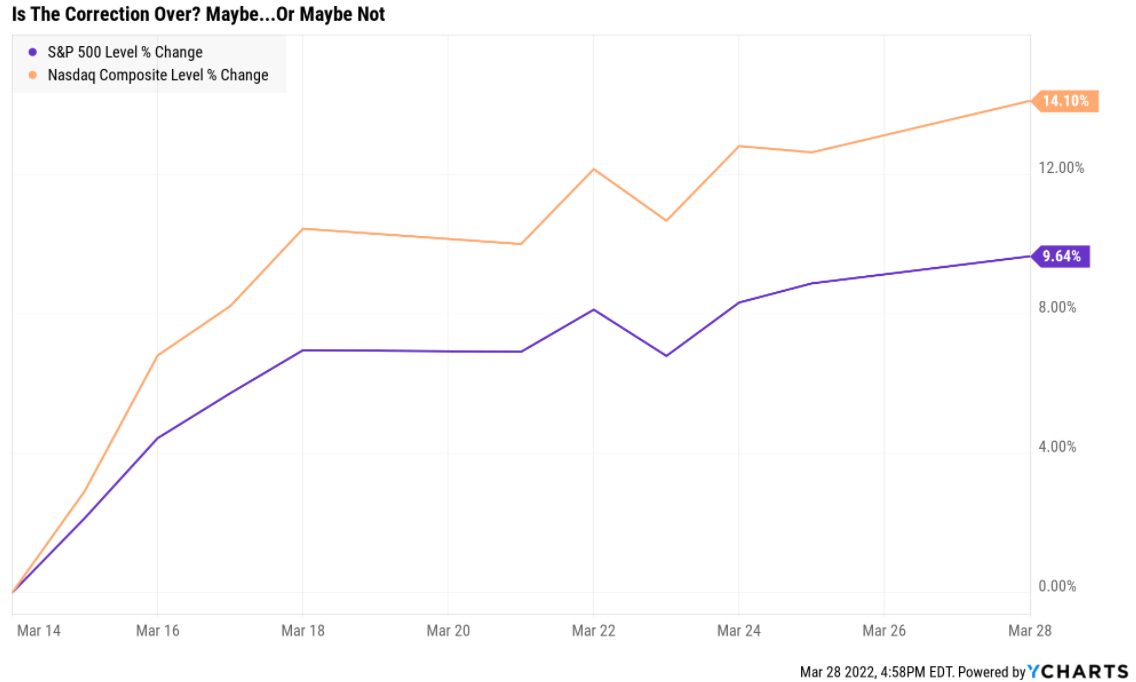
But we can’t forget that market sentiment is fickle, and euphoria can turn into terror rather quickly.
Daily Shot 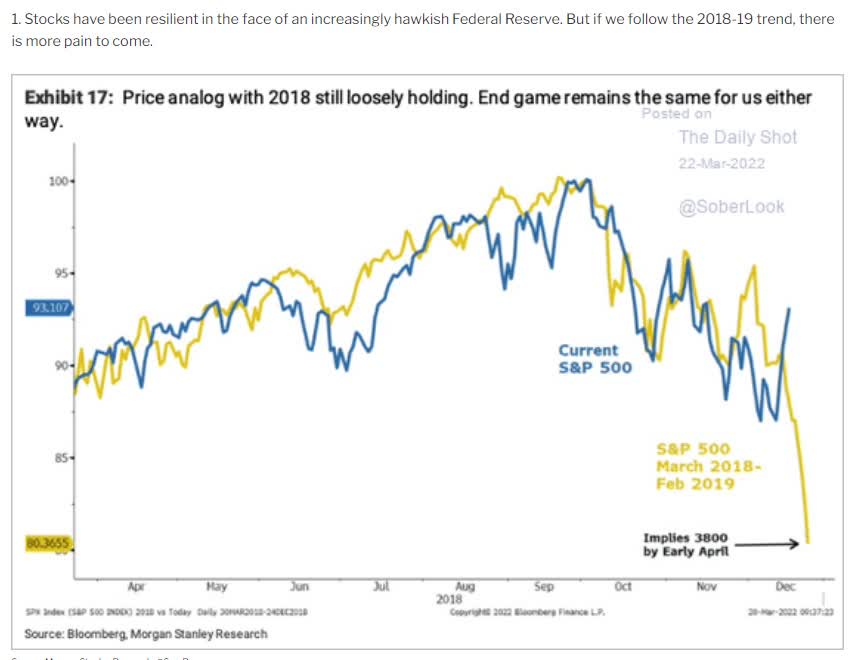
In later 2018 the market crashed 17% in just three weeks, because of a recession scare.
Recession Watch: Good News And Bad News
The bond futures market expects the 10-2 yield curve to invert in June and a mild recession to begin around February 2024.
| Bonds | Yield |
| 3-Month Treasury Yield | 0.58% |
| 2-Year Treasury Yield | 2.35% |
| 10-Year Treasury Yield | 2.49% |
| 10-3M Curve (Most Accurate Recession Forecasting Tool) | 1.91% |
| 10-2 Curve (Most Popular Yield Curve Followed By Wall Street) | 0.14% |
| Bond Futures Pricing In Inversion | June 2022 |
| Bond Futures Pricing In Recession Start | January 2024 |
(Source: DK S&P 500 Valuation & Total Return Tool)
The 10-2 curve is the most closely watched by Wall Street but a study from the NY Fed finds that the 10-3 curve is the most accurate at forecasting recessions.
NY Fed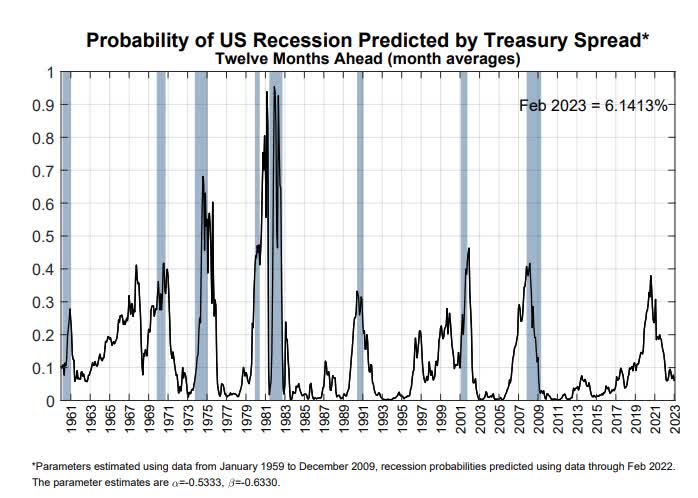
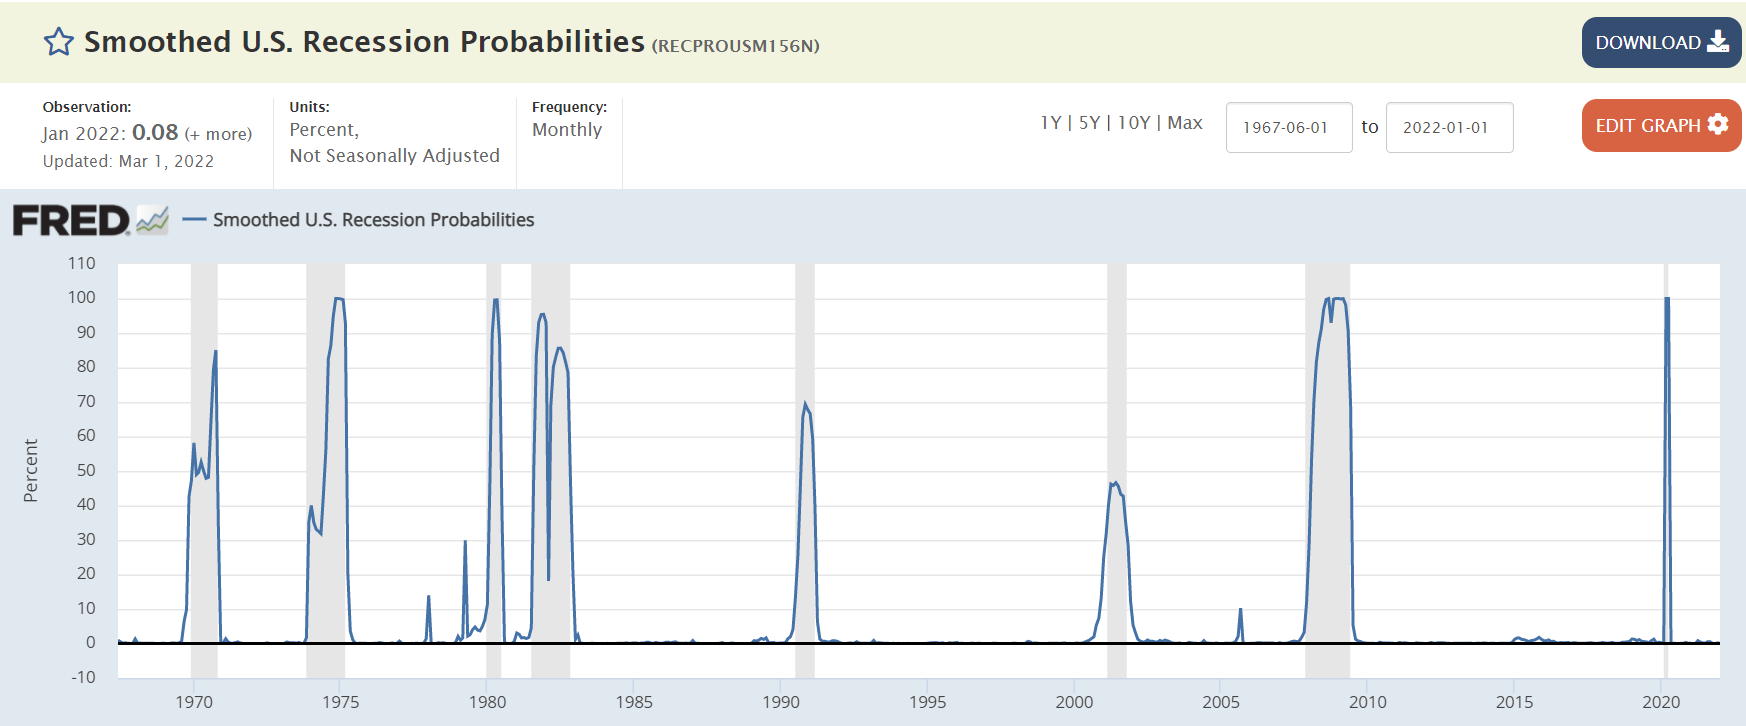
The St. Louis Fed’s model, based on four economic metrics, estimates a 0.08% chance we’re in a recession right now.
Ycharts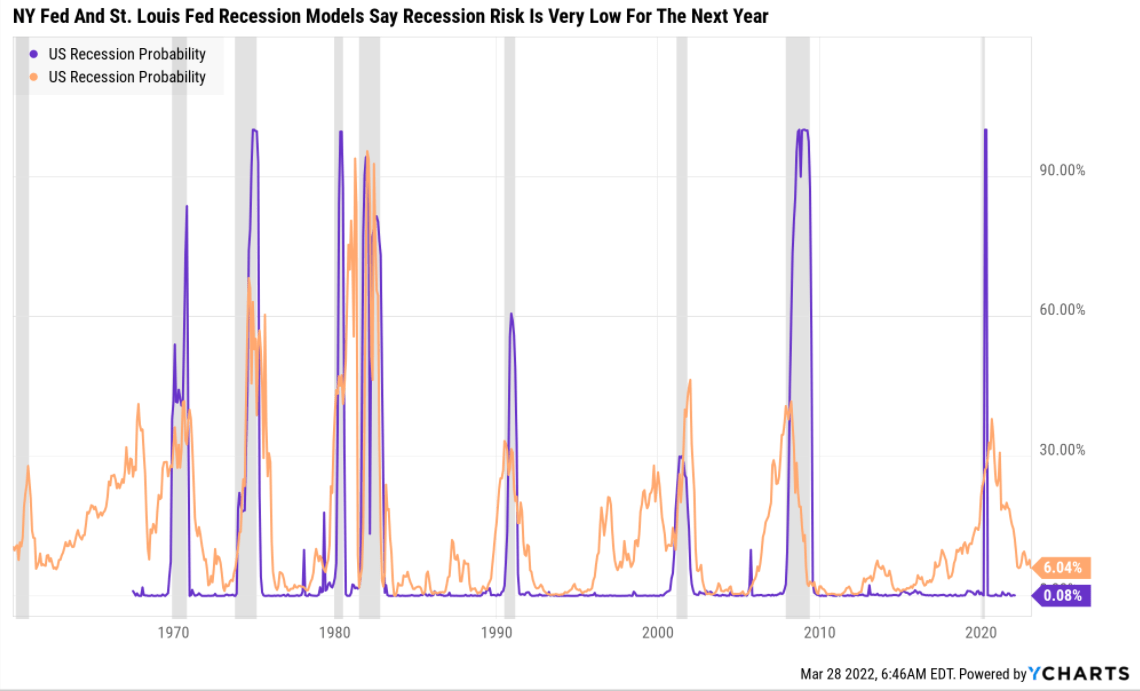
Currently, the bond market is mildly concerned about recession risk and I am monitoring the situation closely each day.
- A recession scare could occur in 2022
- an actual recession could occur in late 2023 or early 2024
- yield curve + BaR economic grid makes it very likely that we’ll see a recession coming at least 10 months out
That’s the good news, a recession isn’t likely anytime soon.
More good news? According to Nuveen, the market generally doesn’t peak until 9 or 14 rate hikes into a tightening cycle.
David Rice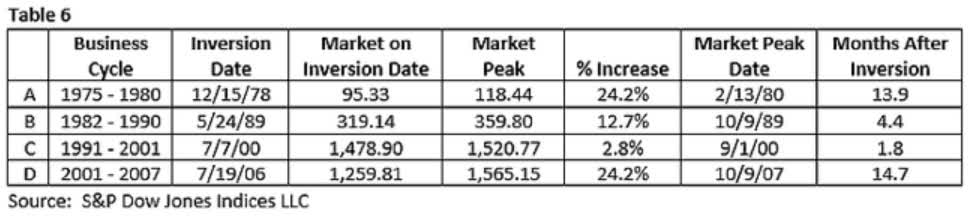
And even when the yield curve inverts, the market still tends to go up a decent amount.
And here’s the great news about preparing for a recession, it’s actually very easy to do.
Smart Investors Never Have To Worry About Recessions
Recessions are as natural as corrections, and planning for them is not any more difficult.
- Part 1: The Nature Of Corrections And Bear Markets
- Part 2: History’s Lessons For The Next Downturn
- Part 3: How I’m Incorporating Bonds Into My Personal Recession Plan (coming March 31st)
- Part 4: How The Fed Plans To Beat Inflation And Avoid A Recession (coming April 7th)
- Part 5: How Recessions Affect Corporate Fundamentals And Dividends (coming April 14th)
- Part 6: How We Forecast And Track Recessions (coming April 21st)
- Part 7: How To Build A Bunker Sleep Well At Night Recession-Resistant Retirement Portfolio (coming April 28th)
The seven-part Dividend Kings Video Special report “Preparing For Recession” series is a step-by-step guide to staying calm, rational, and most of all, safe, whenever the next economic downturn finally arrives.
Because to paraphrase Napoleon, the definition of a stock market genius is
“The person who can do the average thing when everyone else around him/her is losing their mind.”
The only way to sleep well at night is to own a diversified and prudently risk-managed portfolio ahead of time.
“If you fail to plan, you are planning to fail!” – Benjamin Franklin
The time to think about risk (specifically your optimal asset allocation) isn’t when the market is losing its mind and crashing, but when Wall Street is calm, or even euphoric.
“Bull markets are born on pessimism, grow on skepticism, mature on optimism, and die on euphoria.” – John Templeton
The bottom line, there is still time to prepare yourself financially, and emotionally for a recessionary bear market.
Daily Shot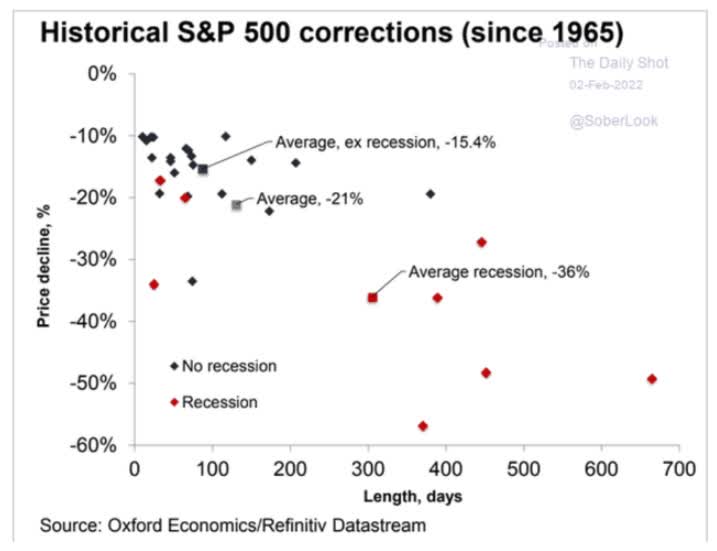
The average recessionary bear market is a 12-month 36% stock decline that takes approximately 24 months to recover from.
- 3 years on average from market top to new record high
Of course, these are merely averages and every recession is different, and we might not even get one for many years.
- The Fed successfully pulled off a soft landing in 1969, 1984 and 1994
But in case we end up with a bear market in 2023 or 2024, here are 7 low volatility, high-yield blue-chips that can help you sleep well at night even if the market crashes 30+%.
How We Find The Best Blue-Chips For Any Need In All Market Conditions
Dividend Kings Research Terminal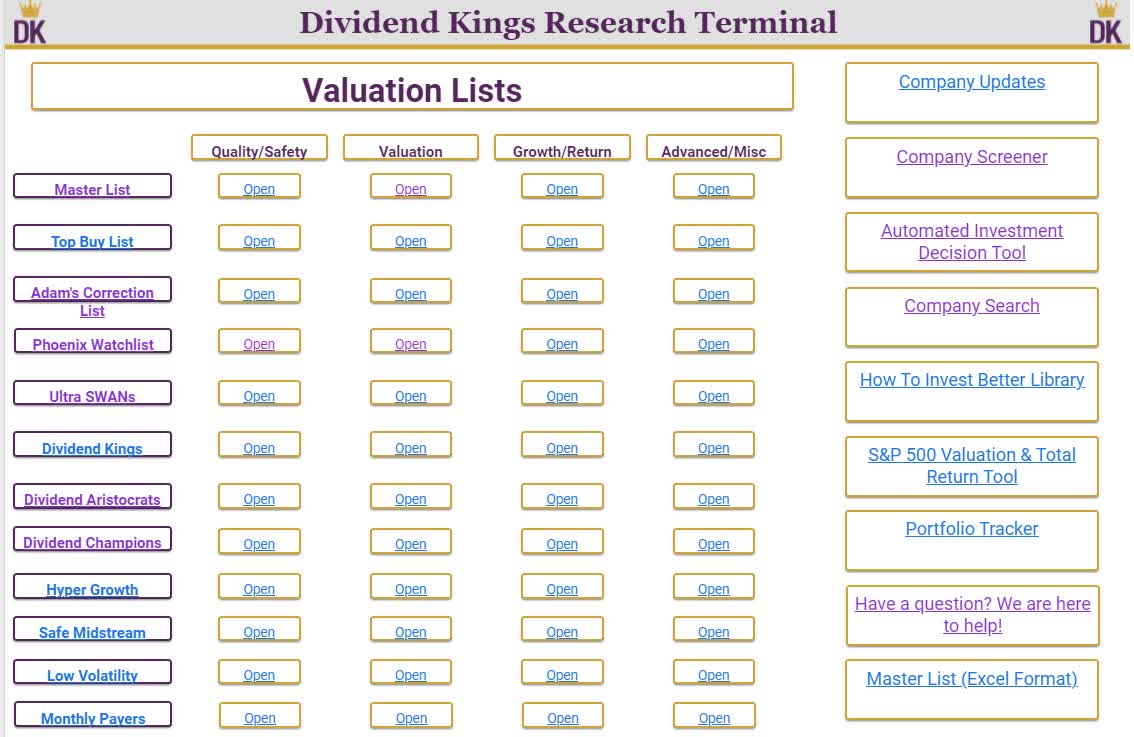
The DK research terminal has a dozen specialty watchlists for every investing goal, time horizon, and risk-profile.
In the coming weeks, we’re introducing a second, simplified version of this terminal that lets you select as many or as few fundamental metrics as you want.
For the best recession-resistant watchlist, I recommend either the Ultra SWAN list or the Phoenix list. Ultra SWANs are companies with 5/5 dividend/balance sheet safety, 3/3 wide moats, and 5/5 exceptional dependability; as close to perfect quality companies as exist on Wall Street.
The Phoenix list is our list of blue-chip quality companies most likely to rise like a Phoenix from the ashes of any recession to soar to new heights.
It’s the one to use if you’re looking for minimal volatility from blue-chip companies.
Phoenix List Sorted By Lowest Volatility (Dividend Kings Research Terminal)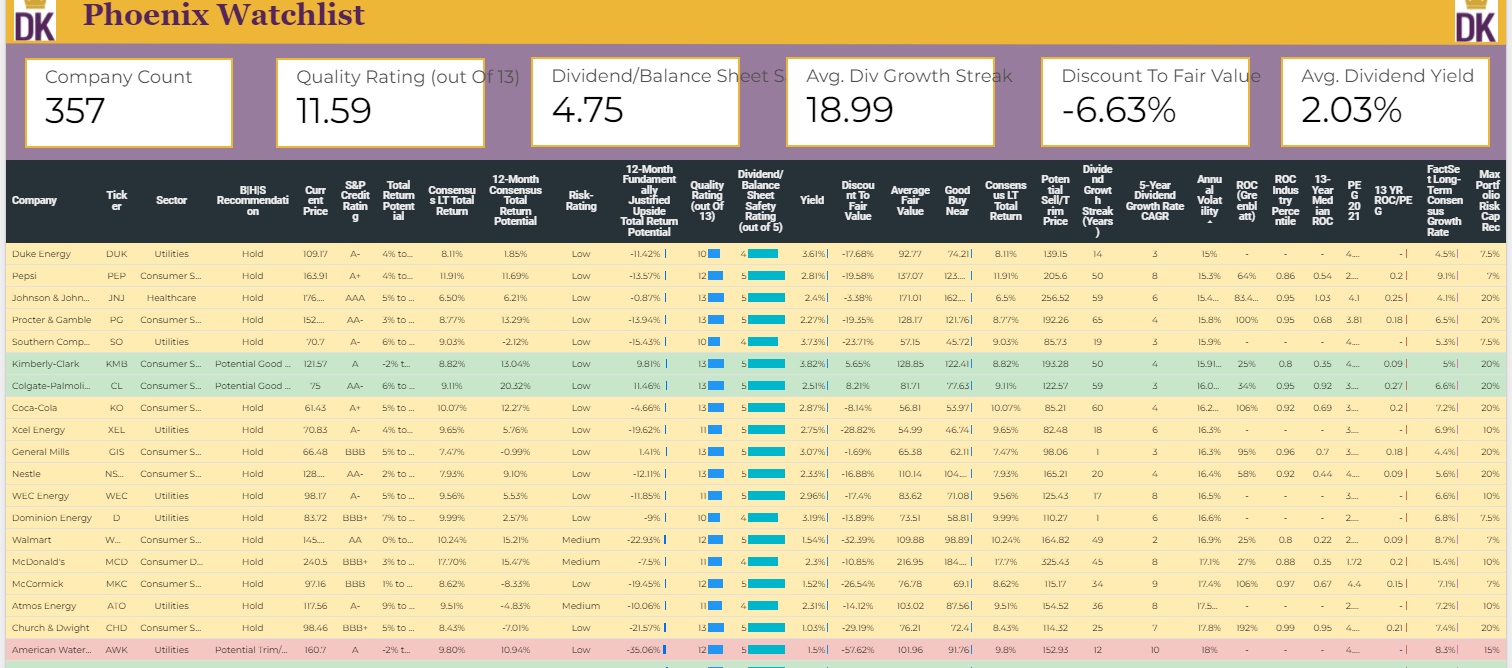
- green = potentially good buy or better
- blue = potentially reasonable buy
- yellow = hold
- red = potential trim/sell
You can sort any watchlist by 16 fundamentals including volatility, yield, valuation, safety, quality, profitability, growth consensus, and long-term and short-term total return potential.
Here I’ve sorted by volatility and select the highest yielding low volatility blue-chips.
So let me show you why these are 7 low volatility high-yield blue-chips you’ll want to own in a bear market.
7 High-Yield Blue-Chips You’ll Want To Own When The Market Crashes 30+%
| Company | Ticker | Sector | Country | Dividend Withholding Tax | Annual Volatility |
| Kimberly-Clark | (KMB) | Consumer Staples | US | 0% | 15.9% |
| Verizon | (VZ) | Communications | US | 0% | 18.0% |
| Novartis | (NVS) | Healthcare | Switzerland | 15% | 18.5% |
| Altria | (MO) | Consumer Staples | US | 0% | 20.1% |
| 3M | (MMM) | Industrial | US | 0% | 20.5% |
| UGI Corp | (UGI) | Utilities | US | 0% | 19.5% |
| Unilever | (UL) | Consumer Staples | UK | 0% | 19.4% |
| Average | 2.1% | 18.8% |
(Source: DK Research Terminal)
Here we have seven blue-chips in five sectors, from three countries, on two continents. Their average volatility is 18.8% per year.
- average standalone company is 28%
- average aristocrat is 23%
Also, three bond ETFs you’d want to own in a future bear market.
JPMorgan Asset Management 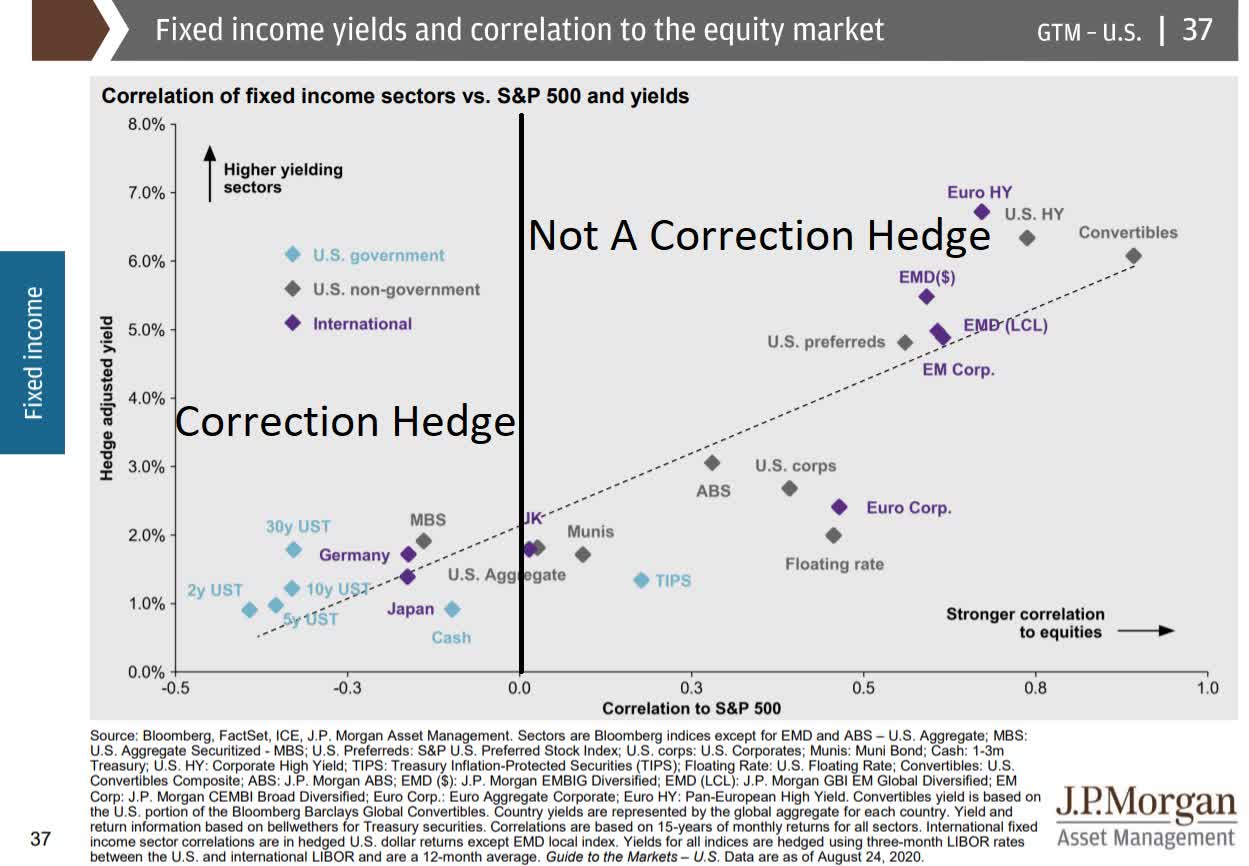
Since 1950 92% of the time when stocks fall, Treasury bonds go up. That’s because risk-free sovereign bonds are the ultimate flight to safety asset, which is negative correlated with stocks.
- Vanguard Short-Term Treasury ETF (VGSH) – cash alternative (0.7% yield)
- Schwab US Aggregate Bond ETF (SCHZ) – intermediate bonds (2.3% yield)
- Vanguard Extended Duration Treasury ETF (EDV) – ultra-long duration US Treasuries (maximum hedging power in a bear market) – 2.3% yield
In a few minutes, we’ll see how combining these 3 low-cost bonds ETFs with 7 low-volatility high-yield blue-chips can help generate the ultimate sleep well at night bear market-resistant portfolio.
But first, let me show you why these seven high-yield low volatility blue-chips are so perfect for a future bear market, whenever it finally arrives.
World-Class Quality You Can Trust In A Recession
| Company | Quality Rating (out Of 13) | Quality Score (Out Of 100) | Dividend/Balance Sheet Safety Rating (out of 5) | Safety Score (Out Of 100) | Dependability Rating (Out Of 5) | Dependability Score (out Of 100) |
| Kimberly-Clark | 13 | 88% | 5 | 91% | 5 | 85% |
| Verizon | 12 | 83% | 5 | 86% | 4 | 80% |
| Novartis | 13 | 97% | 5 | 100% | 5 | 96% |
| Altria | 13 | 88% | 5 | 91% | 5 | 83% |
| 3M | 13 | 92% | 5 | 94% | 5 | 88% |
| UGI Corp | 13 | 87% | 5 | 93% | 5 | 83% |
| Unilever | 12 | 78% | 4 | 75% | 5 | 83% |
| Average | 12.7 Ultra SWAN | 87.6% | 4.9 Very Safe | 90.0% | 4.9 Exceptional | 85.4% |
(Source: DK Research Terminal)
For context:
- average aristocrat is 11.7/13 Super SWAN quality
- aristocrats average an 85% quality score
Why are these some of the safest and most dependable dividend stocks on earth and perfect for a future bear market?
| Rating | Dividend Kings Safety Score (151 Point Safety Model) | Approximate Dividend Cut Risk (Average Recession) |
Approximate Dividend Cut Risk In Pandemic Level Recession |
| 1 – unsafe | 0% to 20% | over 4% | 16+% |
| 2- below average | 21% to 40% | over 2% | 8% to 16% |
| 3 – average | 41% to 60% | 2% | 4% to 8% |
| 4 – safe | 61% to 80% | 1% | 2% to 4% |
| 5- very safe | 81% to 100% | 0.5% | 1% to 2% |
| High-Yield/Low Volatility Blue-Chips | 88% | 0.5% | 1.60% |
| Risk Rating | Low Risk (80th industry percentile risk-management consensus) | A- stable outlook credit rating 3.2% 30-year bankruptcy risk |
20% OR LESS Max Risk Cap Recommendation (Each) |
(Source: DK Research Terminal)
Because in the average historical recession since WWII the risk of a dividend cut is 0.5% and even in a Pandemic or Great Recession downturn the risk is about 1.6%.
| Company | Payout Ratio | Industry Safe Payout Ratio Guideline | Debt/Capital | Industry Safe Debt/Capital Guideline |
| Kimberly-Clark | 79% | 70% | 80% | 65% |
| Verizon | 57% | 70% | 65% | 60% |
| Novartis | 53% | 60% | 27% | 40% |
| Altria | 80% | 85% | 101% | 60% |
| 3M | 60% | 60% | 50% | 40% |
| UGI Corp | 48% | 75% | 57% | 60% |
| Unilever | 77% | 70% | 30% | 65% |
| Average | 64.9% | 70.0% | 58.6% | 55.7% |
(Source: DK Research Terminal)
Their dividends are well covered by recession-resistant cash flows.
Their balance sheets are stronger than they look. Elevated debt/capital is primarily a result of stock buybacks
When a company buys back stock above book value it reduces shareholder equity and pushes up debt/capital. Shares that are repurchased sit on the balance sheet as treasury stock which is primarily used for stock option compensation for employees. It’s treated as a liability. In fact, it’s an asset that can be sold to raise cash.
You can see this from the fact that companies like MMM, MO, and KMB have strong credit ratings despite relatively high debt/capital ratios.
| Company | Long-Term Risk Management Consensus Industry Percentile | Risk-Rating | Risk-Management Rating | S&P Credit Rating | 30-Year Bankruptcy Risk |
| Kimberly-Clark | 71% | Low | Good | A | 0.66% |
| Verizon | 78% | Low | Good | BBB+ | 5.00% |
| Novartis | 93% | Low | Exceptional | AA- | 0.55% |
| Altria | 69% | Low | Above-Average | BBB | 7.50% |
| 3M | 87% | Low | Very Good | A+ | 0.60% |
| UGI Corp | 67% | Low | Above-Average | NA | 7.50% |
| Unilever | 93% | Low | Exceptional | A+ | 0.60% |
| Average | 80% | Low | Very Good | A- stable | 3.20% |
(Source: DK Research Terminal)
S&P estimates the average risk of these blue-chips going bankrupt over the next 30 years at 3.2%.
Our risk-management ratings are based on the consensus of six rating agencies. For context:
- master list average: 62nd percentile (above-average)
- dividend kings: 63rd percentile (above-average)
- aristocrats: 67th percentile (above-average)
- Ultra SWANs: 71st percentile (GOOD)
Rating agencies consider these Ultra SWANs low-risk very good, in the top 20% of their respective industries.
| Company | Dividend Growth Streak (Years) | ROC (Greenblatt) | ROC Industry Percentile | 13-Year Median ROC |
| Kimberly-Clark | 50 | 25% | 80% | 35% |
| Verizon | 15 | 30% | 72% | 27% |
| Novartis | 25 | 523% | 98% | 69% |
| Altria | 52 | 712% | 85% | 416% |
| 3M | 64 | 50% | 86% | 57% |
| UGI Corp | 34 | NA | NA | NA |
| Unilever | 6 | 87% | 94% | 80% |
| Average | 35.1 Dividend Aristocrat | 237.7% | 85.8% Wide Moat | 114.0% Stable/Improving Moat |
(Source: DK Research Terminal)
Ben Graham considered a 20+ year dividend growth streak to be a sign of excellent quality.
Justin Law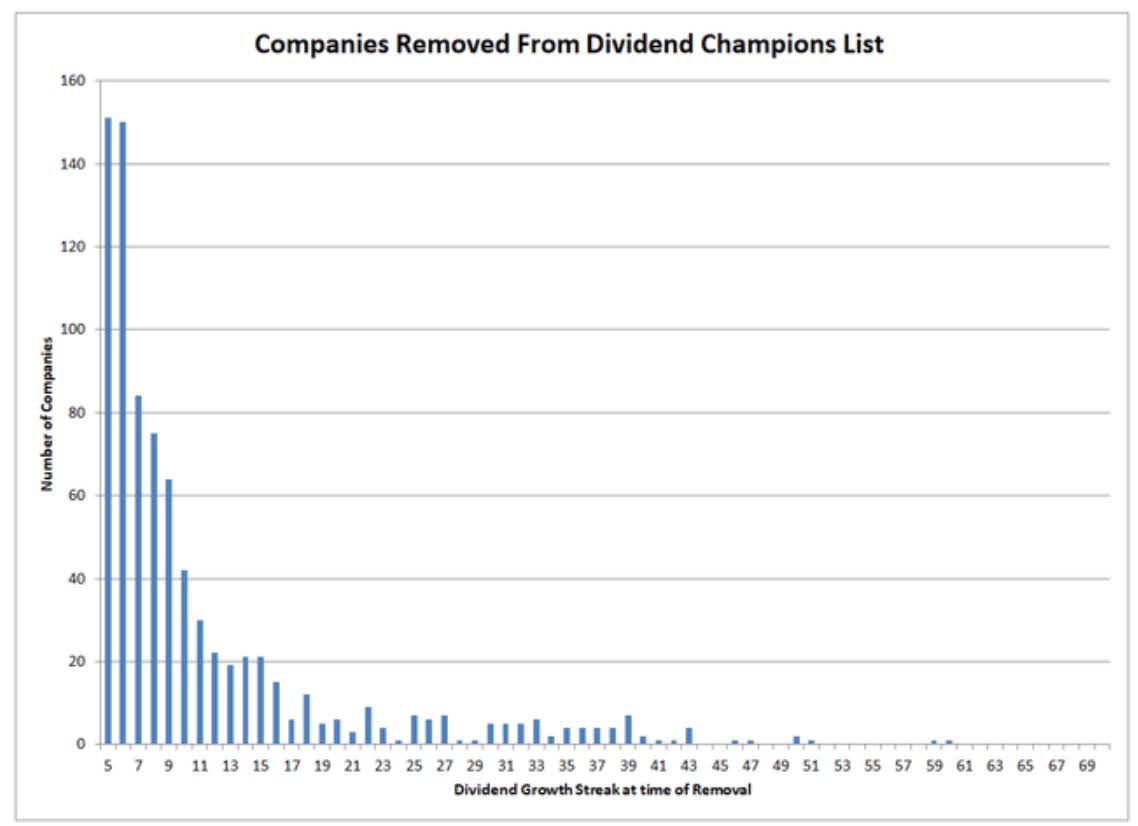
If a company has grown its dividends for 20+ years, there is very little risk that it will cut its dividend or even fail to keep raising it in all economic and industry conditions.
The average dividend growth streak for these blue-chips is 35 years or almost 2X the Graham standard of excellence.
- effectively an aristocrat portfolio
Return on capital is pre-tax profit/operating capital (the money it takes to run the business).
- Joel Greenblatt’s gold standard proxy for quality and moatiness
The S&P 500’s 2021 ROC was 14.6%.
- on average it takes the typical S&P company about 7 years to recoup investments they make
The average return on capital for these Ultra SWANs is 238%.
- average investment recouped in 5 months
- 16X higher quality than the average S&P 500 company according to one of the greatest investors in history
These Ultra SWAN’s ROC is in the top 14% of their industries, confirming a wide moat.
ROC is more than double their 13-year median, confirming a stable or improving moat.
Ok, so we can see that these are some of the world’s best companies.
And here’s why you might want to buy them today.
Wonderful Companies At Wonderful Prices
| Company | Discount To Fair Value | PE/EBITDA/FFO 2021 | Earnings Yield 2021 | 12-Month Consensus Total Return Potential | 12-Month Fundamentally Justified Upside Total Return Potential |
| Kimberly-Clark | 5.5% | 20.6 | 4.9% | 10.8% | 9.6% |
| Verizon | 13.4% | 9.4 | 10.7% | 22.2% | 20.5% |
| Novartis | 18.6% | 13.8 | 7.2% | 14.0% | 26.7% |
| Altria | 16.8% | 10.8 | 9.3% | 10.0% | 27.2% |
| 3M | 29.8% | 14.3 | 7.0% | 20.3% | 46.6% |
| UGI Corp | 26.8% | 11.7 | 8.5% | 41.4% | 40.6% |
| Unilever | 21.7% | 16.4 | 6.1% | 27.4% | 32.3% |
| Average | 19.0% | 13.9 | 7.7% | 20.9% | 29.1% |
(Source: DK Research Terminal)
These Ultra SWANs are 19% undervalued, the mirror image of the 19% historically overvalued S&P 500.
S&P 500 Valuation Profile
| Year | EPS Consensus | YOY Growth | Forward PE | Blended PE | Overvaluation (Forward PE) |
Overvaluation (Blended PE) |
| 2021 | $206.30 | 50.38% | 20.7 | 21.9 | 20% | 25% |
| 2022 | $225.37 | 9.24% | 20.2 | 20.4 | 17% | 16% |
| 2023 | $248.05 | 10.06% | 18.3 | 19.2 | 6% | 9% |
| 2024 | $275.12 | 10.91% | 16.5 | 17.4 | -4% | -1% |
| 12-Month forward EPS | 12-Month Forward PE | Historical Overvaluation | PEG | 25-Year Average PEG | S&P 500 Dividend Yield |
25-Year Average Dividend Yield |
| $227.28 | 19.989 | 18.63% | 2.35 | 3.62 | 1.41% | 2.01% |
(Source: DK S&P 500 Valuation And Total Return Tool)
In fact, they trade at just 13.9X earnings or an average earnings yield of 7.7%.
- earnings risk-premium: 7.7% earnings yield -2.5% 10-year Treasury yield = 5.2% vs. 3.7% S&P 500 10 and 20 year average
We’ve already seen how these are some of the world’s best companies, 16X higher quality than the market based on return on capital.
Yet today you can buy them with a 41% higher earnings risk premium than the market’s historical norm.
- the last time the S&P 500 traded at 13.9X earnings was December 2012
Analysts expect these Ultra SWANs to deliver 21% total returns in the next 12 months, while 29% total returns are justified by fundamentals.
Ok, so we can see how these high-yield, low-volatility Ultra SWANs are Buffett-style “wonderful companies at a wonderful price” but here’s why they might be just what you need ahead of a recession.
Long-Term Return Fundamentals: Low Volatility, High-Yield, And Great Returns
| Company | Yield | FactSet Long-Term Consensus Growth Rate | LT Consensus Total Return Potential | LT Risk-Adjusted Expected Returns |
| Kimberly-Clark | 3.8% | 5.7% | 9.5% | 6.7% |
| Verizon | 5.0% | 2.9% | 7.9% | 5.5% |
| Novartis | 3.9% | 5.8% | 9.7% | 6.8% |
| Altria | 6.9% | 5.3% | 12.2% | 8.5% |
| 3M | 4.0% | 8.0% | 12.0% | 8.4% |
| UGI Corp | 3.9% | 7.5% | 11.4% | 8.0% |
| Unilever | 4.6% | 6.4% | 11.0% | 7.7% |
| Average | 4.6% | 5.9% | 10.5% | 7.4% |
(Source: DK Research Terminal)
For context:
- Nasdaq: 0.8% yield
- S&P 500: 1.4% yield
- Dividend Aristocrats: 2.3% yield
- Vanguard High-Yield ETF: 2.7% yield
- junk bonds: 4.2% yields
Junk bonds average a “B” credit rating indicating a 37% bankruptcy risk, or nearly 12X higher than these aristocrats according to S&P.
And junk bonds don’t offer exceptionally dependable dividend growth, as seen by almost four consecutive decades of rising payouts under all economic, market, interest rate, and industry conditions.
More importantly, analysts expect 6% long-term earnings and dividend growth from these Ultra SWANs and 10.5% CAGR long-term returns.
That might not sound impressive but it’s better than the 9.9% CAGR they expect from the S&P 500 and nearly as good as the 2.3% yielding aristocrats.
| Investment Strategy | Yield | LT Consensus Growth | LT Consensus Total Return Potential | Long-Term Risk-Adjusted Expected Return | Long-Term Inflation And Risk-Adjusted Expected Returns | Years To Double Your Inflation & Risk-Adjusted Wealth |
10 Year Inflation And Risk-Adjusted Return |
| Safe Midstream | 5.3% | 6.0% | 11.3% | 7.9% | 5.7% | 12.6 | 1.75 |
| High-Yield/Low Volatility Ultra SWAN Aristocrats | 4.6% | 5.9% | 10.5% | 7.4% | 5.2% | 13.9 | 1.66 |
| Realty Income | 4.6% | 5.2% | 9.8% | 6.9% | 4.7% | 15.4 | 1.58 |
| Safe Midstream + Growth | 3.3% | 8.5% | 11.8% | 8.3% | 6.1% | 11.8 | 1.80 |
| REITs | 2.9% | 6.5% | 9.4% | 6.6% | 4.4% | 16.4 | 1.54 |
| High-Yield | 2.8% | 11.3% | 14.1% | 9.9% | 7.7% | 9.4 | 2.10 |
| Europe | 2.6% | 12.8% | 15.4% | 10.7% | 8.6% | 8.4 | 2.27 |
| 10-Year US Treasury | 2.5% | 0.0% | 2.5% | 1.8% | -0.4% | -167.4 | 0.96 |
| Dividend Aristocrats | 2.2% | 8.9% | 11.1% | 7.8% | 5.6% | 12.9 | 1.72 |
| 60/40 Retirement Portfolio | 2.1% | 5.1% | 7.2% | 5.1% | 2.9% | 24.9 | 1.33 |
| Value | 2.1% | 12.1% | 14.1% | 9.9% | 7.7% | 9.3 | 2.10 |
| REITs + Growth | 1.8% | 8.9% | 10.6% | 7.4% | 5.2% | 13.7 | 1.67 |
| High-Yield + Growth | 1.7% | 11.0% | 12.7% | 8.9% | 6.7% | 10.8 | 1.91 |
| Dividend Growth | 1.6% | 8.0% | 9.6% | 6.7% | 4.5% | 15.9 | 1.56 |
| S&P 500 | 1.4% | 8.5% | 9.9% | 7.0% | 4.8% | 15.1 | 1.59 |
| Nasdaq (Growth) | 0.8% | 10.7% | 11.5% | 8.1% | 5.9% | 12.3 | 1.77 |
(Sources: Morningstar, FactSet, Ycharts)
There are few ways to earn a safer 4.6% yield than these Ultra SWAN aristocrats, and none that have lower volatility.
Inflation-Adjusted Consensus Return Forecast: $1,000 Initial Investment
| Time Frame (Years) | 7.7% CAGR Inflation-Adjusted S&P Consensus | 9.0% Inflation-Adjusted Aristocrat Consensus | 8.3% CAGR Inflation-Adjusted High-Yield/Low Volatility Ultra SWAN Aristocrats Consensus | Difference Between Inflation Adjusted High-Yield/Low Volatility Ultra SWAN Aristocrats Consensus Returns And S&P 500 |
| 5 | $1,449.03 | $1,540.04 | $1,491.23 | $42.19 |
| 10 | $2,099.70 | $2,371.71 | $2,223.75 | $124.05 |
| 15 | $3,042.53 | $3,652.52 | $3,316.12 | $273.58 |
| 20 | $4,408.74 | $5,625.01 | $4,945.08 | $536.34 |
| 25 | $6,388.41 | $8,662.72 | $7,374.22 | $985.82 |
| 30 | $9,257.02 | $13,340.91 | $10,996.63 | $1,739.61 |
(Source: DK Research Terminal, FactSet)
Analysts expect these low volatility, high-yield aristocrats to deliver 11X inflation-adjusted returns over the coming decades, or 19% more than the S&P 500.
| Time Frame (Years) | Ratio Aristocrats/S&P | Ratio Inflation-Adjusted High-Yield/Low Volatility Ultra SWAN Aristocrats Consensus Vs. S&P 500 |
| 5 | 1.06 | 1.03 |
| 10 | 1.13 | 1.06 |
| 15 | 1.20 | 1.09 |
| 20 | 1.28 | 1.12 |
| 25 | 1.36 | 1.15 |
| 30 | 1.44 | 1.19 |
(Source: DK Research Terminal, FactSet)
Ok, so these are wonderful quality low-volatility Ultra SWANs, but why should anyone get excited about earning 10.5% long-term returns?
To answer that question, let’s take a look at these low volatility aristocrats’ returns.
Historical Returns Since 1997 (Annual Rebalancing)
“The future doesn’t repeat, but it often rhymes.” – Mark Twain
Past performance is no guarantee of future results, but studies show that blue-chips with relatively stable fundamentals over time offer predictable returns based on yield, growth, and valuation mean reversion.
Bank of America So let’s take a look at how these high-yield Ultra SWANs have performed over the last 25 years when 91% of total returns were the result of fundamentals, not luck. (Source: Portfolio Visualizer)
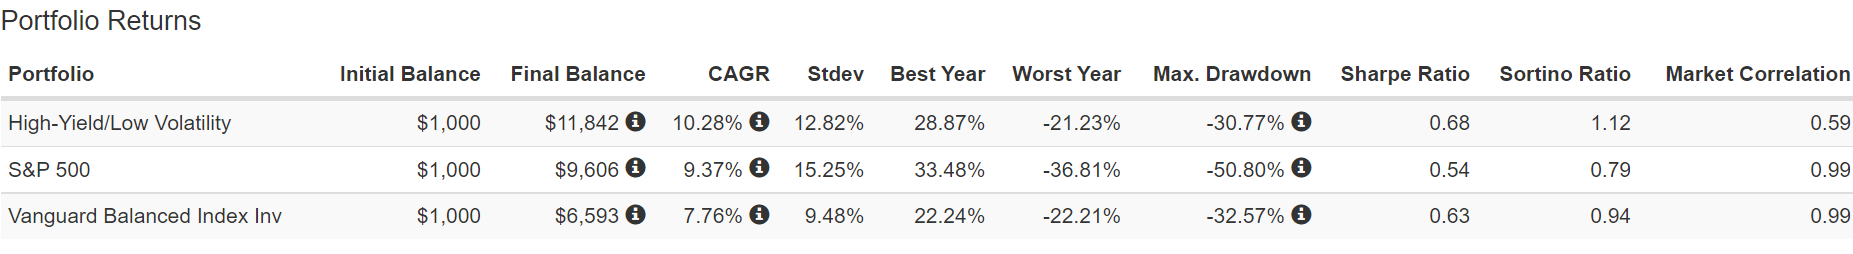
Let me point out a few key points.
- analysts expect 10.5% long-term total returns vs. 10.3% returns over the last 22 years
- these low volatility/high yield Ultra SWANs beat the S&P 500 and with 2.5% less annual volatility
- 41% better volatility adjusted returns than the S&P 500
- 23% better inflation-adjusted returns than the S&P 500
- 80% better inflation-adjusted returns than a 60/40
- lower peak decline than a 60/40 retirement portfolio (-31% vs. -33%) during the Great Recession…despite being 100% invested in stocks!
(Source: Portfolio Visualizer)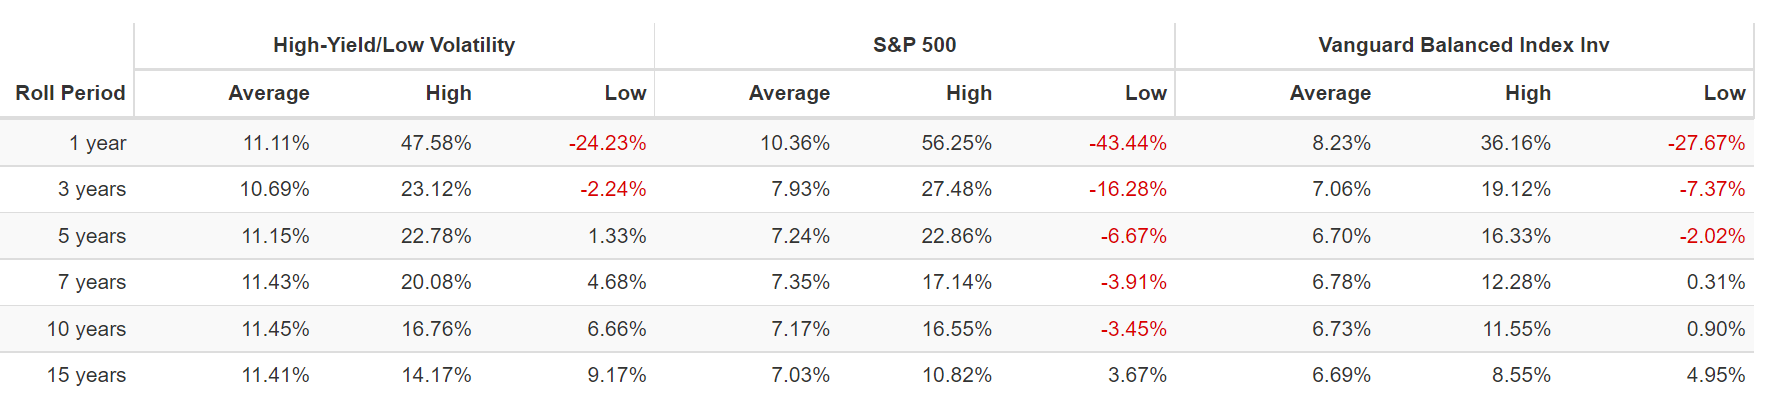
Higher and safer yield, superior returns, and less volatility!
This is the power of low-volatility/high-yield Ultra SWAN investing.
But what about those 3 bond ETFs? This is how we crank up the SWANiness to 11 and create a truly recession-resistant bunker portfolio.
| Metric | 60/40 | 70/30 Zen Ultra SWAN |
| Yield | 2.1% | 3.7% |
| Growth Consensus | 5.1% | 4.1% |
| LT Consensus Total Return | 7.2% | 7.8% |
| Risk-Adjusted Expected Return | 5.1% | 5.5% |
| Safe Withdrawal Rate | 2.9% | 3.3% |
(Source: DK Research Terminal, FactSet)
While the long-term returns aren’t expected to be much better than a 60/40 the yield is nearly 2X as high.
- yield that’s almost as high as junk bonds
- but without zero exposure to anything other than the world’s safest blue-chips and investment-grade bonds
And we’re still looking at a 10% higher safe withdrawal rate than a 60/40.
Historical Returns Since 2008 (Annual Rebalancing)
(Source: Portfolio Visualizer)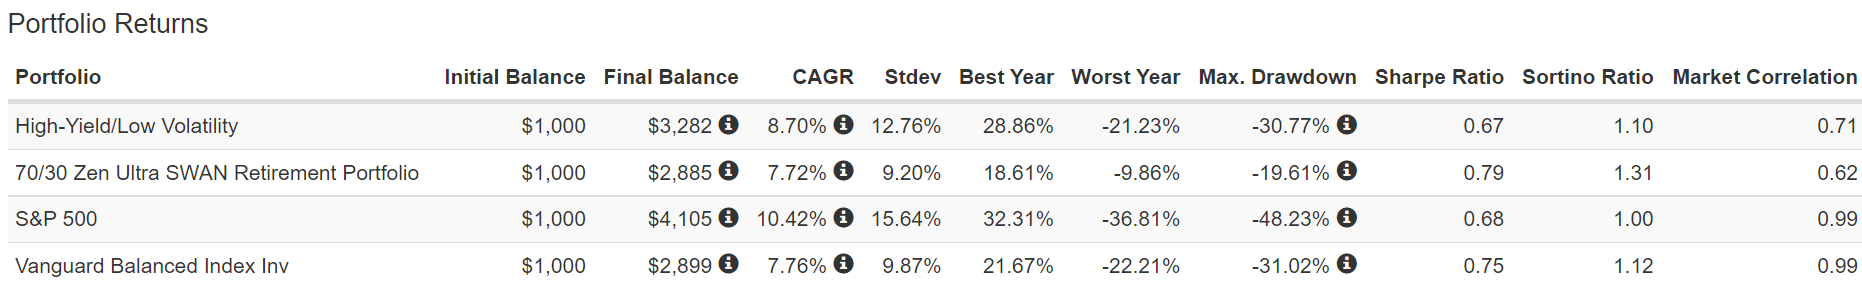
- This 70/30 Zen Ultra SWAN retirement portfolio delivered 7.7% historical returns over the last 14 years
- compared to 7.8% long-term returns analysts expect in the future
- basically matched a 60/40 retirement portfolio
- BUT with 0.7% lower annual volatility despite 10% more exposure to stocks!
- 17% higher volatility-adjusted returns than 60/40
- 31% higher volatility-adjusted returns than the S&P 500
- peak decline of -19.6% during the Great Recession…not even a bear market…during the 2nd largest market crash in US history
- 11% lower peak decline than a 60/40 during the Great Recession…despite 10% higher exposure to stocks!
(Source: Portfolio Visualizer)
During the Pandemic, the fastest bear market in US history, this portfolio didn’t even suffer a correction.
(Source: Portfolio Visualizer) (Source: Portfolio Visualizer)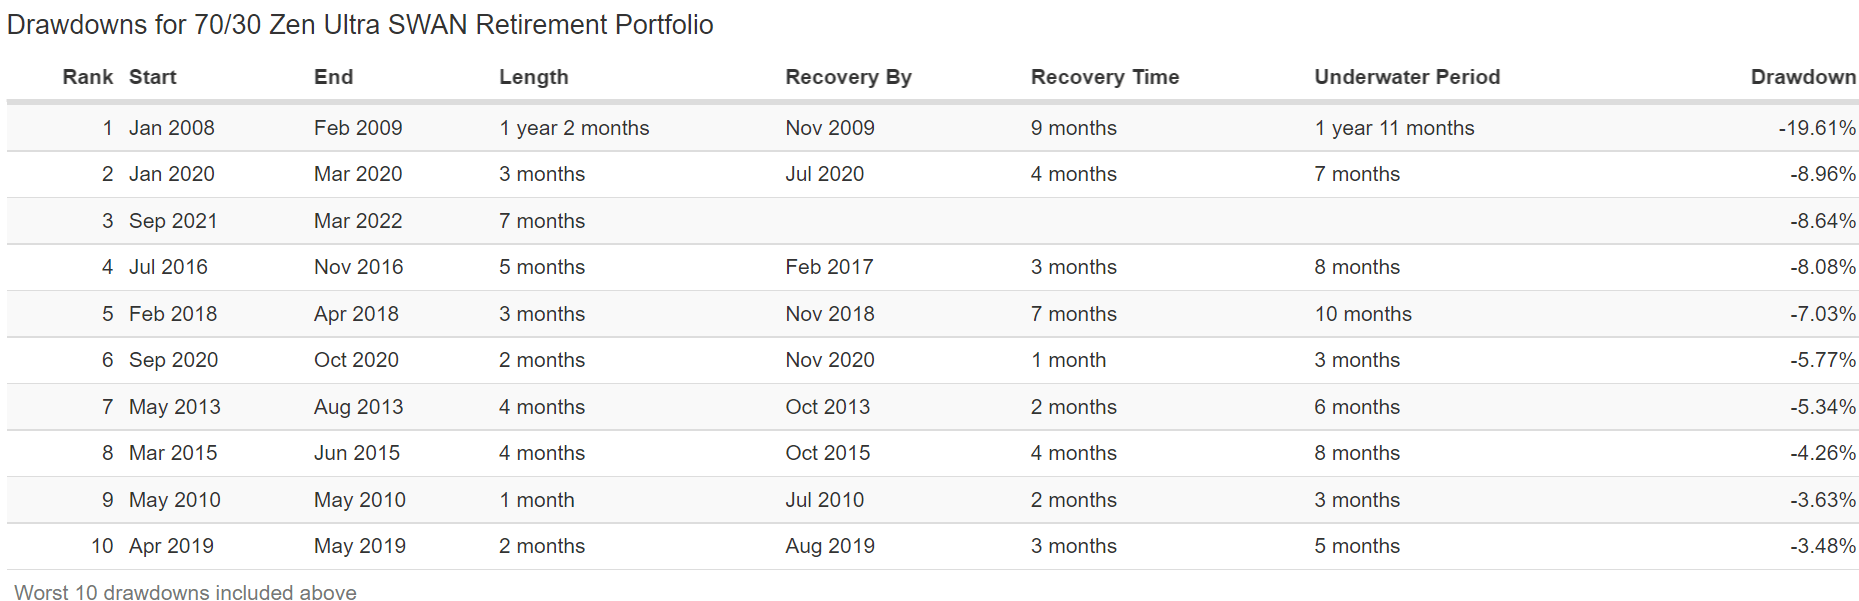
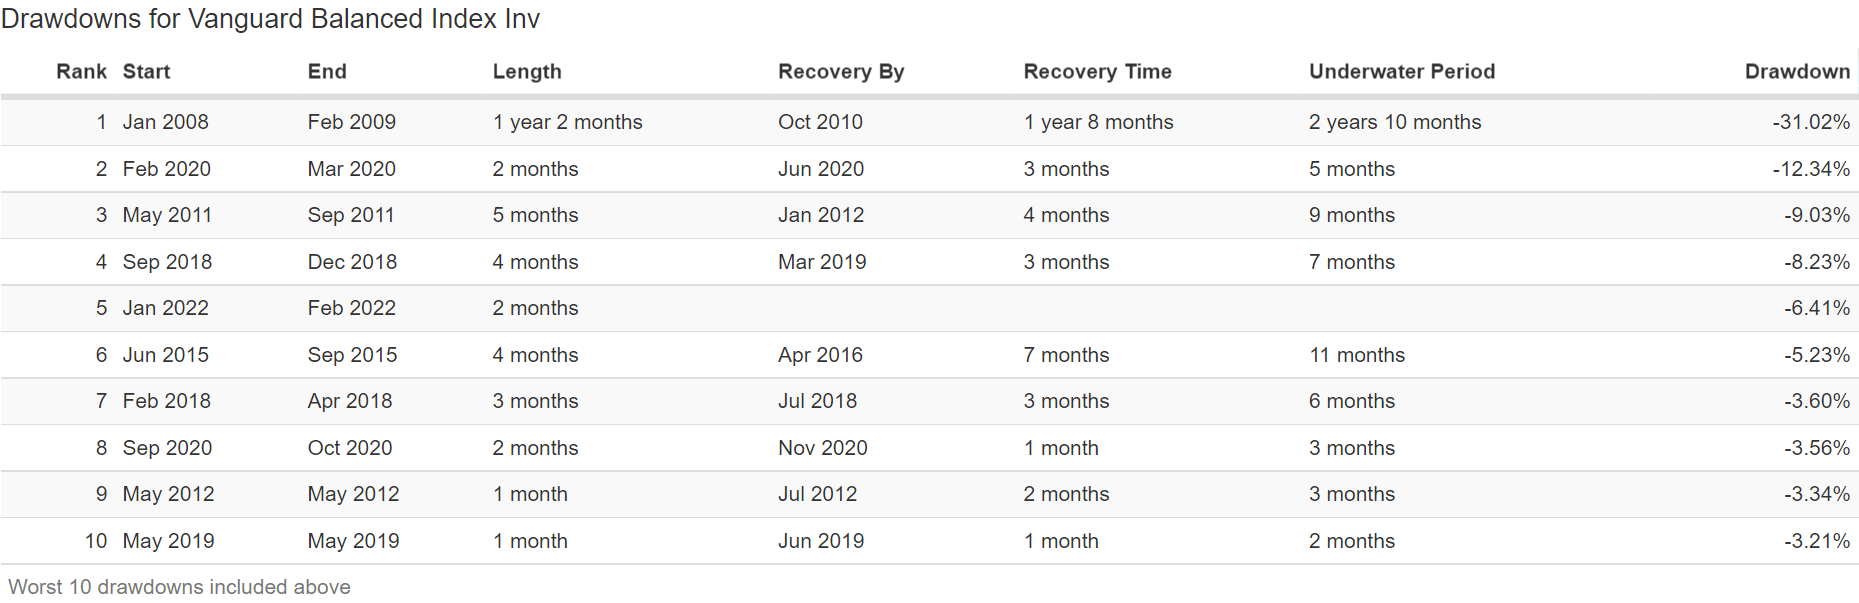
During the Great Recession, it fell 11% less and recovered new highs 1 year sooner.
And since the Great Recession, it hasn’t suffered a single correction.
- this is as close to a correction-resistant portfolio as you can build with Ultra SWAN quality aristocrats
So can you see why those modestly higher returns and much higher yield than a 60/40 can indeed be life-changing?
Inflation-Adjusted Consensus Forecast: $555K Median Retirement Savings
| Time Frame (Years) | 5.0% CAGR Inflation-Adjusted 60/40 | 5.6% Inflation And Risk-Adjusted Zen Ultra SWAN Retirement Portfolio | Difference Between Zen Ultra SWAN and 60/40 |
| 5 | $709,011.13 | $729,497.48 | $20,486.35 |
| 10 | $905,759.97 | $958,858.70 | $53,098.73 |
| 15 | $1,157,106.12 | $1,260,333.36 | $103,227.23 |
| 20 | $1,478,200.22 | $1,656,594.62 | $178,394.40 |
| 25 | $1,888,397.13 | $2,177,444.34 | $289,047.21 |
| 30 | $2,412,422.67 | $2,862,054.36 | $449,631.68 |
| Time Frame (Years) | Ratio Zen Ultra SWAN Vs. 60/40 |
| 5 | 1.03 |
| 10 | 1.06 |
| 15 | 1.09 |
| 20 | 1.12 |
| 25 | 1.15 |
| 30 | 1.19 |
(Source: DK Research Terminal, FactSet)
How does the prospect of almost $500K in additional inflation-adjusted wealth over 30 years sound to you?
- but with almost 2X the immediate and safer income
- and with far lower volatility during future bear markets and recessions?
How does the idea of making 19% more returns with a lot more income and sleeping well at night through anything other than the literal apocalypse strike you?
But wait, let’s not forget about income.
| Portfolio | 2009 Income Per $1,000 Investment | 2021 Income Per $1,000 Investment | Annual Income Growth | Starting Yield | 2021 Yield On Cost |
| 70/30 Zen Ultra SWAN | $45 | $102 | 7.06% | 4.5% | 10.2% |
(Source: DK Research Terminal, FactSet)
This portfolio generated 7.1% annual income growth over the last 12 years, turning a 4.5% starting yield into a 10.2% yield on cost.
What kind of income growth do analysts expect in the future?
| Analyst Consensus Income Growth Forecast | Risk-Adjusted Expected Income Growth | Risk And Tax-Adjusted Expected Income Growth |
Risk, Inflation, And Tax Adjusted Income Growth Consensus |
| 7.1% | 5.0% | 4.2% | 2.1% |
(Source: DK Research Terminal, FactSet)
They still about 7% income growth, which when adjusted for the risk of companies not growing as expected, inflation, and rebalancing taxes is about 2%.
- S&P 500’s historical inflation- and tax-adjusted income growth rate is 3%
- This 70/30 Ultra SWAN Portfolio offers 2/3 the S&P’s historical income growth
- FactSet consensus for a 60/40’s inflation and tax-adjusted income growth rate is 0.5%
- This 70/30 Ultra SWAN Portfolio have 4X the real income growth potential of a 60/40 portfolio
Ok, so if that hasn’t convinced you of the power of high-yield/low volatility Zen Ultra SWAN investing, then how about this?
Zen Ultra SWAN Investing: Your Ticket To Retiring In Safety And Splendor
Motley Fool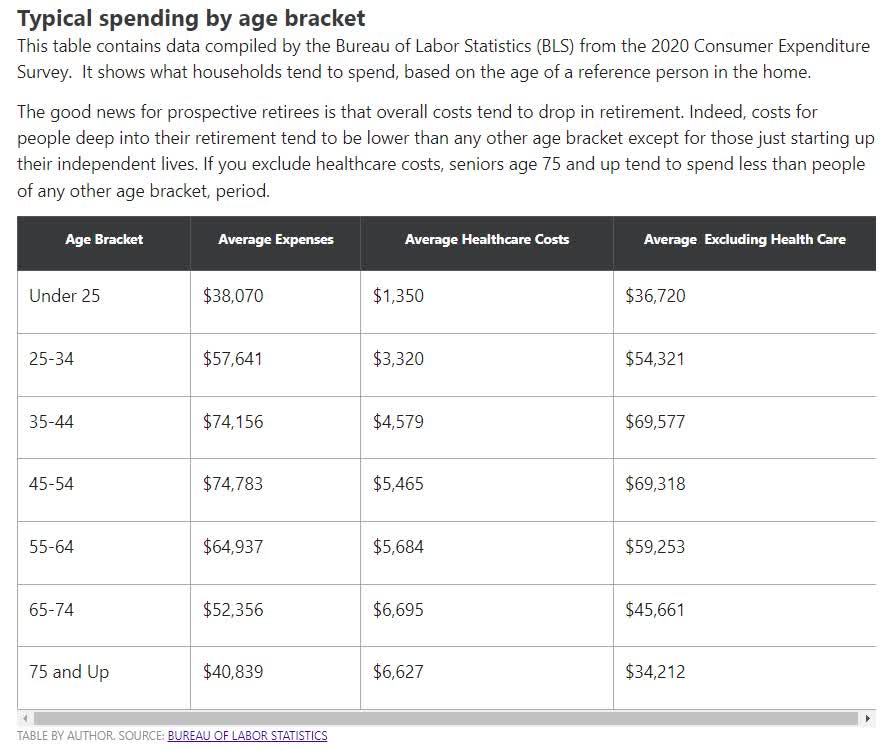
The average retired couple needs $52,000 per year to start and $41,000 after the age of 75.
What kind of retirement income can this 70/30 Zen Ultra SWAN retirement portfolio potentially deliver?
| Annual Income Year 1 | $21,648.35 | Annual Income Year 30 | $39,940.40 | ||
| Annual Social Security | $39,768 | Extra Income In Year 1 | $7,771.20 | Extra Income In Year 30 | $23,163.68 |
| Annual Income Year 1 | $61,416 | Extra Monthly Income In Year 1 | $647.60 | Extra Monthly Income In Year 30 | $1,930.31 |
(Source: DK Research Terminal, FactSet)
In year one this portfolio, combined with the average couple’s social security, delivers $61,500 annual income.
That’s almost $8,000 more than a 60/40.
- does $650 more per month on day 1 of retirement sound appealing?
- how about potentially, $2,000…per month…additional INFLATION-ADJUSTED Income by year 30?
| Total Inflation-Adjusted Income Over 30 Years ($555K Median Retirement Savings) | Average Inflation-Adjusted Annual Retirement Income | Average Monthly Inflation-Adjusted Annual Retirement Income | Average Daily Inflation-Adjusted Annual Retirement Income |
| $923,831.29 | $30,794.38 | $2,566.20 | $84.37 |
| Total Inflation-Adjusted Income Over 30 Years ($555K Median Retirement Savings) Including Social Security | Average Annual Income (Including Social Security) | Average Monthly Income (Including Social Security) | Average Daily Inflation-Adjusted Annual Retirement Income |
| $2,116,871.29 | $110,330.38 | $9,194.20 | $302.28 |
(Source: DK Research Terminal, FactSet)
Over 30 years this 70/30 Zen Ultra SWAN Retirement portfolio could deliver average inflation-adjusted income of $110,000 for the average retiree, of more than $9,000 per month.
| Extra Inflation-Adjusted Income Over 30 Years Vs. 60/40 | Average Extra Annual Income | Extra Average Monthly Income |
Extra Average Daily Income |
| $510,912.48 | $17,030.42 | $1,419 | $46.66 |
(Source: DK Research Terminal, FactSet)
Compared to a 60/40, which remember is a lot more volatile than this portfolio, you’re potentially looking at an extra $17K per year or $1400 per month of additional inflation-adjusted income.
CNBC 
41% of Americans have given up on ever retiring, and think it would take a miracle.
But a comfortable or even rich retirement isn’t a matter of luck or magic, just math.
Specifically, the world’s greatest companies, and a focus on safety and quality first, and prudent valuation and sound risk-management always.
- including the right asset allocation (mix of cash/bonds/stocks) that’s right for your specific risk profile
Bottom Line: These 7 High-Yield Blue-Chips Will Help You Sleep Well At Night When The Market Next Crashes 30+%
Recessions and bear markets are a fact of life, as natural as corrections and pullbacks.
If you think you can avoid them through market timing you are wrong.
JPMorgan Asset Management 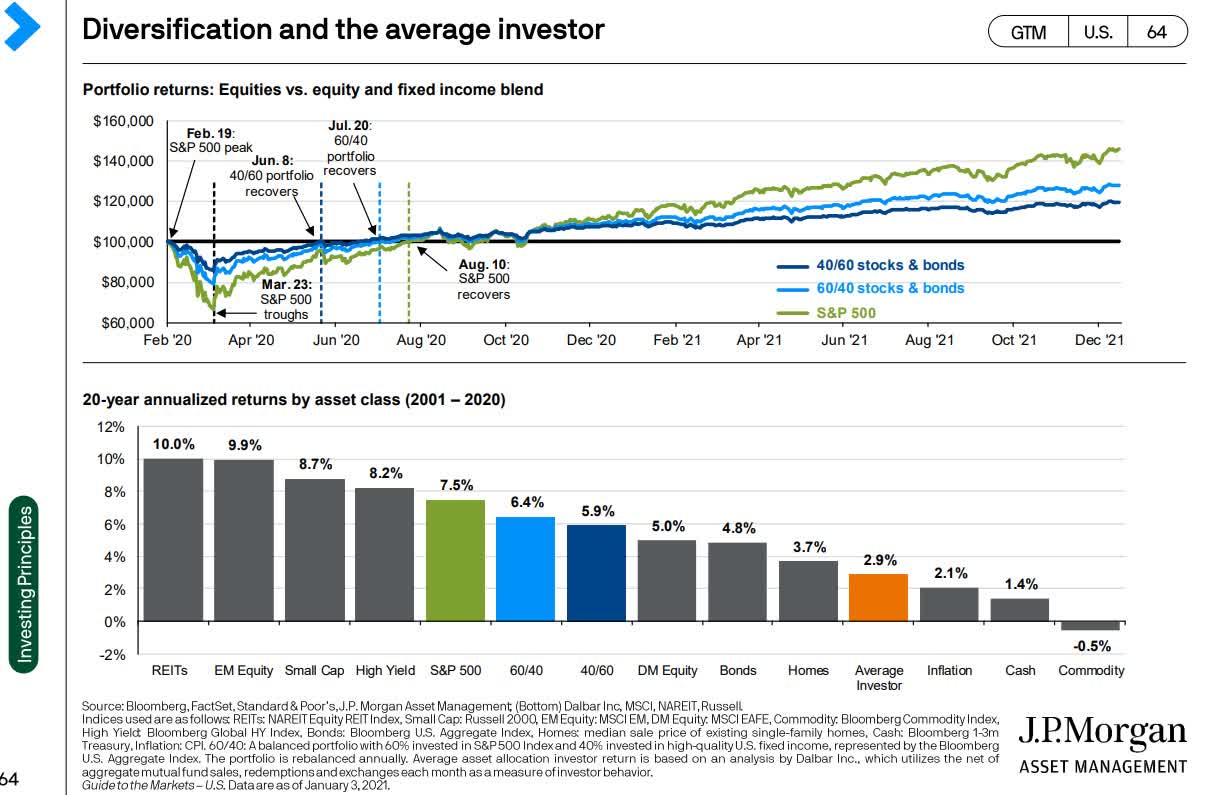
This is what market timing got the average investors over the past 20 years, 0.8% real returns, worse than every asset class other than commodities and cash.
According to Bank of America:
- since 1926 missing just the 10 single best days in the market (80% of which occurred within 2 weeks of the worst days) resulted in -94% inflation-adjusted returns
- compared to a 1,150X inflation-adjusted return for buying and holding the S&P 500
If you try to time the market to avoid recessions and bear markets, you are 97% likely to in the words of Joshua Brown “churn your portfolio to death”.
In contrast, if you trust the world’s best high-yield, low volatility Ultra SWANs like KMB, VZ, NVS, MO, MMM, UGI, and UL as well as VGSH, SCHZ, and EDV for bond exposure, you can achieve your rich retirement dreams while sleeping like a baby no matter what the economy or market are doing.
And in case the 70/30 Zen Ultra SWAN retirement portfolio isn’t enough for your needs guess what?
By adding just three faster-growing high-yield Ultra SWANs you can turn the 70/30 Zen Ultra SWAN retirement portfolio into the Super Zen Ultra SWAN Retirement Portfolio that can potentially help the typical retired couple
- generate an extra $214,000 in inflation-adjusted retirement income over 30 years compared to the 70/30 Zen Ultra SWAN portfolio and $724,000 more than a 60/40
- deliver $1.2 million more inflation-adjusted wealth over 30 years and $1.6 million more than a 60/40
- turn $555,000 in median retirement savings into over $4.0 million inflation-adjusted wealth after 30 years, $1.6 million more than a 60/40
- it fell just 21% during the Great Recession, 9% less than a 60/40
- it fell just 11% during the Pandemic, 1% less than a 60/40
This is how you stop fretting over the Fed, interest rates, the war in Ukraine, and recession fears.
This is how you stop gambling and praying for luck on Wall Street, and start making your own.
Luck is what happens when preparation meets opportunity.” – Roman philosopher Seneca the Younger
This is how you turn your nest egg into the house that always wins in the long-term and retire in safety and splendor.
No matter what the market or economy does in 2023, 2024, or in the years and decades to come.
Be the first to comment