

Garosha/iStock via Getty Images
Foreword
As supplement to this article, please note that Kiplinger has published an on-line slide-show detailing the latest 2022 65 S&P Dividend Aristocrats. The article, entitled 65 Best Dividend Stocks You Can Count On, is by Dan Burrows, a contributing editor.
Most of this collection of 65 S&P 500 Dividend Aristocrats is too pricey to justify their skinny dividends. The consequence of stock market popularity (measured by stock price) is skinny dividends. The contrarian approach finds the top dogs by looking for high dividends. This month, five of the top ten highest yield Aristocrats live up to the dogcatcher ideal. That is, they pay annual dividends (from a $1K investment) exceeding their single share prices.
Those five are: V.F. Corp. (VFC), Walgreens Boots Alliance (WBA), Franklin Resources, Inc. (BEN); Leggett & Platt, Inc. (LEG); Amcor plc (AMCR). One more in the top ten could soon join the ideal five, Realty Income Corp. (O) was within $3.95 of making the dogcatcher ideal team as of 10/6/22.
As we are now seven months beyond two-years removed from the anniversary of the 2020 Ides of March dip, the time to snap-up these five lingering top yield Aristocrat dogs is at hand… unless another big bearish drop in price looms ahead. (At which time your strategy would be to add to your position in any of those you then hold.)
Actionable Conclusions (1-10): Analysts Predict 24.27% To 48.24% Top Ten Aristocrat Net Gains To October 2023
Five of the ten top Aristocrats by yield were also verified as being among the top ten gainers for the coming year based on analyst 1-year target prices. (They are tinted gray in the chart below.) Thus, this yield-based August 4 forecast for Aristocrats (as graded by Brokers) was 50% accurate.
Estimated dividend-returns from $1000 invested in each of these highest-yielding stocks and their aggregate one-year analyst median target prices, as reported by YCharts, produced the 2022-23 data points for the projections below. Note: target prices from lone-analysts were not used. Ten probable profit-generating trades projected to October 6, 2023 were:
YCharts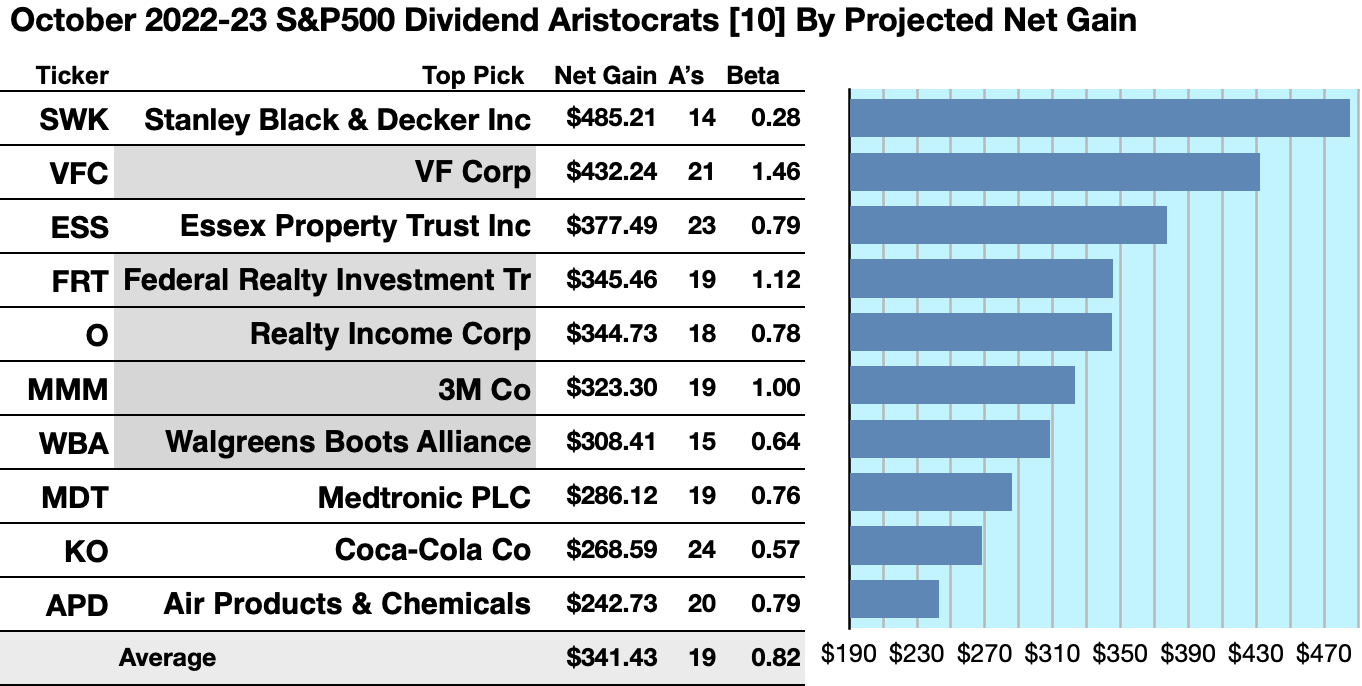
Stanley Black & Decker, Inc. (SWK) was projected to net $485.21, based on the median of target price estimates from 14 analysts, plus dividends, less broker fees. The Beta number showed this estimate subject to risk/volatility 28% greater than the market as a whole.
VF Corp was projected to net $432.24, based on dividends, plus the median of target price estimates from 21 analysts, less broker fees. The Beta number showed this estimate subject to risk/volatility 36% greater than the market as a whole.
Essex Property Trust, Inc. (ESS) was projected to net $377.49 based on target price estimates from 23 analysts, plus annual dividend, less broker fees. The Beta number showed this estimate is subject to risk/volatility 21% below the market as a whole.
Federal Realty Investment Trust (FRT) was projected to net $345.46, based on a median of target estimates from 19 analysts, plus dividends, less broker fees. The Beta number showed this estimate subject to risk/volatility 12% greater than the market as a whole.
Realty Income Corp was projected to net $344.73, based on dividends, plus the median of target price estimates from 18 analysts, less broker fees. The Beta number showed this estimate subject to risk/volatility 22% less than the market as a whole.
3M Co. (MMM) was projected to net $323.30, based on the median of target price estimates from nineteen analysts, plus dividends, less broker fees. The Beta number showed this estimate subject to risk/volatility equal to the market as a whole.
Walgreens Boots Alliance Inc was projected to net $308.41, based on dividends, plus the median of target price estimates from 15 analysts, less broker fees. The Beta number showed this estimate subject to risk/volatility 36% less than the market as a whole.
Medtronic plc (MDT) netted $286.12 based on a median target price estimate from 19 analysts, plus dividends, less broker fees. The Beta number showed this estimate subject to risk/volatility 24% under the market as a whole.
Coca-Cola Co. (KO) was projected to net $268.59, based on the median of target price estimates from 24 analysts, plus the estimated annual dividend, less broker fees. The Beta number showed this estimate subject to risk/volatility 43% less than the market as a whole.
Air Products and Chemicals, Inc. (APD) was projected to net $242.73 based on dividends, plus the median of target price estimates from 20 analysts, less broker fees. The Beta number showed this estimate subject to risk/volatility 21% less than the market as a whole.
The average net gain in dividend and price was estimated to be 34.14% on $10k invested as $1k in each of these ten stocks. The average Beta ranking showed these estimates subject to risk/volatility 8% less than the market as a whole.
Source: Open source dog art from dividenddogcatcher.com
The Dividend Dogs Rule
Stocks earned the “dog” moniker by exhibiting three traits: (1) paying reliable, repeating dividends, (2) their prices fell to where (3) yield (dividend/price) grew higher than their peers. Thus, the highest yielding stocks in any collection became known as “dogs.” More precisely, these are, in fact, best called, “underdogs”, even if they are “Aristocrats.”
Top 50 Dividend Aristocrats By Broker Targets
US Spindices/YCharts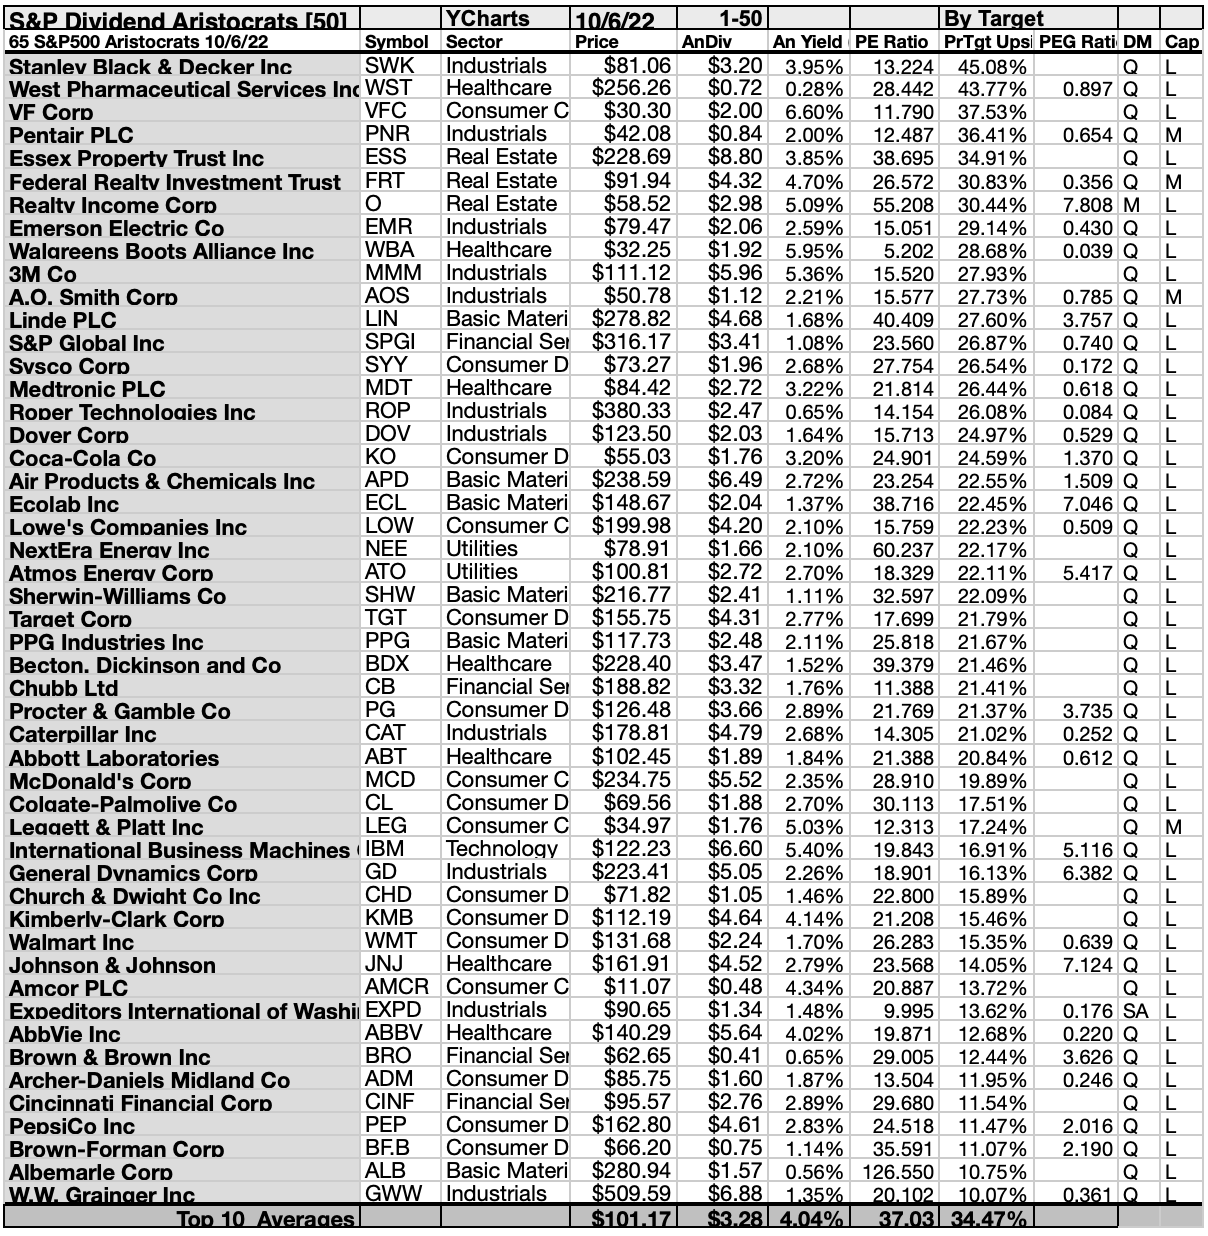
This scale of broker-estimated upside (or downside) for stock prices provides a measure of market popularity. Note: no broker coverage or single broker coverage produced a zero score on the above scale. These broker estimates can be seen as the emotional component (as opposed to the strictly monetary and objective dividend/price yield-driven report below). As noted above, these scores may also be regarded as contrarian.
Top 50 Dividend Aristocrats By Yield
Sources: US Spindices/YCharts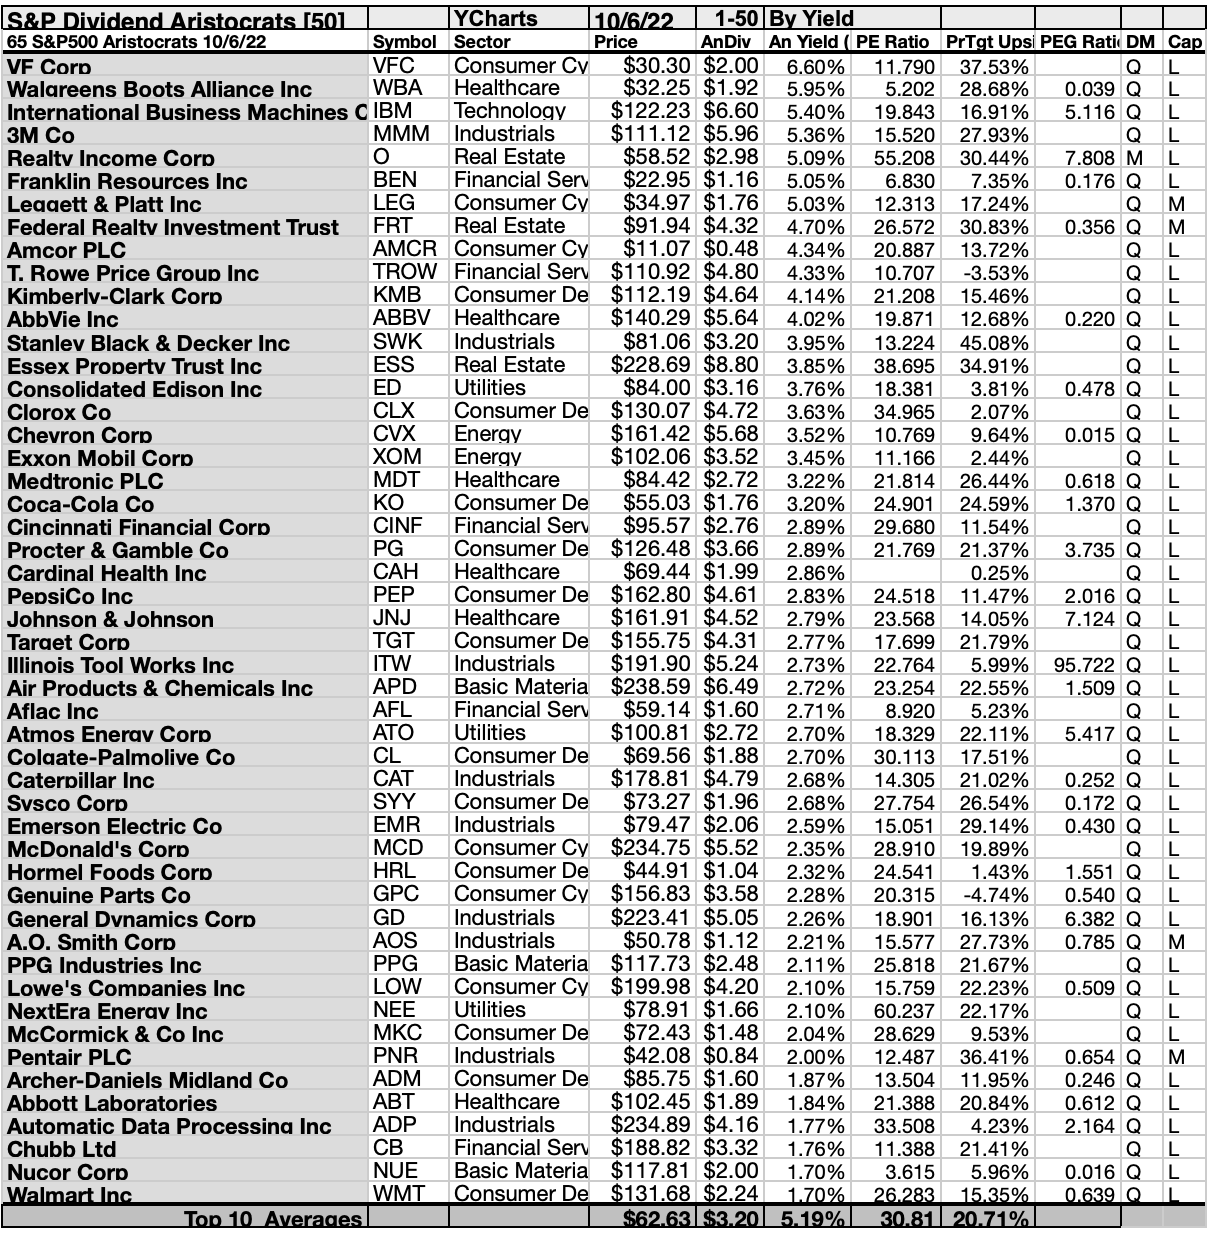
Actionable Conclusions (11-20): Ten Top Stocks By Yield Are The October Dogs of The Dividend Aristocrats
Top ten Aristocrat Dogs selected 9/4/22 by yield represented six of eleven Morningstar sectors. First place went to the first of three consumer cyclical representatives, VF Corp [1]. The others took the seventh, and ninth places, Leggett & Platt Inc [7], and Amcor PLC [9].
One healthcare representatives in the top ten placed second, Walgreens Boots Alliance [2].
In third place was the technology sector Aristocrat, International Business Machines Corp. (IBM) [3].
A lone industrials representative, placed fourth, 3M Co [4]. Then, two real estate representatives took the fif5th and eighth slots, Realty Income Corp [6], and Federal Realty Income Trust [8].
Therein, and thereafter, financial services firms placed sixth and tenth, Franklin Resources Inc [6] and T. Rowe Price Group (TROW) [10]. This completed the October S&P500 Dividend Aristocrats top-ten, by yield.
YCharts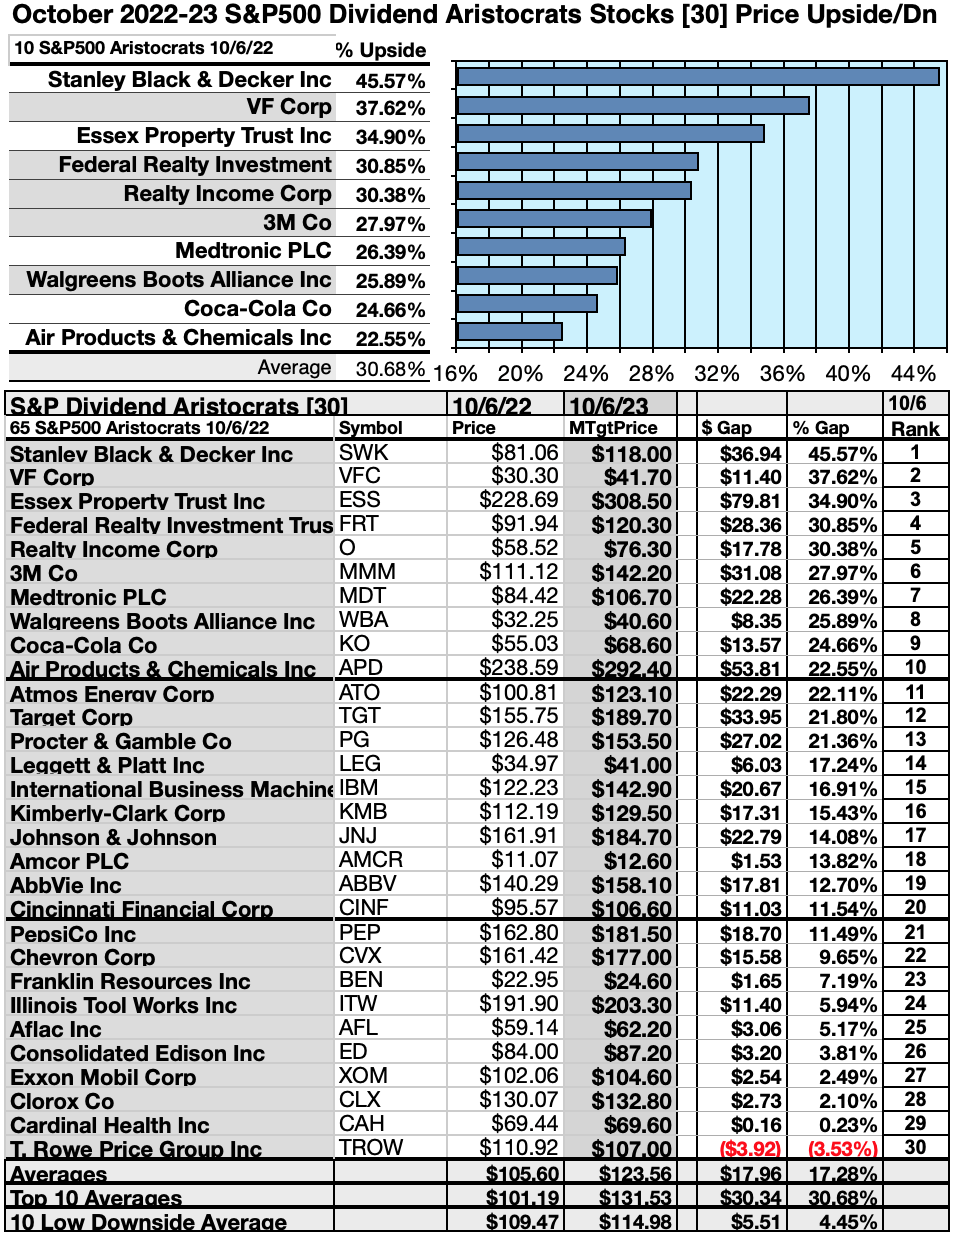
Actionable Conclusions: (21-30) Ten Aristocrats Showed 22.55% To 45.57% Upsides To October 2023; (31) On The Downside Was One -3.53% Loser
To quantify top-yield rankings, analyst median-price target estimates provided a “market sentiment” measure of upside potential. Added to the simple high-yield metrics, analyst median price-target-estimates became another tool to dig-out bargains, or unrealistic expectations.
Analysts Estimated A 0.52% Advantage For 5 Highest-Yield, Lowest-Priced, of Top Ten Dividend Aristocrats To October, 2023
Ten top Aristocrats were culled by (dividend/price) yield results for their monthly update.
YCharts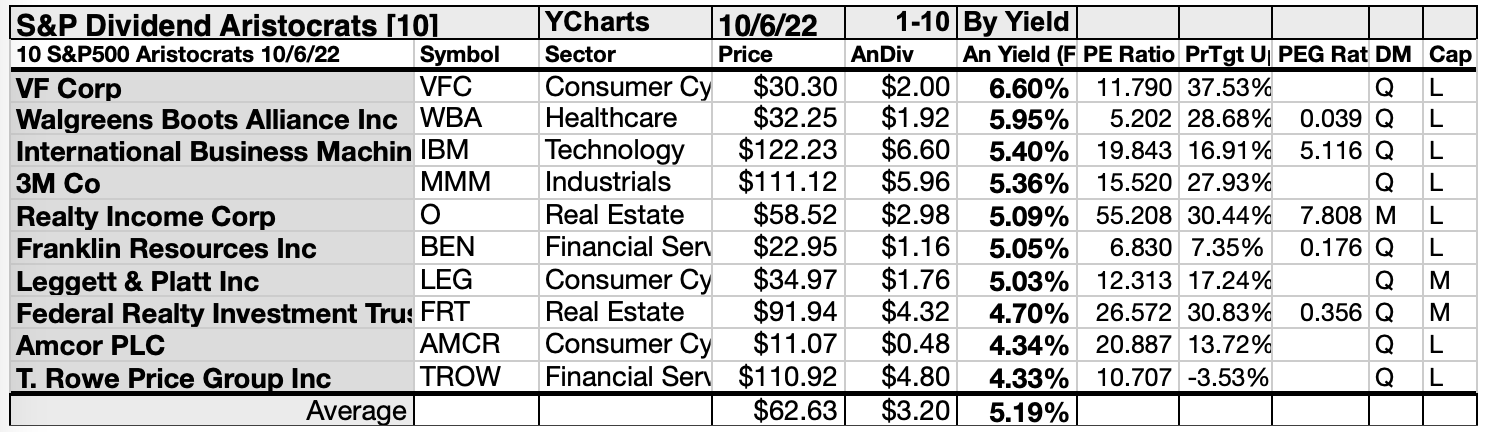
As noted above, top ten Aristocrats by yield selected 10/6/22 represented six of eleven sectors in the Morningstar sector scheme.
Actionable Conclusions: Analysts Estimated 5 Lowest-Priced Of Ten Highest-Yield Dividend Aristocrats (32) Delivering 24.75% Vs. (33) 24.62% Net Gains by All Ten, Come October 2023
YCharts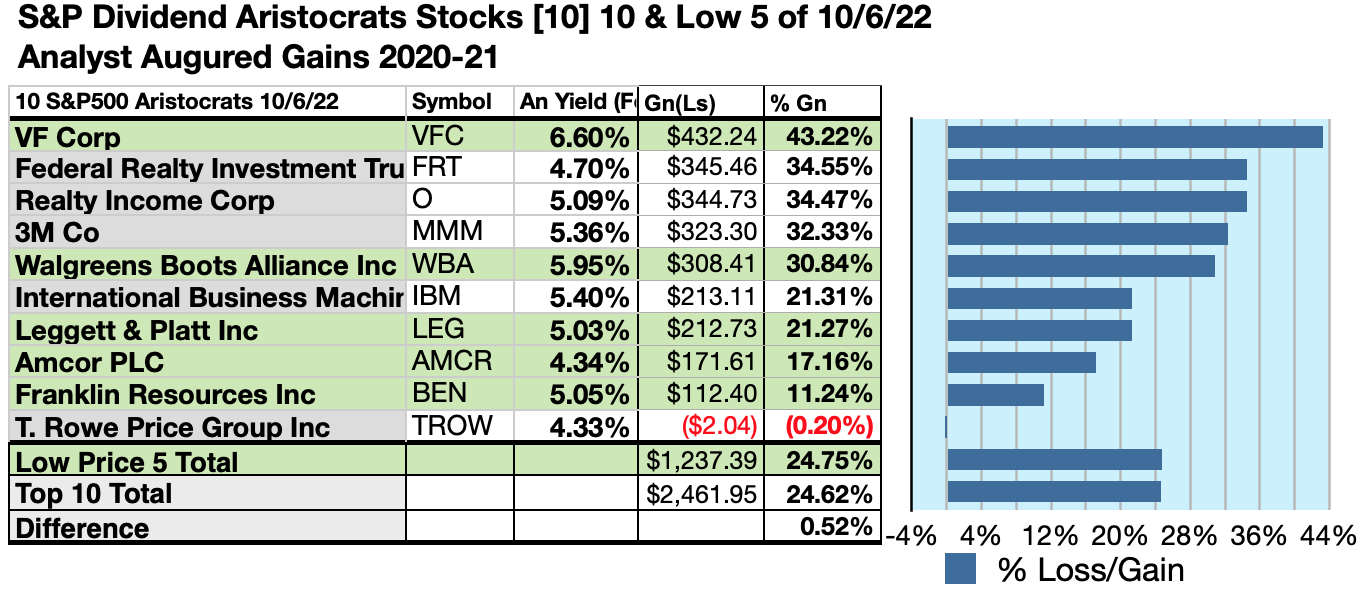
$5000 invested as $1k in each of the five lowest-priced stocks in the top ten Dividend Aristocrats kennel by yield were predicted (by analyst 1-year targets) to deliver 0.52% more gain than $5,000 invested as $.5k in all ten. The third lowest-priced Aristocrats top-yield stock, VF Corp, was projected to deliver the best net gain of 43.22%.
YCharts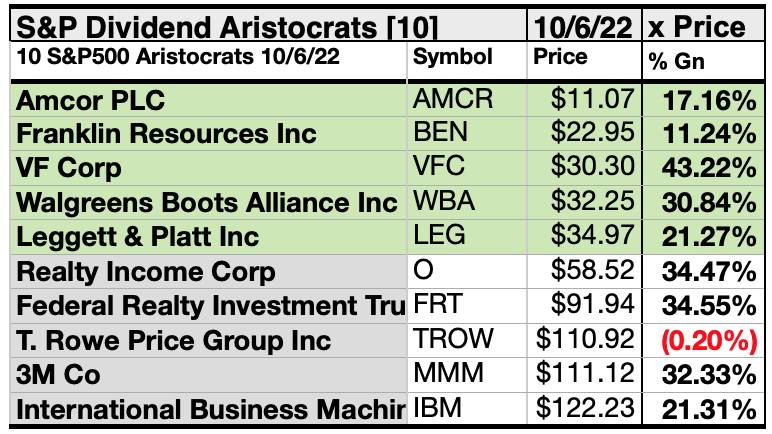
The five lowest-priced top-yield Aristocrats as of October 6 were: Amcor PLC; Franklin Resources; V.F. Corp; Walgreens Boots Alliance Inc; Leggett & Platt Inc, with prices ranging from $11.07 to $34.97
The five higher-priced top-yield Aristocrats as of October 6 were: Realty Income Corp; Federal Realty Investment Trust; T. Rowe Price; 3M Co; International Business Machines Corp, whose prices ranged from $58.52 to $122.23.
This distinction between five low-priced dividend dogs and the general field of ten reflected Michael B. O’Higgins’ “basic method” for beating the Dow. The scale of projected gains based on analyst targets added a unique element of “market sentiment” gauging upside potential. It provided a here-and-now equivalent of waiting a year to find out what might happen in the market. Caution is advised, however, since analysts are historically only 20% to 90% accurate on the direction of change and just 0% to 15% accurate on the degree of change.
Afterword
If somehow you missed the suggestion of the five stocks ripe for picking at the start of the article, here is a repeat of the list at the end:
The following 5 (as of 10/6/22) realized the ideal of offering annual dividends from a $1K investment exceeding their single share prices: VF Corp; Walgreens Boots Alliance; Franklin Resources Inc; Leggett & Platt Inc; Amcor PLC. Watch for Realty Income Corp to drop about $4 in price to become ideal.
Choosing One Top Contrarian Aristocrat
Sources: Seeking Alpha/YCharts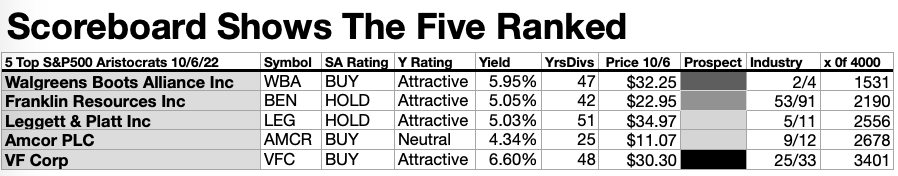
The chart above uses eight selective columns to rank the top five chosen Aristocrat contrarians. The top dog in the pack, Walgreens Boots Alliance, showed the best score in four of eight columns and the second-best rank in one more. None of the other four did better.
The categories used to rank the top dog were: (1) Seeking Alpha Author Rating; (2) Overall YCharts Rating; (3) Yield as of 10/6/22 market close with highest being best; (4) Number of years increasing dividends have been paid; (5) Stock price with the lowest being best; (6) Future prospects from dismal to bright; (7) Quant rank by industry; (8) Quant rank overall. All but the Y rating, dividend years, and prospect categories were collected from Seeking Alpha charts.
Price Drops or Dividend Increases Could Get All Ten Top Aristocrat Dogs Back to “Fair Price” Rates For Investors
YCharts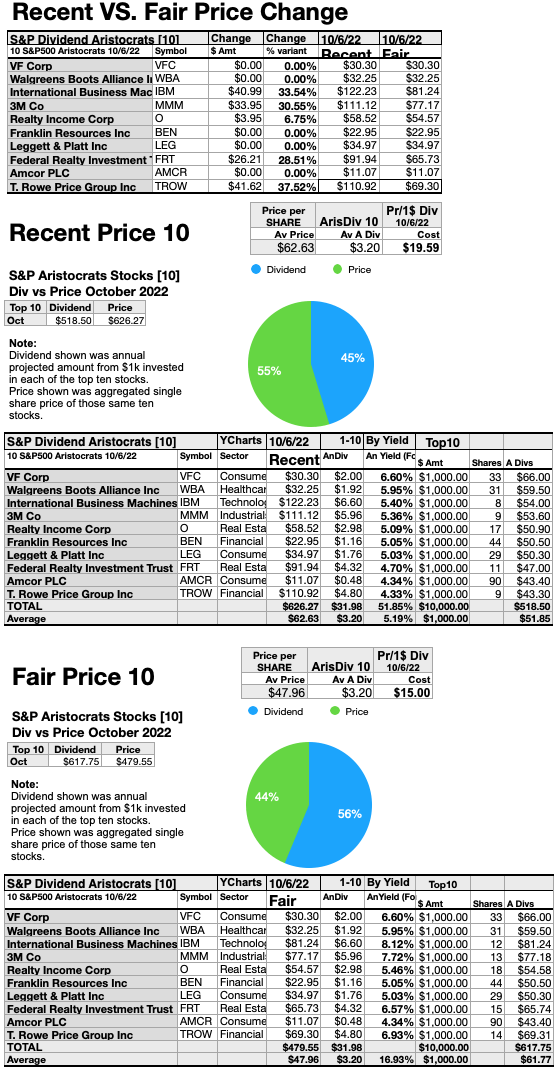
Since five of the top ten Aristocrats shares are now priced less than the annual dividends paid out from a $1K investment, the following charts compare those five plus five at current prices. The dollar and percentage differences between recent and fair prices are documented in the top chart.
Recent pricing is shown in the middle chart. Fair pricing, when all ten top dogs conform to the ideal, is displayed in the bottom chart.
S&P500 Aristocrats Alphabetically by Ticker Symbol
Source: S&P Dow Jones Indices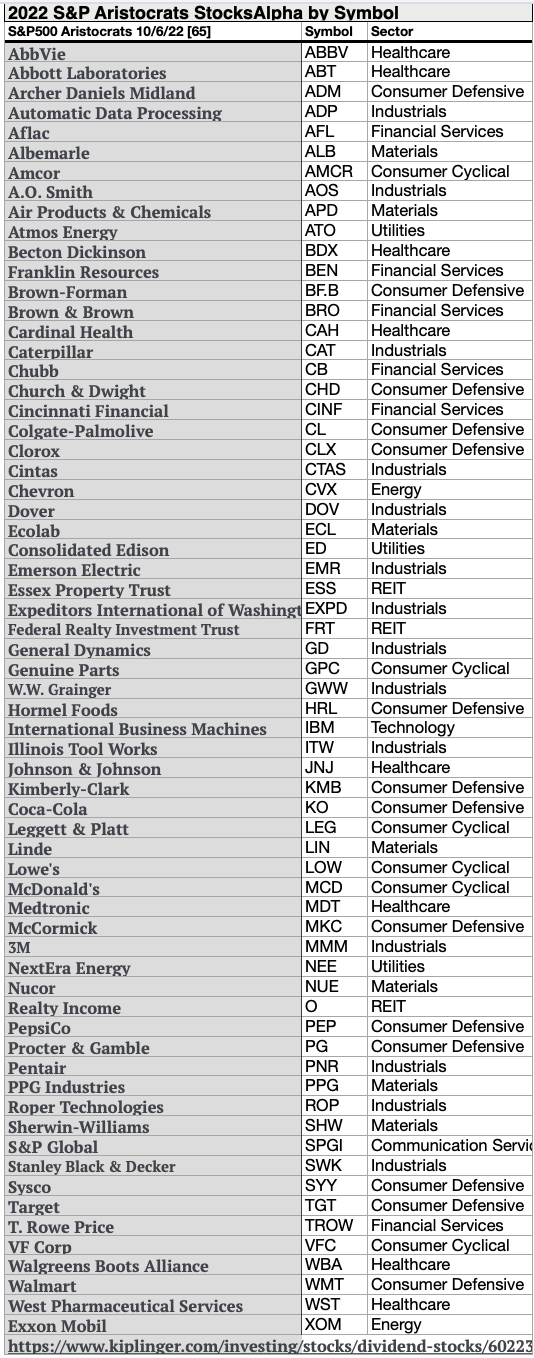
The net gain/loss estimates above did not factor in any foreign or domestic tax problems resulting from distributions. Consult your tax advisor regarding the source and consequences of “dividends” from any investment.
Stocks listed above were suggested only as possible reference points for your Dividend Aristocrats dog stock purchase or sale research process. These were not recommendations.
Disclaimer: This article is for informational and educational purposes only and should not be construed to constitute investment advice. Nothing contained herein shall constitute a solicitation, recommendation or endorsement to buy or sell any security. Prices and returns on equities in this article except as noted are listed without consideration of fees, commissions, taxes, penalties, or interest payable due to purchasing, holding, or selling same.
Graphs and charts were compiled by Rydlun & Co., LLC from data derived from www.indexarb.com; YCharts.com; finance.yahoo.com; analyst mean target price by YCharts. Dog art: Open source dog art from dividenddogcatcher.com.
Editor’s Note: This article was submitted as part of Seeking Alpha’s best contrarian investment competition which runs through October 10. With cash prizes and a chance to chat with the CEO, this competition – open to all contributors – is not one you want to miss. Click here to find out more and submit your article today!
Be the first to comment