

tiero/iStock via Getty Images
It’s always and forever a market of stocks, not a stock market, and that applies to even some of the world’s greatest companies.
Ycharts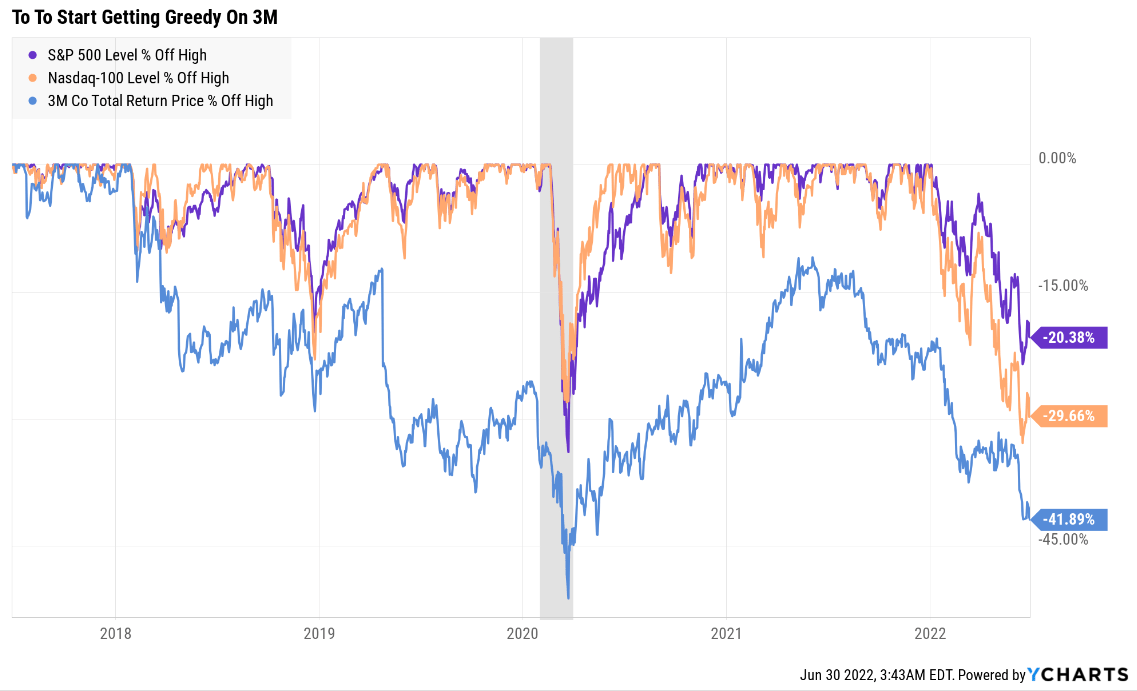
Take 3M (NYSE:MMM), the legendary dividend king, which has been raising its dividend for 64 consecutive years.
3M is down 42% off its highs, but that’s part of a 50% decline that began in a multi-year bear market.
How on earth can I be interested in a company with a chart this ugly?
Because 3M’s current bear market was the result of a bubble.
- a bubble formed by the tax cut rally
- and optimism about industrials due to infrastructure spending
FAST Graphs, FactSet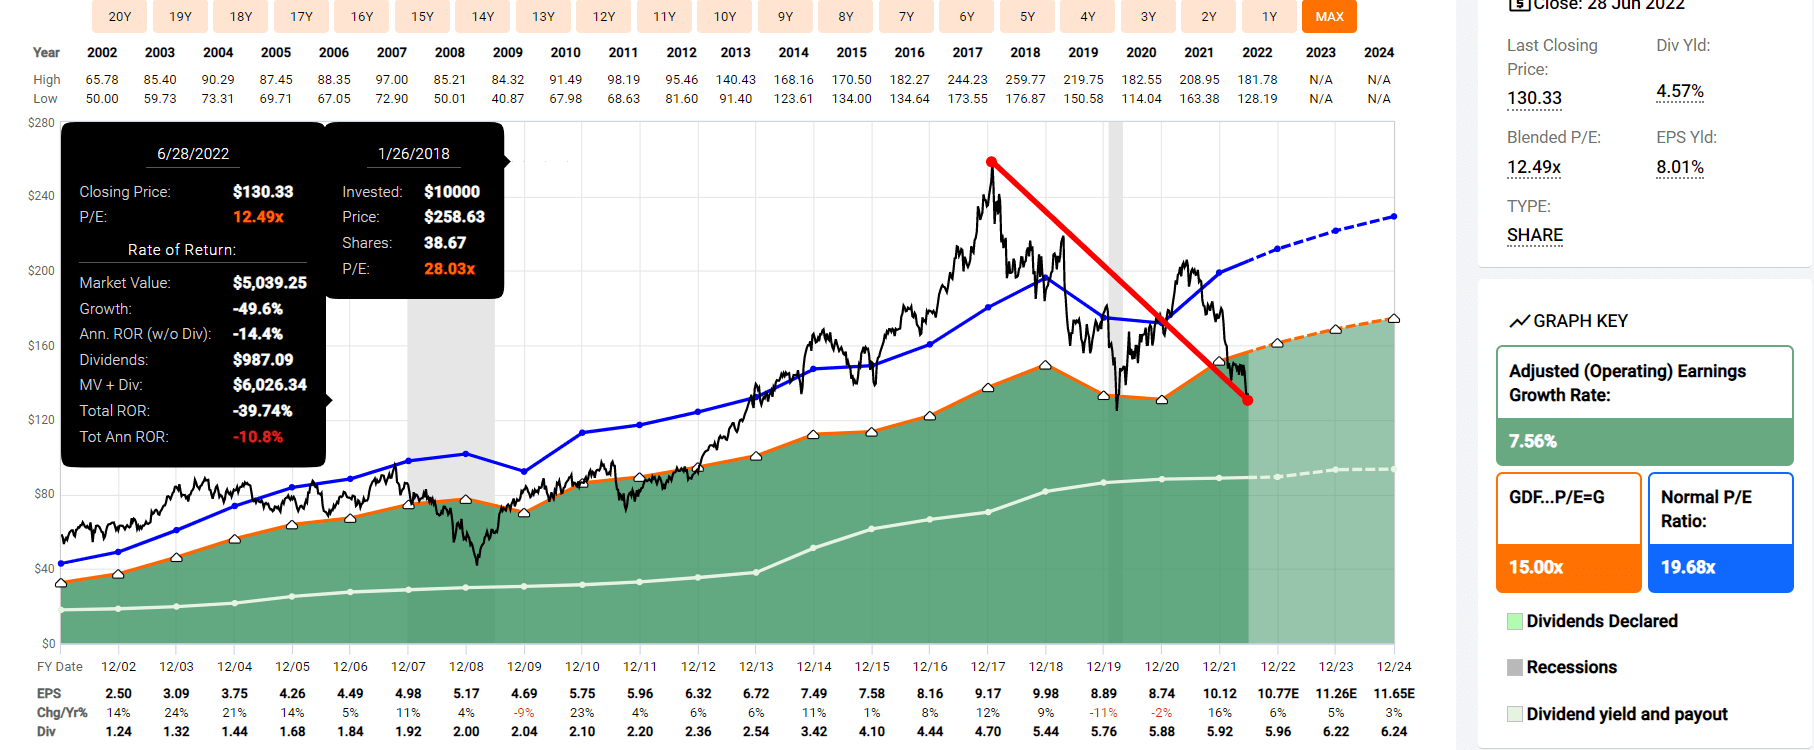
3M’s cycles are very long and it can spend years overvalued and many years undervalued.
FAST Graphs, FactSet
Today, 3M trades at the best valuation in 11 years, lower than the March 2020 Pandemic lows.
- the price is almost as low
- 3M’s average EPS decline during a recession is single digits
- a mild recession is expected next year
But wait a second, haven’t I been warning readers for several weeks that this bear market might not end until stocks fall a lot further?
| Time Frame | Historically Average Bear Market Bottom |
| Non-Recessionary Bear Markets Since 1965 | -21% (Achieved May 20th) |
| Median Recessionary Bear Market Since WWII | -24% (Citigroup base case with a mild recession) June 16th |
| Non-Recessionary Bear Markets Since 1928 | -26% (Goldman Sachs base case with a mild recession) |
| Average Bear Markets Since WWII | -30% (Morgan Stanley base case) |
| Recessionary Bear Markets Since 1965 | -36% (Bank of America recessionary base case) |
| All 140 Bear Markets Since 1792 | -37% |
| Average Recessionary Bear Market Since 1928 |
-40% (Deutsche Bank, Bridgewater, SocGen Severe Recessionary base case, Morgan Stanley Recessionary Base Case) |
|
(Sources: Ben Carlson, Bank of America, Oxford Economics, Goldman Sachs) |
Indeed it might, depending on whether or not we get a recession in 2023.
However, I need to point out three important facts. First, individual companies bottom at different times. For example:
- Altria (MO) bottomed in November 2008, four months before the rest of the market
- Amazon (AMZN) bottomed in January 2022, 10 months before the rest of the market
Second, stocks don’t bottom because bad news stops coming. They bottom when the market has priced in all the bad news that’s likely coming.
- the Pandemic low was March 23rd, long before the negative economic effects of the Pandemic peaked
- the Great Recession bottom of March 9th, 2009 was not the bottom for the economy or corporate earnings
Finally, for those who are worried about buying any company in a bear market lest it fall further, consider this.
| Discount To Fair Value/Further Decline | Additional Long-Term Upside |
Annualized Additional Return (30 Years) |
| 5% | 5.30% | 0.17% |
| 10% | 11.10% | 0.35% |
| 15% | 17.60% | 0.54% |
| 20% | 25% | 0.75% |
| 25% (Potential Further Decline In S&P) | 33.3% | 0.96% |
| 30% | 42.90% | 1.20% |
| 35% | 53.80% | 1.45% |
| 38% (3M’s Discount) | 61.3% | 1.60% |
| 40% | 66.70% | 1.72% |
| 45% | 81.80% | 2.01% |
| 50% | 100% | 2.34% |
| 55% | 122.2% | 2.70% |
| 60% | 150% | 3.10% |
(Source: MoneyChimp)
In the event of a recession, Morgan Stanley, UBS, Soc Gen, Bridgewater, and Bank of America think the S&P could fall as much as 25% more.
If that happens then anyone who nails the exact bottom would benefit from an additional 33% total returns in the future, or 1% higher annual returns.
But 3M is already 38% historically undervalued, a potential Ultra Value Buffett-style “fat pitch” that means buying today results in a 61% total return simply from long-term valuation mean reversion.
And guess what? Valuation mean reversion is one of the strongest forces in finance.
Bank of America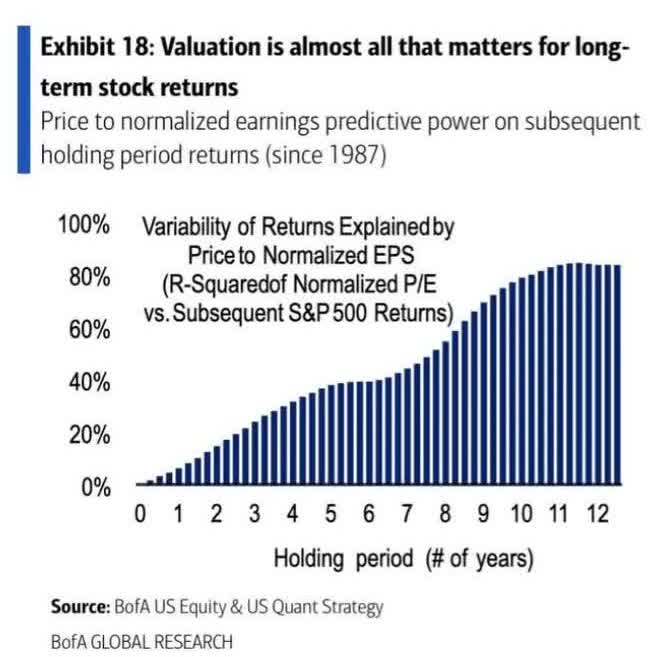
According to a study from Bank of America, valuation mean reversion explains 80% of blue-chip returns since 1987.
Or to put it another way, if a company’s fundamentals, such as long-term growth, remain similar over time, then valuation returning to historical levels can deliver truly exceptional returns for deep value investors.
Rule number one: most things will prove to be cyclical.
Rule number two: some of the greatest opportunities for gain and loss come when other people forget rule number one.” – Howard Marks
What does this mean for high-yield investors considering buying 3M today?
- 4.6% very safe yield
- 8% long-term growth consensus (same as the last 20 years)
- 12.6% long-term consensus return potential
- 14.2% CAGR long-term return potential including valuation boost over 30 years
It means the ability to lock in one of the best yields on MMM in history.
Yield Chart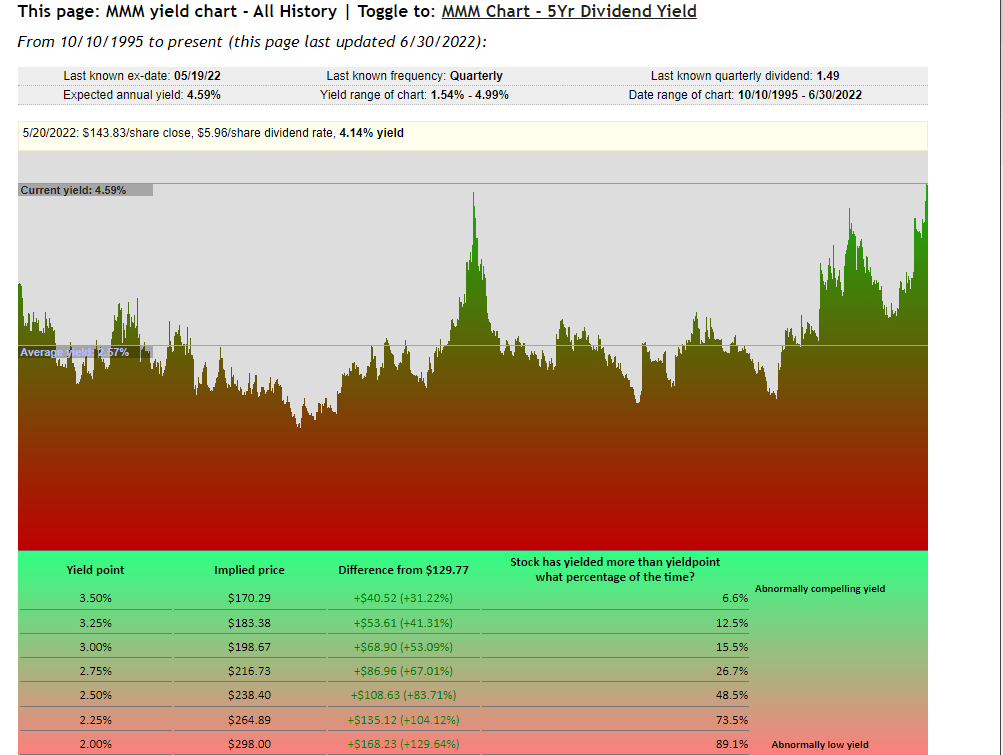
In the last 25 years, 3M’s peak yield was 4.99%, back in the Great Recession when the economy was collapsing.
- Today, we face a potential mild recession in 2023
In the last quarter-century MMM’s yield was only higher than 3.5% 6.6% of the time and today it’s 4.6%. What does that potential mean?
Wait for a fat pitch and then swing for the fences.” – Warren Buffett
That 3M is one of the best Buffett-style “fat pitches” you can buy from an A-rated dividend king.
So let me show you the five reasons I just recommended 3M for Dividend Kings members, and why it’s the best time in 11 years to consider adding some of this legendary dividend growth blue-chip to your portfolio.
Reason One: Lawsuit Concerns Are Likely Overblown
3M Has Considerable Near-Term Challenges, but Long-Term Discount Persists
Litigation fears are an overhang on 3M’s stock, which we believe is responsible for the persistent price-to-value gap. Still, we think the market somewhat fails to appreciate 3M’s short-cycle nature that benefits during the early stage of a recovery. Furthermore, we think litigation fears are overblown.” – Morningstar
Bloomberg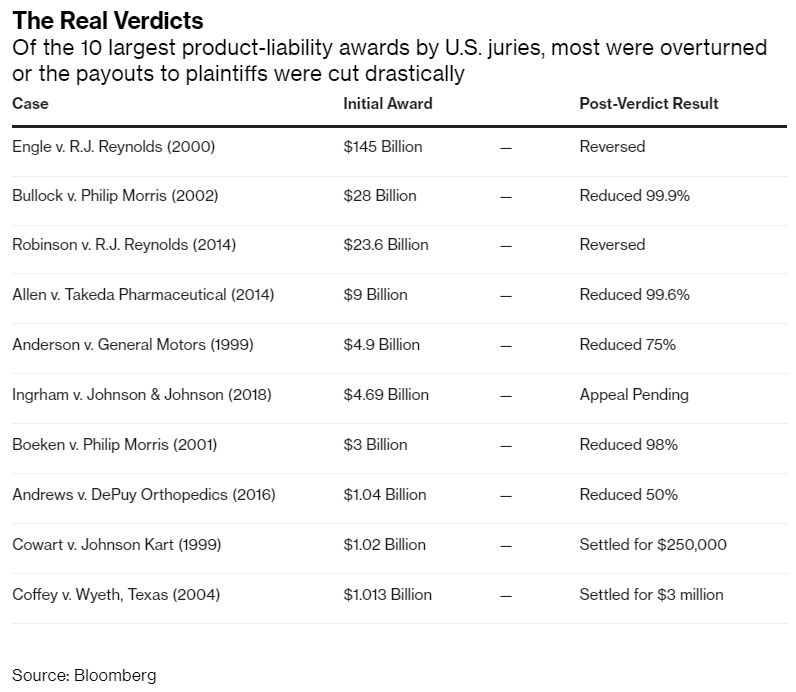
PFAS liabilities are not likely to break MMM’s safe dividend thesis.
Terrifying jury awards might get the headlines but they almost never actually happen.
The bigger the award the more likely it is to be reversed or slashed by 50% to 99.9% on appears.
Two U.S. Army veterans in late January were each awarded $15 million in compensatory and $40 million in punitive damages, ballooning the sum of damages awarded so far to more than $160 million, according to lawyers for the plaintiffs…
JPMorgan’s Tusa this month increased what he called a conservative estimate of 3M’s liabilities to a range of $2 billion to $185 billion, reflecting how thousands more claims are being moved to the court’s active docket for possible trial preparation.” – Bloomberg
Worst-case PFAS liabilities are $20 billion according to Bloomberg.
- $205 billion in worst-case liabilities according to Bloomberg and JPMorgan
- this is why the stock is in a 50% bear market right now
- but very unlikely to actually happen
The intelligent investor is a realist who buys from pessimists and sells to optimists.” – Ben Graham, The Intelligent Investor
That’s a very wide range of potential legal liabilities but remember that the actual amount is likely to be on the lower end AND 3M is likely to pay it over 30 years.
As for 3M’s combat arms litigation, we earmark a liability of just over $3 billion based on inflation-adjusted comparable cases and the number of cases pending.” – Morningstar
Morningstar’s $3 billion in estimated final legal liabilities over 15 to 30 years is $100 million to $200 million per year.
- 3M’s 2021 free cash flow was $5.6 billion
- dividend cost: $3.35 billion
- post-dividend free cash flow: $2.25 billion
- $3.4 billion in cash
- 3M can cover a final legal bill of $66 billion over the next 30 years without putting the dividend at significant risk (earplugs and PFAS)
- though it would grow very slowly (token rate)
- slow dividend growth expected through at least 2025
Reason Two: 3M Is The Complete Package
Here is the bottom line upfront on 3M.
Reasons To Potentially Buy MMM Today
- 92% quality low-risk 13/13 Ultra SWAN dividend king
- 91st percentile quality on the Master List (47th highest quality company)
- 93% dividend safety score
- 64-year dividend growth streak
- 4.6% very safe yield
- 0.5% average recession dividend cut risk
- 1.4% severe recession dividend cut risk
- 38% conservatively undervalued (potential Ultra Value strong buy)
- Fair Value: $208.06 (19.0X earnings)
- 11.9X forward earnings vs. 18.5X to 20.5X historical
- 9.1X cash-adjusted earnings
- A+ negative outlook credit rating = 0.6% 30-year bankruptcy risk
- 71st industry percentile risk management consensus = Good
- 4% to 9% CAGR margin-of-error growth consensus range
- 8% CAGR median growth consensus
- 5-year consensus total return potential: 15% to 20% CAGR
- base-case 5-year consensus return potential: 18% CAGR (2.5X S&P consensus)
- consensus 12-month total return forecast: 27% (14.1 PE)
- Fundamentally Justified 12-Month Returns: 65% CAGR
MMM Long-Term Growth Outlook Is Intact
| Metric | 2021 Growth Consensus | 2022 Growth Consensus | 2023 Growth Consensus | 2024 Growth Consensus |
2025 Growth Consensus |
| Sales | 9% | 2% | 4% | 3% | 7% |
| Dividend | 1% | 1% | 4% | 2% (66-Year Growth Streak) | NA |
| EPS | 16% | 7% | 5% | 3% | 11% |
| Operating Cash Flow | -9% | 0% | 10% | 5% | NA |
| Free Cash Flow | -12% | -5% | 14% | 9% | 11% |
| EBITDA | 6% | 4% | 5% | 4% | NA |
| EBIT (operating income) | 8% | 6% | 6% | 2% | NA |
(Source: FAST Graphs, FactSet)
Analysts aren’t yet pricing in a recession but the decline in 2023 if it happens, should be on the order of -5% to -10%.
Rolling Returns Since April 1985
(Source: Portfolio Visualizer Premium)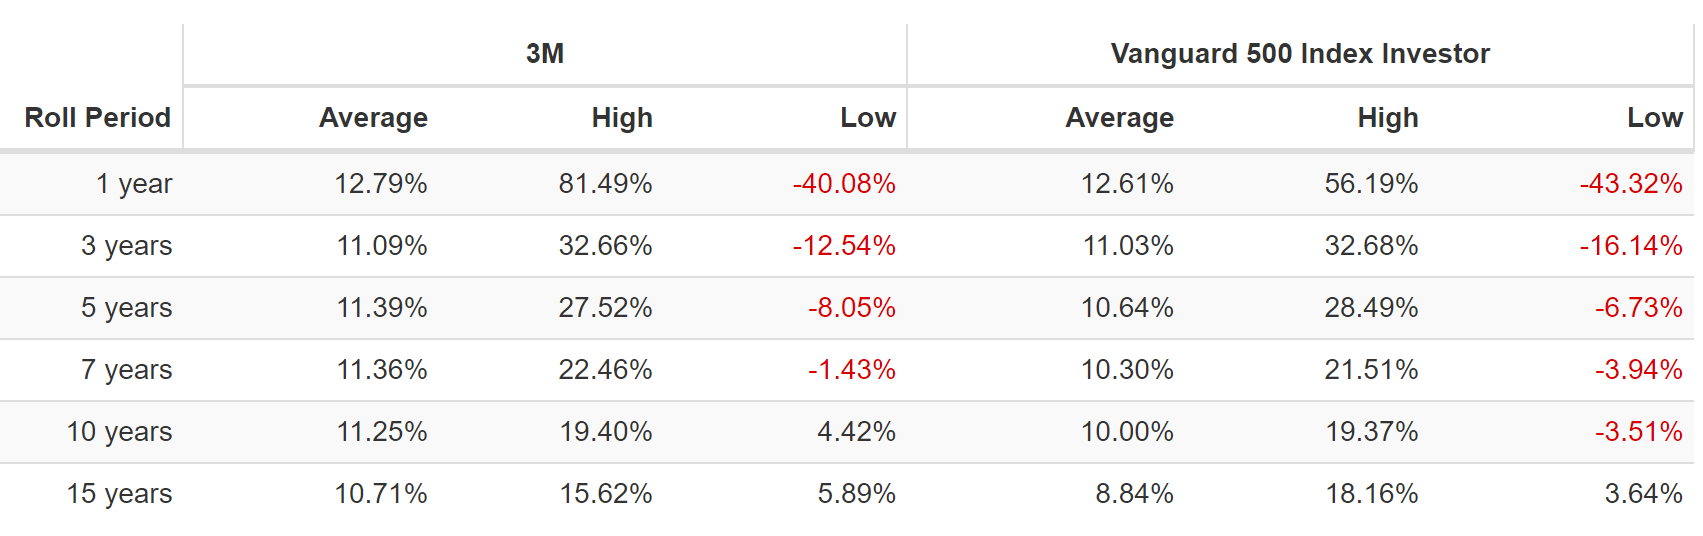
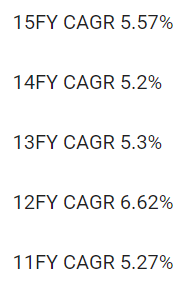
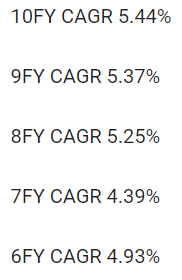
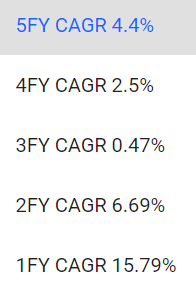
MMM is a consistently modest market beater over the last 37 years but from bear market lows it’s capable of returns as strong as 16% for the next 15 years and 19% for the next 10 years.
- 8.8X return in 15 years
- 5.9X return in 10 years
At 14.6% long-term return potential, 3M is trading at some of the most attractive valuations in its history.
MMM 2024 Consensus Total Return Potential
(Source: FAST Graphs, FactSet) (Source: FAST Graphs, FactSet)
If MMM grows as analysts expect by 2024 and returns to historical mid-range fair value it could deliver 88% total returns or 29% annually.
- Buffett-like returns from the best aristocrat bargain hiding in plain sight
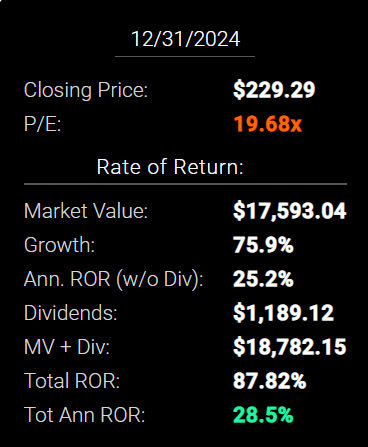
MMM 2027 Consensus Total Return Potential
(Source: FAST Graphs, FactSet)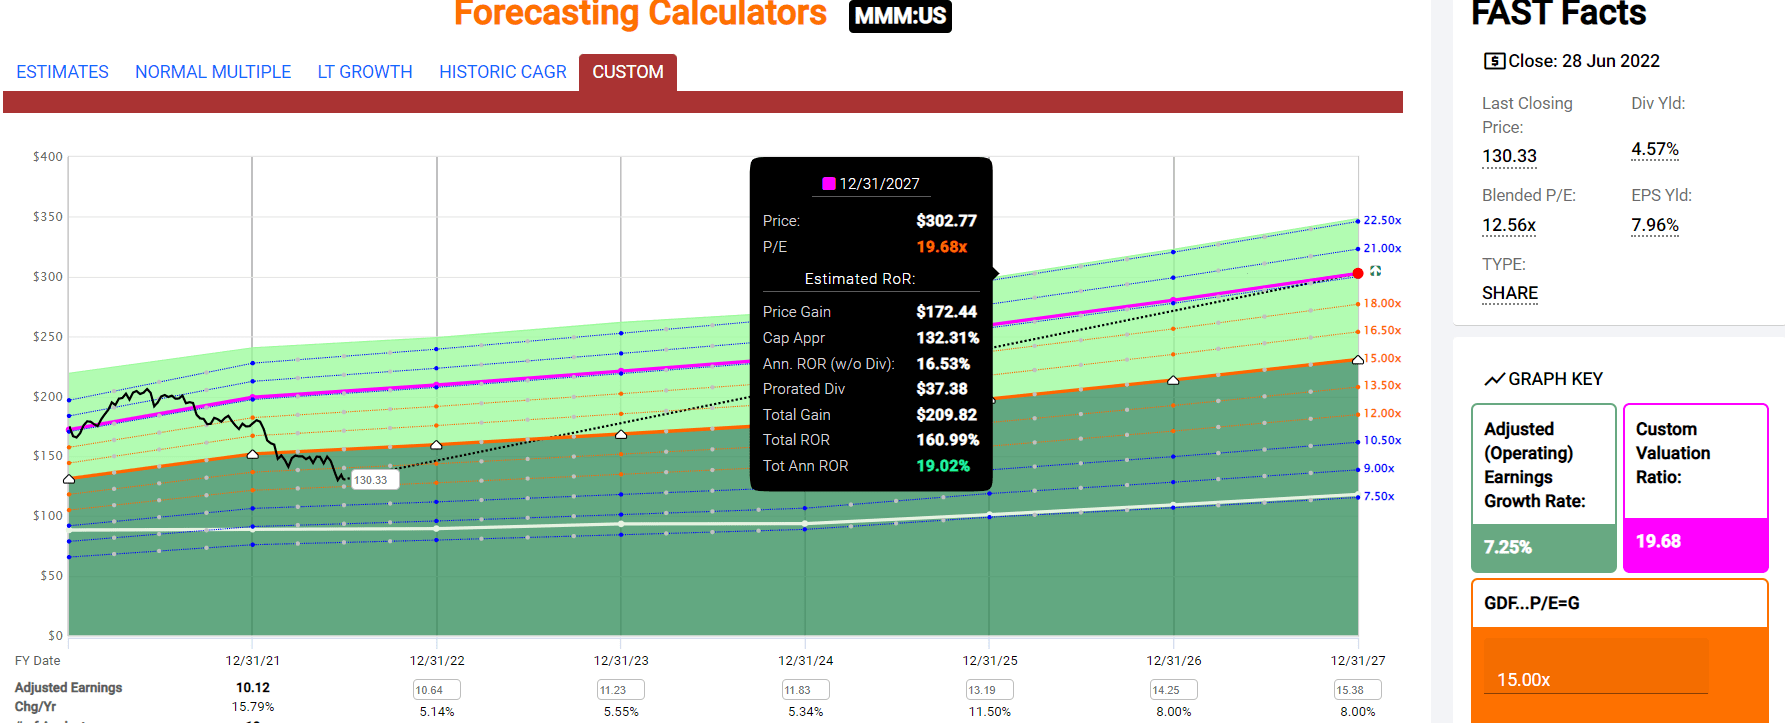
(Source: FAST Graphs, FactSet)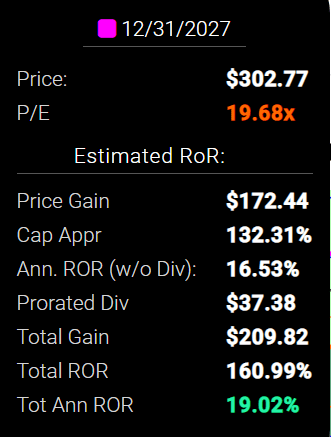
By 2027, if MMM grows as expected and returns to historical mid-range fair value, it could deliver 161% total returns or 19% annually.
- about 2.5X the S&P 500 consensus
- Buffett-like return potential
MMM Long-Term Consensus Total Return Potential
| Investment Strategy | Yield | LT Consensus Growth | LT Consensus Total Return Potential | Long-Term Risk-Adjusted Expected Return | Long-Term Inflation And Risk-Adjusted Expected Returns | Years To Double Your Inflation & Risk-Adjusted Wealth |
10-Year Inflation And Risk-Adjusted Expected Return |
| 3M | 4.4% | 8.0% | 12.4% | 8.7% | 6.2% | 11.6 | 1.83 |
| High-Yield | 3.1% | 12.7% | 15.8% | 11.1% | 8.6% | 8.4 | 2.28 |
| Dividend Aristocrats | 2.4% | 8.5% | 10.9% | 7.6% | 5.2% | 14.0 | 1.65 |
| S&P 500 | 1.8% | 8.5% | 10.3% | 7.2% | 4.7% | 15.2 | 1.59 |
(Sources: Morningstar, FactSet, Ycharts)
- analysts expect MMM to modestly outperform the dividend aristocrats and S&P 500 over time
- add 1.6% to that over the next 30 years for valuation mean reversion
- 14.6% long-term returns from one of the world’s most dependable dividend kings
MMM Total Returns Since April 1985
(Source: Portfolio Visualizer Premium)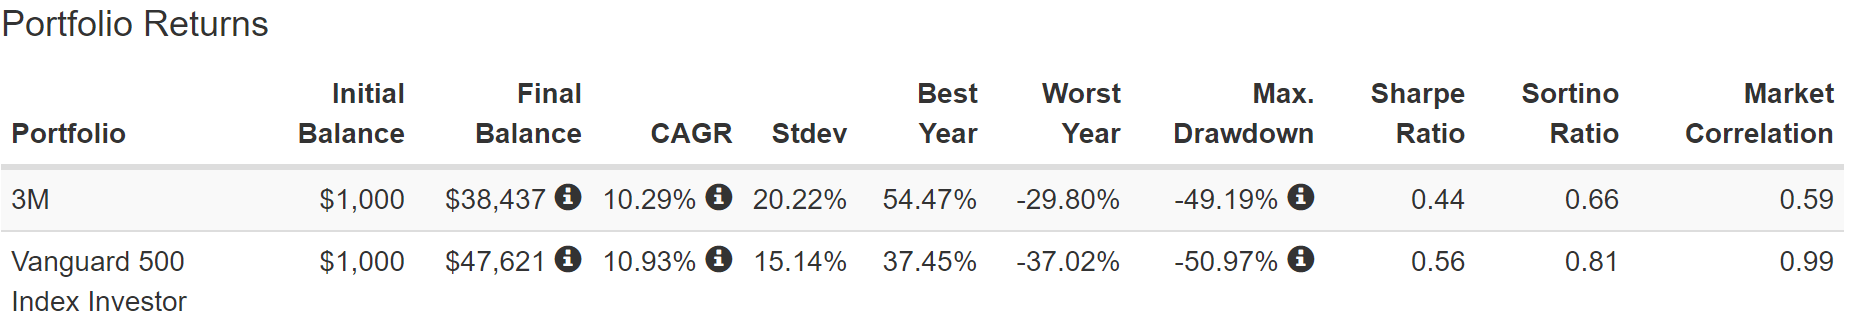
(Source: Portfolio Visualizer Premium)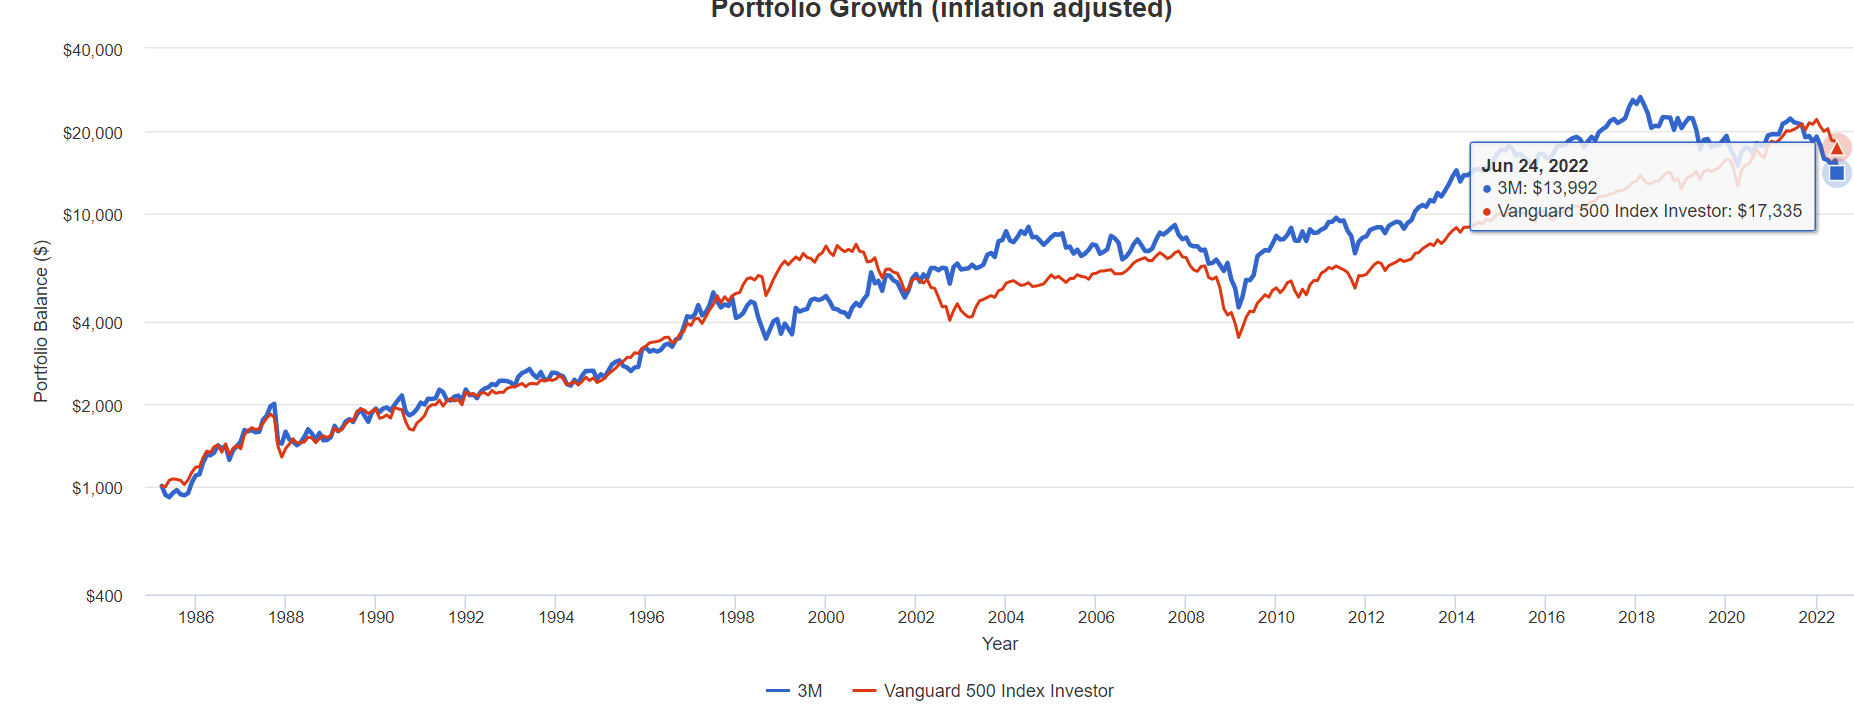
MMM was beating the market over 37 years before its recent 50% bear market.
- 38X return since 1985
- growing at 8% CAGR
- 14X adjusted for inflation
- including a 50% bear market (40% decline at the moment)
- rolling returns smooth out bear markets and are consistent with historical returns
- which are modestly higher than the S&P and aristocrats that are expected to continue in the future
A Dividend Growth Blue-Chip You Can Trust
occasional special dividends explain the spikes in income ((Source: Portfolio Visualizer Premium))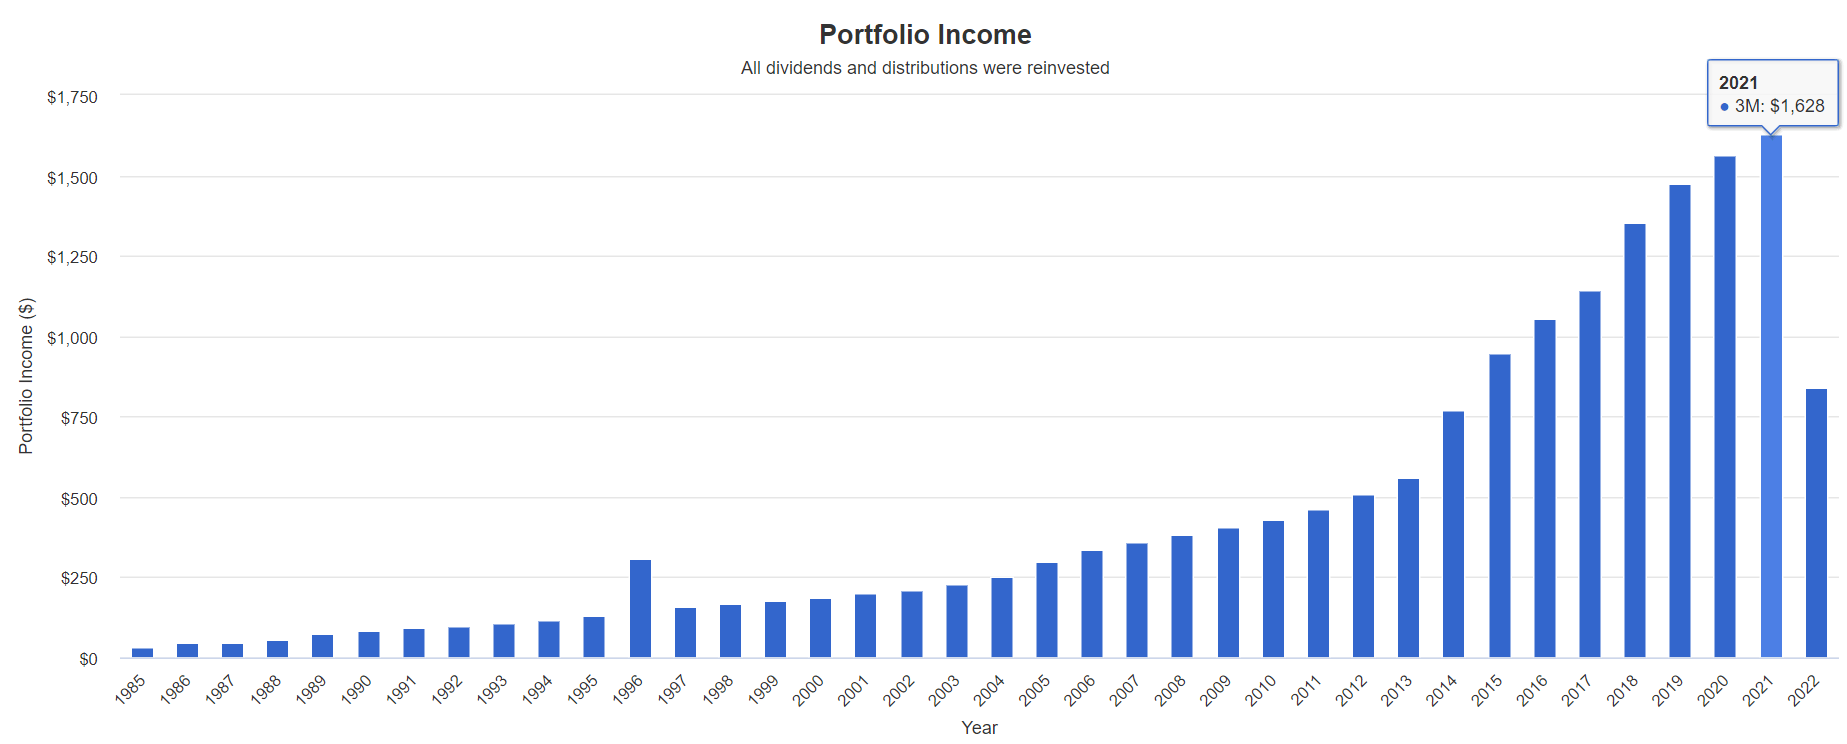
| Portfolio | 1986 Income Per $1,000 Investment | 2022 Income Per $1,000 Investment | Annual Income Growth | Starting Yield | 2022 Yield On Cost |
| 3M | $46 | $1,680 | 10.51% | 4.6% | 168.0% |
(Source: Portfolio Visualizer Premium)
MMM’s yield in 1986 was 4.6%, similar to today, and it delivered 10.5% annual income growth over 36 years.
- the yield on cost in 2022 is 168%
What about the future?
| Analyst Consensus Income Growth Forecast | Risk-Adjusted Expected Income Growth | Risk And Tax-Adjusted Expected Income Growth |
Risk, Inflation, And Tax Adjusted Income Growth Consensus |
| 12.7% | 8.9% | 7.5% | 5.0% |
(Source: DK Research Terminal, FactSet)
Analysts expect 13% income growth from MMM in the future, which adjusted for the risk of it not growing as expected, inflation, and taxes is about 5.0% real expected income growth.
Now compare that to what they expect from the S&P 500.
| Time Frame | S&P Inflation-Adjusted Dividend Growth | S&P Inflation-Adjusted Earnings Growth |
| 1871-2021 | 1.6% | 2.1% |
| 1945-2021 | 2.4% | 3.5% |
| 1981-2021 (Modern Falling Rate Era) | 2.8% | 3.8% |
| 2008-2021 (Modern Low Rate Era) | 3.5% | 6.2% |
| FactSet Future Consensus | 2.0% | 5.2% |
(Sources: S&P, FactSet, Multipl.com)
What about a 60/40 retirement portfolio?
- 0.5% consensus inflation, risk, and tax-adjusted income growth.
In other words, MMM is expected to generate 2.5X faster real income growth than the S&P 500 and 10X faster income growth than a 60/40.
- with incredible short, medium-term, and long-term return potential.
What inflation-adjusted returns do analysts expect in the future?
Inflation-Adjusted Consensus Return Potential: $1,000 Initial Investment
| Time Frame (Years) | 7.6% CAGR Inflation-Adjusted S&P Consensus | 8.4% Inflation-Adjusted Aristocrats Consensus | 12.1% CAGR Inflation-Adjusted MMM Consensus | Difference Between Inflation-Adjusted 3M Consensus Vs. S&P Consensus |
| 5 | $1,445.67 | $1,493.29 | $1,772.59 | $326.92 |
| 10 | $2,089.97 | $2,229.92 | $3,142.09 | $1,052.12 |
| 15 | $3,021.42 | $3,329.92 | $5,569.64 | $2,548.23 |
| 20 | $4,367.98 | $4,972.54 | $9,872.71 | $5,504.73 |
| 25 | $6,314.67 | $7,425.45 | $17,500.30 | $11,185.63 |
| 30 | $9,128.95 | $11,088.36 | $31,020.92 | $21,891.97 |
(Source: DK Research Terminal, FactSet)
Management and analysts believe that MMM could potentially deliver 31X inflation-adjusted returns over the next 30 years.
| Time Frame (Years) | Ratio Aristocrats/S&P Consensus | Ratio Inflation-Adjusted 3M Consensus vs. S&P consensus |
| 5 | 1.03 | 1.23 |
| 10 | 1.07 | 1.50 |
| 15 | 1.10 | 1.84 |
| 20 | 1.14 | 2.26 |
| 25 | 1.18 | 2.77 |
| 30 | 1.21 | 3.40 |
(Source: DK Research Terminal, FactSet)
Which is potentially 3.4X more than the S&P 500 and 180% more than the dividend aristocrats.
- the power of deep value dividend aristocrat investing
MMM Investment Decision Score
DK
(Source: DK Automated Investment Decision Tool)
For anyone comfortable with its risk profile, MMM is one of the most reasonable and prudent dividend aristocrats you can buy today.
- 38% discount vs. 2% market discount = 36% better valuation
- 4.6% yield vs. 1.7% yield (3X higher and a much safer yield at that)
- potentially 45% higher long-term return potential than S&P 500 overtime
- about 2X better risk-adjusted expected return over the next five years
- 2X more consensus dividend income over the next five years
Reason Three: 3M Is One Of The Best Companies On Earth
There are many ways to measure safety and quality and I factor in pretty much all of them.
The Dividend Kings’ overall quality scores are based on a 253-point model that includes:
-
Dividend safety
-
Balance sheet strength
-
Credit ratings
-
Credit default swap medium-term bankruptcy risk data
-
Short and long-term bankruptcy risk
-
Accounting and corporate fraud risk
-
Profitability and business model
-
Growth consensus estimates
-
Management growth guidance
-
Historical earnings growth rates
-
Historical cash flow growth rates
-
Historical dividend growth rates
-
Historical sales growth rates
-
Cost of capital
-
GF Scores
-
Long-term risk-management scores from MSCI, Morningstar, FactSet, S&P, Reuters’/Refinitiv, and Just Capital
-
Management quality
-
Dividend-friendly corporate culture/income dependability
-
Long-term total returns (a Ben Graham sign of quality)
-
Analyst consensus long-term return potential
In fact, it includes over 1,000 fundamental metrics including the 12 rating agencies we use to assess fundamental risk.
-
credit and risk management ratings make up 41% of the DK safety and quality model
-
dividend/balance sheet/risk ratings make up 82% of the DK safety and quality model
How do we know that our safety and quality model works well?
During the two worst recessions in 75 years, our safety model 87% of blue-chip dividend cuts, the ultimate baptism by fire for any dividend safety model.
How does MMM score on our comprehensive safety and quality models?
3M Dividend Safety
| Rating | Dividend Kings Safety Score (162 Point Safety Model) | Approximate Dividend Cut Risk (Average Recession) |
Approximate Dividend Cut Risk In Pandemic Level Recession |
| 1 – unsafe | 0% to 20% | over 4% | 16+% |
| 2- below average | 21% to 40% | over 2% | 8% to 16% |
| 3 – average | 41% to 60% | 2% | 4% to 8% |
| 4 – safe | 61% to 80% | 1% | 2% to 4% |
| 5- very safe | 81% to 100% | 0.5% | 1% to 2% |
| MMM | 93% | 0.5% | 1.4% |
| Risk Rating | Low-Risk (71st industry percentile risk-management consensus) | A+ Negative outlook credit rating 0.6% 30-year bankruptcy risk |
20% OR LESS Max Risk Cap Recommendation (Each) |
Long-Term Dependability
| Company | DK Long-Term Dependability Score | Interpretation | Points |
| Non-Dependable Companies | 21% or below | Poor Dependability | 1 |
| Low Dependability Companies | 22% to 60% | Below-Average Dependability | 2 |
| S&P 500/Industry Average | 61% (61% to 70% range) | Average Dependability | 3 |
| Above-Average | 71% to 80% | Very Dependable | 4 |
| Very Good | 81% or higher | Exceptional Dependability | 5 |
| MMM | 89% | Exceptional Dependability | 5 |
Overall Quality
| MMM | Final Score | Rating |
| Safety | 93% | 5/5 Very Safe |
| Business Model | 90% | 3/3 Wide And Stable Moat |
| Dependability | 89% | 5/5 Exceptional Dependability |
| Total | 92% | 13/13 Ultra SWAN Dividend King |
| Risk Rating | 3/3 Low-Risk | |
| 20% OR LESS Max Risk Cap Rec |
5% Margin of Safety For A Potentially Good Buy |
MMM is the 47th highest quality company on the Masterlist.
How significant is this? The DK 500 Master List is one of the world’s best watchlists including
-
every dividend aristocrat (S&P companies with 25+ year dividend growth streaks)
-
every dividend champion (every company, including foreign, with 25+ year dividend growth streaks)
-
every dividend king (every company with 50+ year dividend growth streaks)
-
every foreign aristocrat (every company with 20+ year dividend growth streaks)
-
40 of the world’s best growth stocks
In other words, even among the world’s best companies, MMM is higher quality than 84% of them.
Why I Trust 3M And So Can You
Minnesota Mining & Manufacturing was founded in 1902 in St. Paul, MN.
It’s survived and thrived for 120 years through:
- 19 recessions
- four depressions
- inflation as high as 22% during WWI and 20% following WWII
- interest rates as high as 20%
- 10-year US treasury yield as high as 16%
- six major pandemics
- two major oil crises
- 2 World War Wars
- the Cold War
- dozens of bear markets and corrections and mini financial panics
In other words, 3M is built to last and will likely outlive us all.
The 64-year dividend growth streak means the dividend has grown every year since 1958
- through 10 recessions
- two economic catastrophes
- inflation as high as 15%
- interest rates as high as 20%
- 10-year treasury yields as high as 16%
- 15 bear markets
- 43 corrections
- 128 pullbacks
(Source: earnings presentation)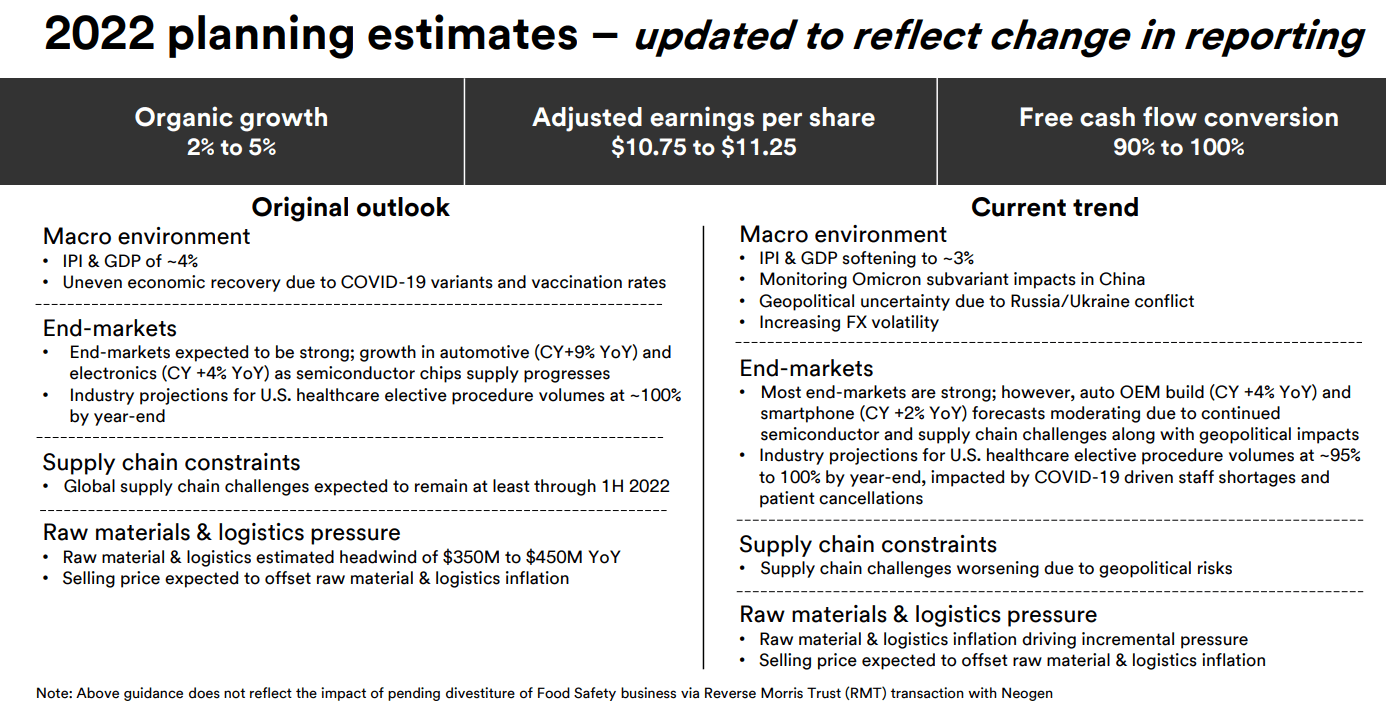
3M has plenty of challenges in the short and medium-term but these are now baked into analyst estimates.
So let’s take a look at those to see why 3M’s investment thesis remains intact.
Quantitative Analysis: The Math Backing Up The Investment Thesis
Ben Graham recommended combining qualitative (the story) analysis with quantitative analysis looking at the past, present, and likely future.
3M Credit Ratings
| Rating Agency | Credit Rating | 30-Year Default/Bankruptcy Risk | Chance of Losing 100% Of Your Investment 1 In |
| S&P | A+ Negative Outlook | 0.60% | 166.7 |
| Moody’s | A1 (A+ equivalent) Stable Outlook | 0.60% | 166.7 |
| Consensus | A+ Stable Outlook | 0.60% | 166.7 |
(Source: S&P, Fitch, Moody’s)
Rating agencies estimate 3M’s fundamental risk at 0.6%.
- a 1 in 167 chance of losing all your money buying MMM today
S&P Global Ratings’ negative outlook on 3M reflects at least a one-third chance that we could lower our ratings if the company fails to delever its balance sheet in the manner that we expect over the next 12-24 months. Although we expect operating performance to improve over the next two years, there are risks to our forecast if end-market weakness continues to persist, if there are material calls on the company’s cash from litigation expenses or liabilities, or if the company pursues more aggressive financial policies, particularly with regards to share repurchases or further debt-financed acquisitions.
We could lower our rating on 3M if we expect its net-adjusted debt-to-EBITDA ratio to remain above the 2x area and FOCF weakens to less than 25% of the debt. We believe these metrics would provide a limited cushion in the event of potential future material calls on cash, including PFA-related litigation, and would cause us to lower the rating.
We could revise the outlook to stable if the company reduces its leverage to below 2x while maintaining FOCF above 25% of outstanding debt. Under this scenario, we would also need to be confident that potential settlements or legal expenses related to PFAS litigation are not expected to materially weaken these improved credit measures.” – S&P
S&P downgraded MMM in February 2020 at the start of the pandemic citing legal liability risk and concerns about short-term leverage.
MMM Leverage Consensus Forecast
| Year | Debt/EBITDA | Net Debt/EBITDA (3.0 Or Less Safe According To Credit Rating Agencies) |
Interest Coverage (8+ Safe) |
| 2020 | 2.15 | 1.62 | 13.72 |
| 2021 | 1.87 | 1.38 | 15.16 |
| 2022 | 1.70 | 1.23 | 19.63 |
| 2023 | 1.63 | 1.00 | 20.93 |
| 2024 | 1.58 | 0.73 | 19.43 |
| Annualized Change | -7.35% | -17.95% | 9.10% |
(Source: FactSet Research Terminal)
MMM Balance Sheet Consensus Forecast
| Year | Total Debt (Millions) | Cash | Net Debt (Millions) | Interest Cost (Millions) | EBITDA (Millions) | Operating Income (Millions) |
| 2020 | $18,795 | $4,634 | $14,161 | $499 | $8,755 | $6,844 |
| 2021 | $17,363 | $4,564 | $12,799 | $486 | $9,285 | $7,369 |
| 2022 | $16,406 | $4,744 | $11,914 | $394 | $9,657 | $7,734 |
| 2023 | $16,406 | $5,319 | $10,092 | $391 | $10,095 | $8,185 |
| 2024 | $16,678 | $4,354 | $7,730 | $443 | $10,545 | $8,607 |
| 2025 | NA | NA | NA | NA | $11,549 | $9,536 |
| Annualized Growth | -2.94% | -1.55% | -14.04% | -2.93% | 5.70% | 6.86% |
(Source: FactSet Research Terminal)
MMM’s debt is drifting steadily lower and its net debt is falling at 14% per year while its cash flows are growing at mid-single digits.
MMM Bond Profile
(Source: FactSet Research Terminal)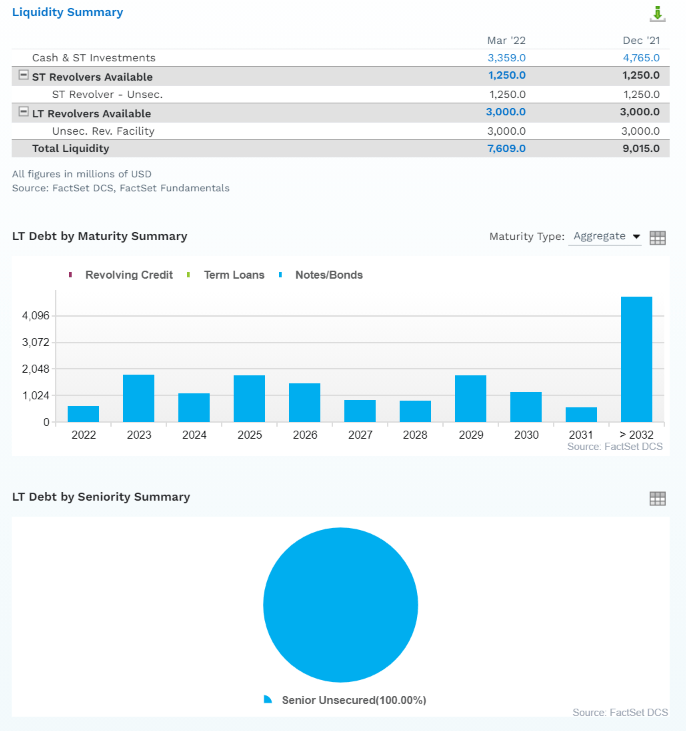
(Source: FactSet Research Terminal)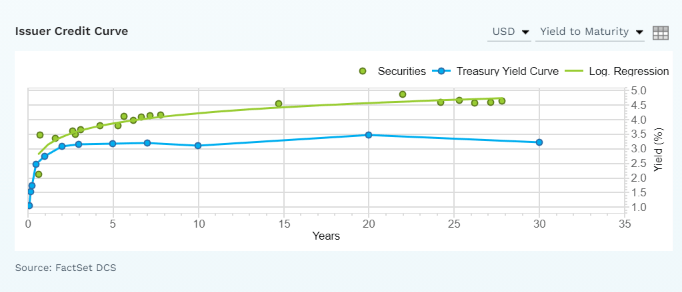
- $7.6 billion in liquidity
- well staggered debt maturities (little problem refinancing maturing bonds)
- 100% unsecured bonds (maximum financial flexibility)
- bond investors are so confident in MMM’s long-term prospects they were willing to buy its 28-year bonds at 4.6% interest rates
- 2.52% average borrowing cost
- 0.05% inflation-adjusted borrowing costs vs. 17.6% returns on capital
- returns on capital are 352X higher than real borrowing cost
MMM Credit Default SWAPs: Real-Time Fundamental Risk Analysis From The Bond Market
(Source: FactSet Research Terminal)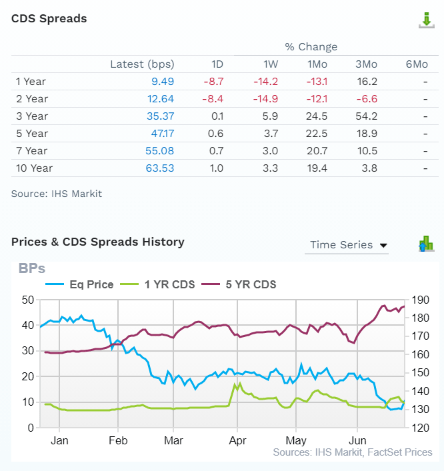
Credit default SWAPs are the insurance policies bond investors take out against default.
- they represent real-time fundamental risk assessment from the “smart money” on Wall Street
- MMM’s 5-year default risk has increased over the last six months
- from 0.3% to 0.47%
- the bond market is pricing in a 1.89% 30-year default risk, which is consistent with A- credit ratings
- basically, analysts, rating agencies, and the bond market all agree
- MMM’s thesis is intact
- 22 analysts, 7 rating agencies, and the bond market make up our MMM expert consensus
- 29 expert consensus + the bond market monitoring MMM’s risk profile
- how we track fundamental risk in real-time
- to ensure high-probability/low-risk investment recommendations
MMM GF Score: The Newest Addition To The DK Safety And Quality Model
The GF Score is a ranking system that has been found to be closely correlated to the long-term performances of stocks by backtesting from 2006 to 2021.” – GuruFocus
GF Score takes five key aspects into consideration. They are:
- Financial Strength
- Profitability
- Growth
- Valuation
- Momentum
(Source: Gurufocus Premium)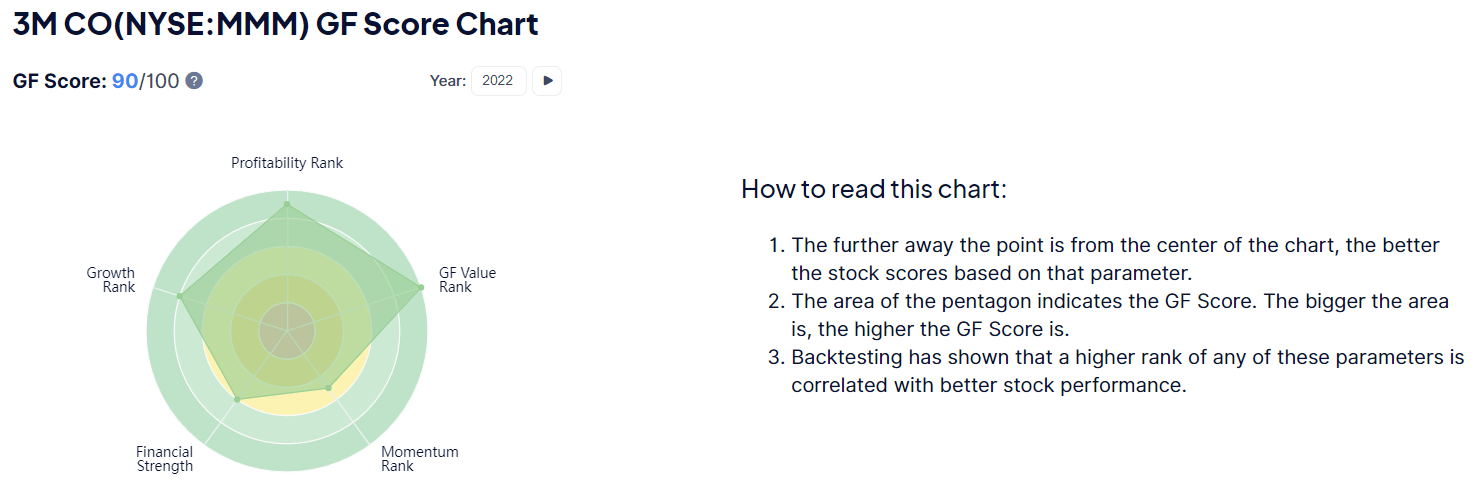
MMM’s excellent score of 90/100 confirms its industry-leading fundamental quality.
MMM Profitability: Wall Street’s Favorite Quality Proxy
(Source: Gurufocus Premium)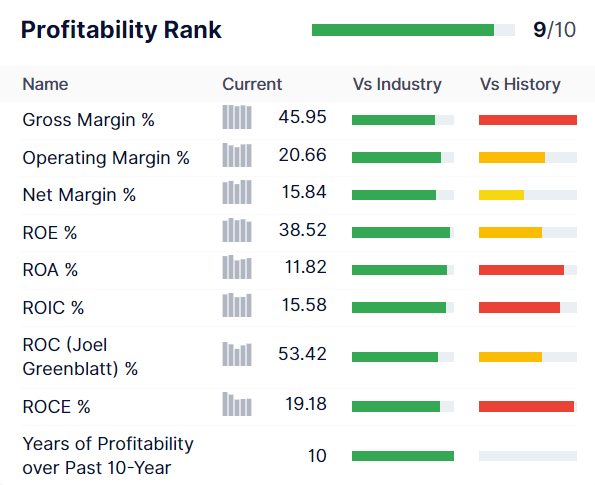
MMM’s historical profitability is in the top 10% of its peers
MMM Trailing 12-Month Profitability Vs. Peers
| Metric | TTM | Industry Percentile | Major Conglomerates More Profitable Than MMM (Out Of 519) |
| Gross Margins | 45.95% | 81.52 | 96 |
| Operating Margin | 20.66% | 87.17 | 67 |
| Net Margin | 15.84% | 82.7 | 90 |
| Return On Equity | 38.52% | 95.79 | 22 |
| Return On Assets | 11.82% | 92.68 | 38 |
| Returns On Invested Capital | 15.58% | 92.38 | 40 |
| Return On Capital (Greenblatt) | 53.42% | 83.85 | 84 |
| Return On Capital Employed | 19.18% | 86.19 | 72 |
| Average | 27.62% | 87.79 | 63 |
(Source: GuruFocus Premium)
In the last year, MMM’s profitability has been in the top 12% of peers.
Ycharts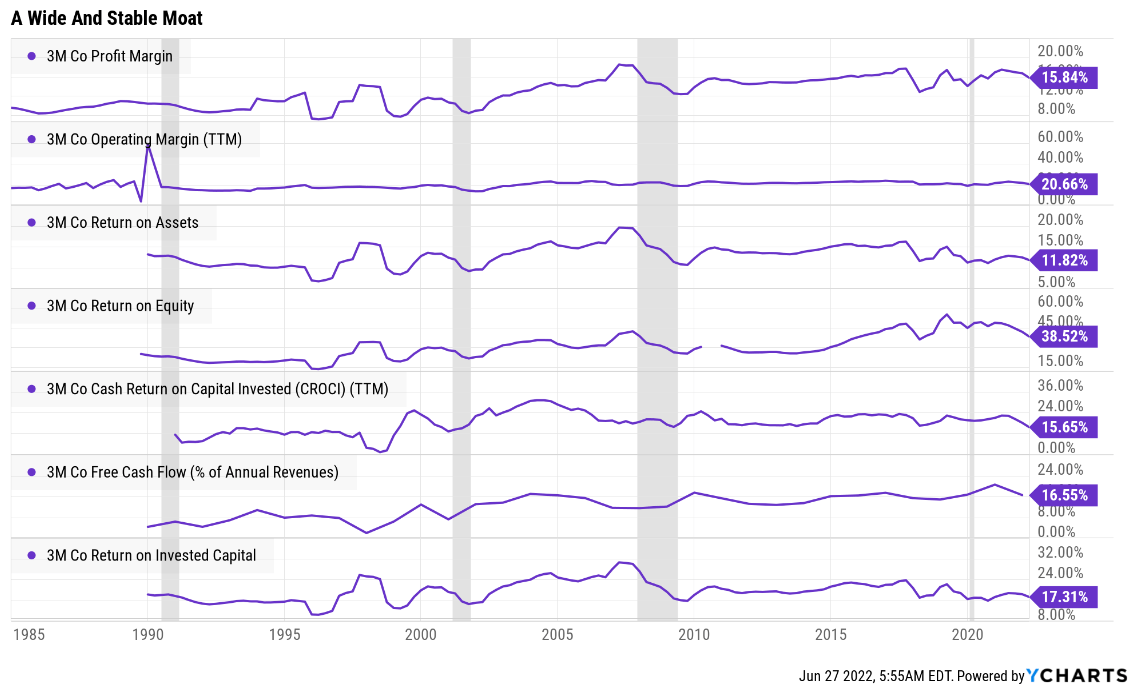
Over the last 30 years, MMM’s profitability has been relatively stable adjusting for the natural cyclicality of its industry.
- confirming a wide and stable moat
MMM Profit Margin Consensus Forecast
| Year | FCF Margin | EBITDA Margin | EBIT (Operating) Margin | Net Margin | Return On Capital Expansion |
Return On Capital Forecast |
| 2020 | 20.5% | 27.2% | 21.3% | 15.8% | 1.10 | |
| 2021 | 16.5% | 26.3% | 20.8% | 16.7% | TTM ROC | 53.42% |
| 2022 | 15.7% | 26.9% | 21.6% | 17.2% | Latest ROC | 49.59% |
| 2023 | 16.6% | 27.3% | 22.1% | 17.3% | 2025 ROC | 58.78% |
| 2024 | 17.5% | 27.2% | 22.2% | 17.0% | 2025 ROC | 54.57% |
| 2025 | 17.9% | 27.8% | 22.9% | NA | Average | 56.68% |
| 2026 | NA | NA | NA | NA | Industry Median | 13.66% |
| 2027 | NA | NA | NA | NA | MMM/Industry Median | 4.15 |
| Annualized Growth | -2.71% | 0.42% | 1.52% | 1.88% | Vs. S&P | 3.88 |
| Annualized Growth (Post Pandemic) | 1.99% | 1.41% | 2.42% | 0.57% |
(Source: FactSet Research Terminal)
Looking beyond the pandemic analysts expect 3M’s industry-leading margins to keep rising steadily.
Return on capital is annual pre-tax profit/operating capital (the money it takes to run the business). ROC is Greenblatt’s gold standard proxy for quality and moatiness.
- S&P 500 ROC is 14.6%
- for each $1 it takes to run the average S&P company they generate $0.146 in annual pre-tax profit
- it takes about 6.5 years for new investments to pay for themselves
For MMM ROC was 53% in the last year and is expected to remain relatively stable over the coming years.
- for every $1 it takes to run MMM it is expected to generate $0.57 in annual pre-tax profit
- investments take about 2 years to pay for themselves
By the definition of one of the greatest investors in history, MMM is about 4X higher quality than its peers and 4X higher quality than the S&P 500.
(Source: GuruFocus Premium)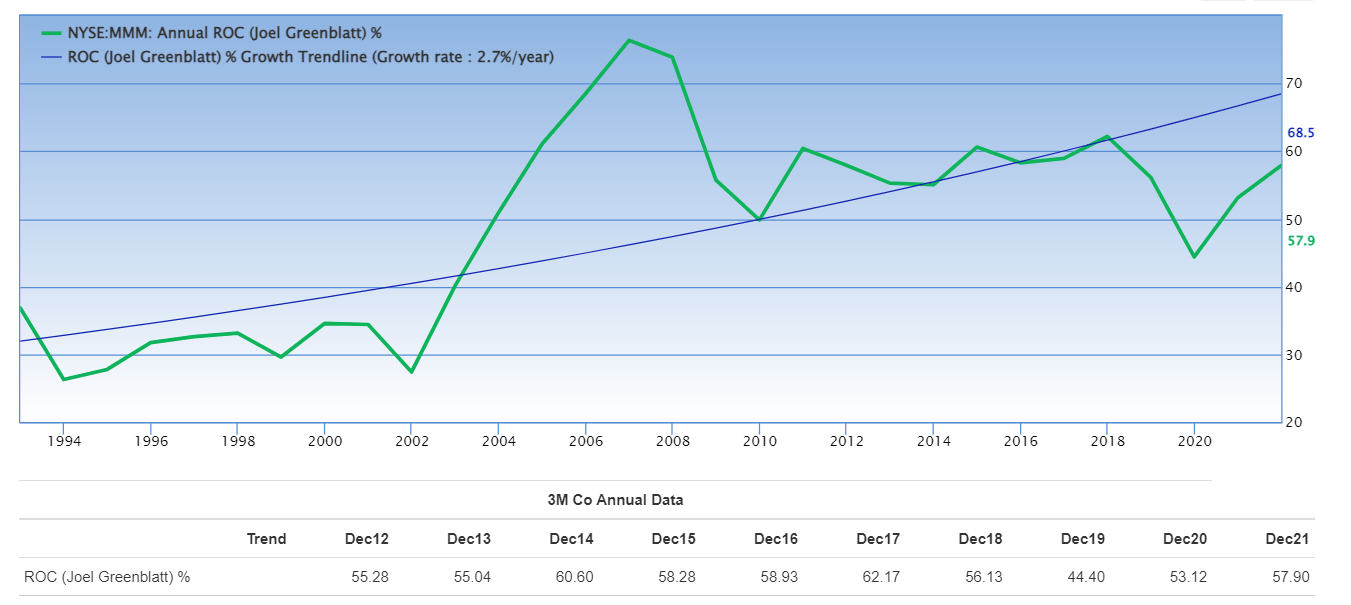
Over the last 30 years, MMM’s ROC has been trending higher at 2.7% annually, confirming its wide and stable moat.
Reason Four: Steady Growth Prospects For Decades To Come
At the current cash-adjusted PE of 9X, you might think 3M is a flailing or even dying company. Here’s what analysts actually expect.
MMM Medium-Term Growth Consensus Forecast
| Year | Sales | Free Cash Flow | EBITDA | EBIT (Operating Income) | Net Income |
| 2020 | $32,184 | $6,612 | $8,755 | $6,844 | $5,088 |
| 2021 | $35,355 | $5,851 | $9,285 | $7,369 | $5,921 |
| 2022 | $35,849 | $5,629 | $9,657 | $7,734 | $6,161 |
| 2023 | $36,972 | $6,142 | $10,095 | $8,185 | $6,386 |
| 2024 | $38,711 | $6,759 | $10,545 | $8,607 | $6,594 |
| 2025 | $41,578 | $7,444 | $11,549 | $9,536 | NA |
| Annualized Growth | 5.26% | 2.40% | 5.70% | 6.86% | 6.70% |
| Annualized Growth (Post Pandemic) | 4.14% | 6.20% | 5.61% | 6.66% | 3.65% |
| Cumulative Over The Next 3 Years | $111,532 | $18,530 | $30,297 | $24,526 | $19,141 |
(Source: FactSet Research Terminal)
MMM is expected to grow steadily over time and convert 97% of its net income into free cash flow.
- excellent for an industrial
- FCF is what pays the dividend
Modest but steady growth in both the top and bottom lines with almost $19 billion in free cash flow over the next three years.
MMM Dividend Growth Consensus Forecast
| Year | Dividend Consensus | FCF Consensus | FCF Payout Ratio | Retained (Post-Dividend) Free Cash Flow | Buyback Potential | Debt Repayment Potential |
| 2022 | $6.02 | $8.24 | 73.1% | $1,263 | 1.65% | 7.7% |
| 2023 | $6.24 | $9.57 | 65.2% | $1,895 | 2.48% | 11.5% |
| 2024 | $6.38 | $12.61 | 50.6% | $3,545 | 4.64% | 21.6% |
| Total 2022 Through 2024 | $18.64 | $30.42 | 61.3% | $6,702.82 | 8.77% | 40.86% |
| Annualized Rate | 2.95% | 23.71% | -16.78% | 67.52% | 67.52% | 67.52% |
(Source: FactSet Research Terminal)
Credit rating agencies consider 60% a safe payout ratio for industrials.
MMM’s payout ratio was elevated during the pandemic and management is using very conservative dividend increases to bring it back down to safe levels.
By 2024 3M’s consensus FCF payout ratio is down to 51% and likely it will keep falling until we get further information about actual future legal liabilities.
3M’s post-dividend retained free cash flow for the next three years is an estimated $7 billion, enough to pay off 41% of its debt, or buy back 9% of shares at current valuations.
MMM Buyback Consensus Forecast
| Year | Consensus Buybacks ($ Millions) | % Of Shares (At Current Valuations) | Market Cap |
| 2022 | $2,085.0 | 2.7% | $76,442 |
| 2023 | $2,011.0 | 2.6% | $76,442 |
| 2024 | $2,195.0 | 2.9% | $76,442 |
| Total 2022-2024 | $6,291.00 | 8.2% | $76,442 |
| Annualized Rate | 2.81% | Average Annual Buybacks | $2,097.00 |
(Source: FactSet Research Terminal)
Analysts expect 3M to still buy back $2.1 billion worth of shares during the next three years, a total of $6.3 billion that could potentially reduce the share count by nearly 3% per year at current valuations.
Ycharts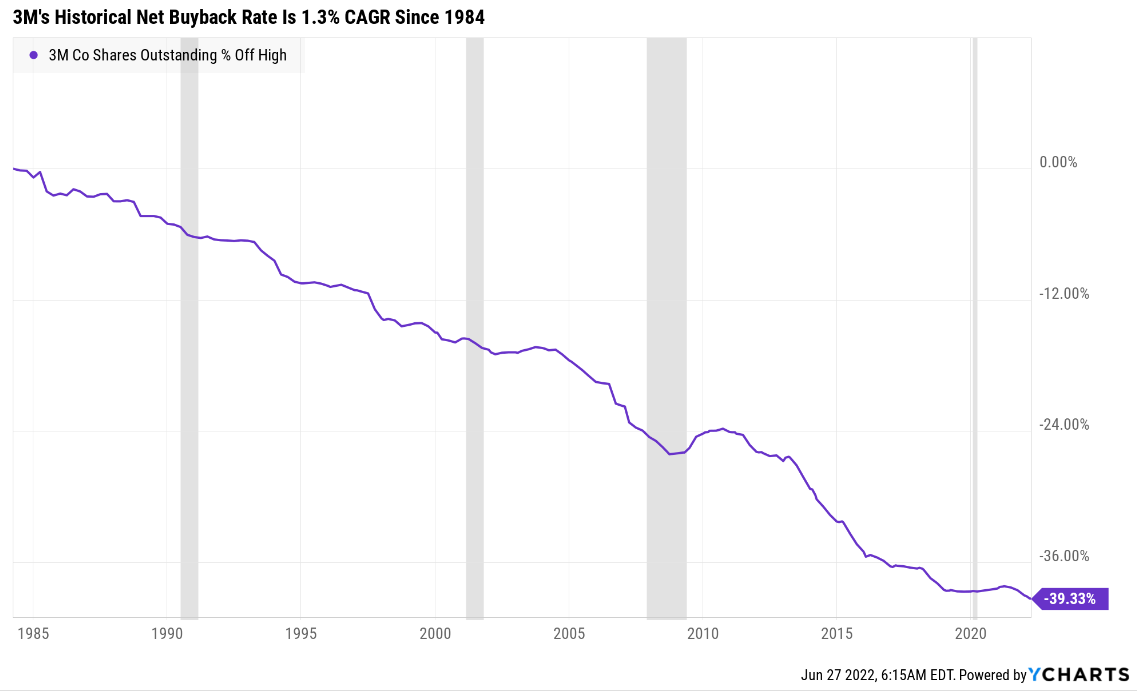
3M’s historical net buyback rate over 38 years is 1.3% per year.
- significant increase in the historical rate possible due to the best valuation in 11 years
| Time Frame (Years) | Net Buyback Rate | Shares Remaining | Net Shares Repurchased | Each Share You Own Is Worth X Times More (Not Including Future Growth And Dividends) |
| 5 | 1.3% | 93.67% | 6.33% | 1.07 |
| 10 | 1.3% | 87.73% | 12.27% | 1.14 |
| 15 | 1.3% | 82.18% | 17.82% | 1.22 |
| 20 | 1.3% | 76.97% | 23.03% | 1.30 |
| 25 | 1.3% | 72.10% | 27.90% | 1.39 |
| 30 | 1.3% | 67.53% | 32.47% | 1.48 |
(Source: DK Research Terminal, Ycharts)
If MMM buys back shares at its historical rate then it could repurchase 33% of shares over the next 30 years.
| Time Frame (Years) | Net Buyback Rate | Shares Remaining | Net Shares Repurchased | Each Share You Own Is Worth X Times More (Not Including Future Growth And Dividends) |
| 5 | 2.8% | 86.72% | 13.28% | 1.15 |
| 10 | 2.8% | 75.20% | 24.80% | 1.33 |
| 15 | 2.8% | 65.21% | 34.79% | 1.53 |
| 20 | 2.8% | 56.55% | 43.45% | 1.77 |
| 25 | 2.8% | 49.04% | 50.96% | 2.04 |
| 30 | 2.8% | 42.53% | 57.47% | 2.35 |
(Source: DK Research Terminal, Ycharts)
If MMM buys back shares as aggressively as analysts currently expect, over 30 years it should repurchase almost 60% of its shares.
MMM Long-Term Growth Outlook
(Source: FactSet Research Terminal)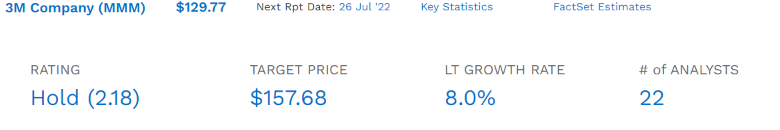
- 5.7% to 8.0% growth consensus range (five sources)
- the median consensus from all 22 analysts is 8.0%
- the 35-year growth rate is 8%
- the 20-year growth rate is 8%
How accurate are analyst forecasts based on management guidance?
(Source: FAST Graphs, FactSet Research) (Source: FAST Graphs, FactSet Research)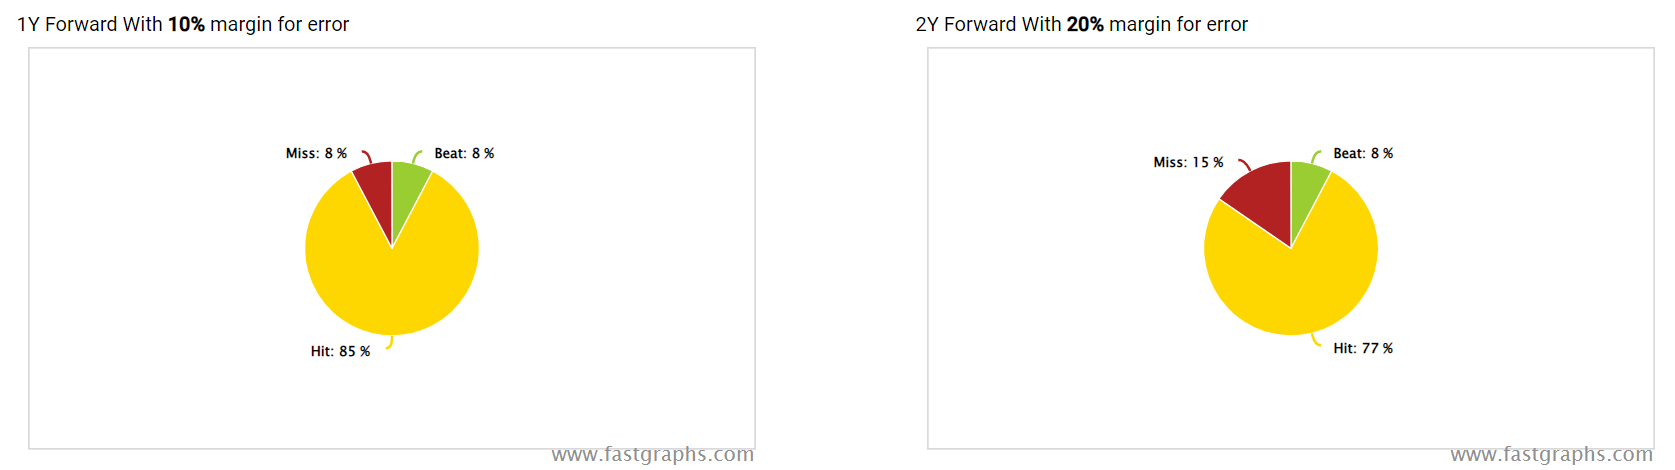
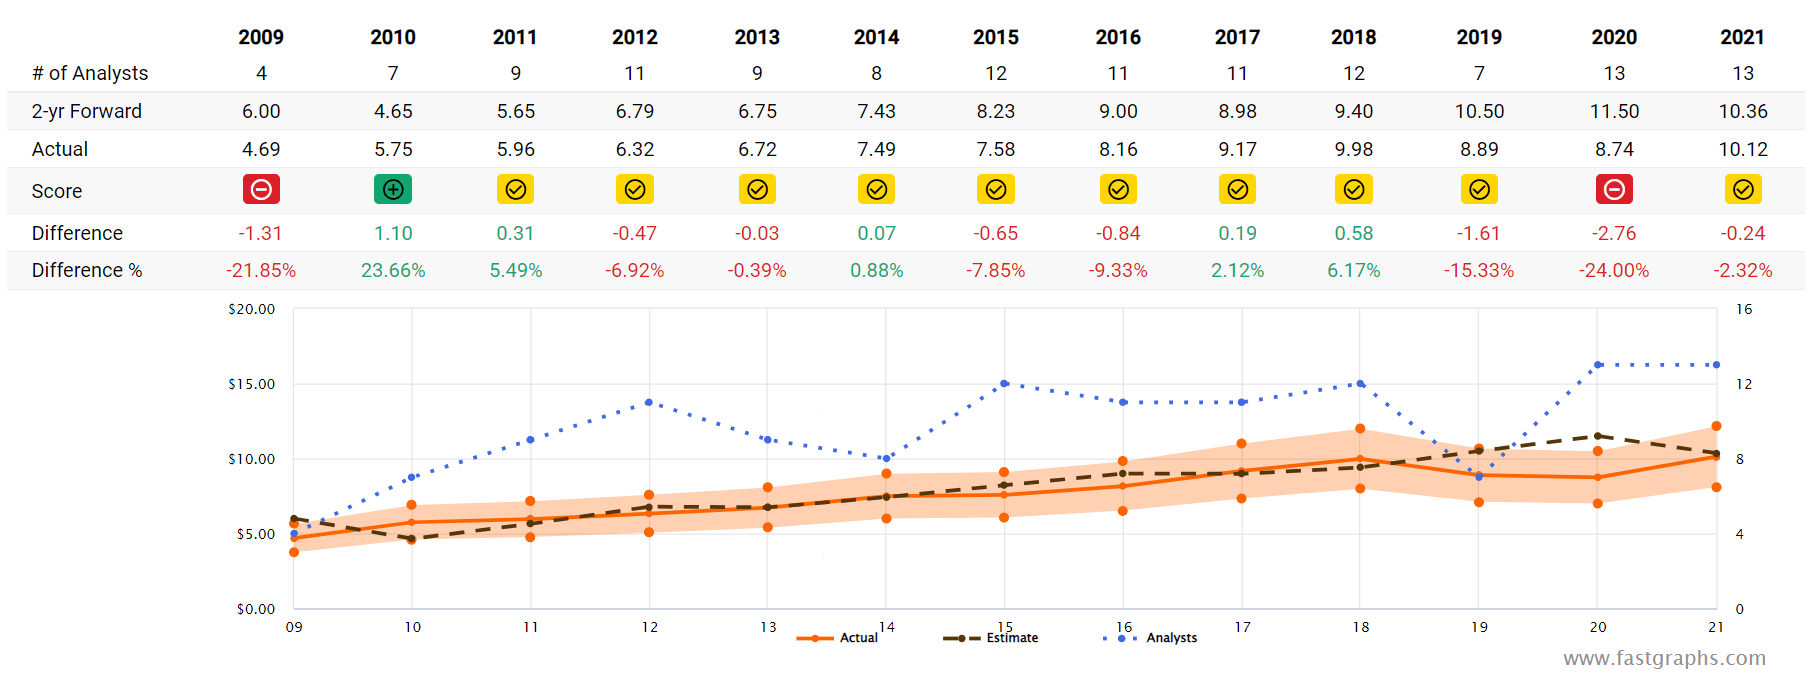
- Smoothing for outliers historical analyst margins-of-error are 15% to the downside and 5% to the upside
- margin-of-error adjusted growth guidance range: 4% to 9% CAGR
- 70% statistical probability that MMM grows 4% to 9% over time
(Source: FAST Graphs, FactSet Research) (Source: FAST Graphs, FactSet Research) (Source: FAST Graphs, FactSet Research) (Source: FAST Graphs, FactSet Research)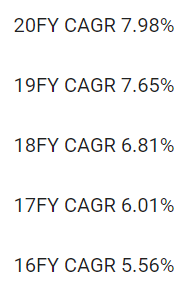
Analysts expect MMM to keep growing at its historical 8% rate while the margin-of-error adjusted growth range is consistent with its historical growth rates as well.
Reason Five: A Wonderful Company At A Wonderful Price
(Source: FAST Graphs, FactSet Research) (Source: FAST Graphs, FactSet Research) (Source: FAST Graphs, FactSet Research)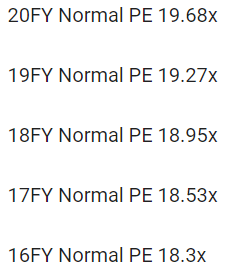
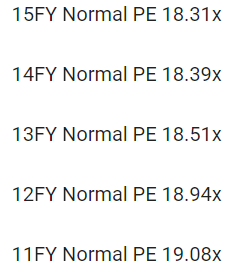
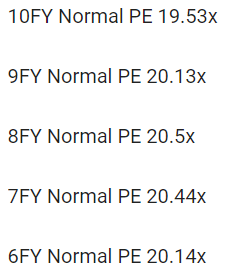
For 20 years, outside of bear markets and bubbles millions of income growth investors have consistently paid between 18.5 and 20.5X earnings for MMM.
- 91% statistical probability that this approximates intrinsic value
| Metric | Historical Fair Value Multiples (all-Years) | 2021 | 2022 | 2023 | 2024 | 2025 |
12-Month Forward Fair Value |
| 5-Year Average Yield | 3.25% | $181.23 | $183.38 | $183.38 | $196.31 | NA | |
| 13-Year Median Yield | 2.53% | $232.81 | NA | NA | $252.17 | NA | |
| 25- Year Average Yield | 2.57% | $229.18 | $231.91 | $231.91 | $248.25 | NA | |
| Earnings | 19.68 | $199.18 | $209.40 | $221.01 | $227.98 | $241.08 | |
| Average | $208.36 | $206.32 | $209.94 | $228.91 | $241.08 | $208.13 | |
| Current Price | $129.77 | ||||||
|
Discount To Fair Value |
37.72% | 37.10% | 38.19% | 43.31% | 46.17% | 37.65% | |
|
Upside To Fair Value (NOT Including Dividends) |
60.56% | 58.99% | 61.78% | 76.40% | 85.77% | 60.38%n (65% including dividend) | |
| 2022 EPS | 2023 EPS | 2021 Weighted EPS | 2022 Weighted EPS | 12-Month Forward EPS | 12-Month Average Fair Value Forward PE |
Current Forward PE |
|
| $10.64 | $11.23 | $5.32 | $5.62 | $10.94 | 19.0 | 11.9 |
3M’s historical fair value is about 19X earnings and today it trades at 11.9X and just 9.2X cash-adjusted earnings.
- a bargain by even private equity standards
|
Analyst Median 12-Month Price Target |
Morningstar Fair Value Estimate |
| $158.57 (14.1 PE) | $186.00 (17.0 PE) |
|
Discount To Price Target (Not A Fair Value Estimate) |
Discount To Fair Value |
| 18.16% | 30.23% |
|
Upside To Price Target (Not Including Dividend) |
Upside To Fair Value (Not Including Dividend) |
| 22.19% | 43.33% |
|
12-Month Median Total Return Price (Including Dividend) |
Fair Value + 12-Month Dividend |
| $164.53 | $191.96 |
|
Discount To Total Price Target (Not A Fair Value Estimate) |
Discount To Fair Value + 12-Month Dividend |
| 21.13% | 32.40% |
|
Upside To Price Target ( Including Dividend) |
Upside To Fair Value + Dividend |
| 26.79% | 47.92% |
Morningstar’s DCF model estimates MMM is worth 17X earnings, which is 91% statistically likely to be too conservative, though even Morningstar thinks MMM is a very undervalued company.
Analysts expect a 27% total return within a year, which requires it to trade at just 14X earnings within a year.
I don’t make recommendations based on 12-month forecasts but on whether the margin of safety is sufficient to compensate for a company’s risk profile.
| Rating | Margin Of Safety For Low-Risk 13/13 Ultra SWAN quality companies | 2022 Price | 2023 Price |
12-Month Forward Fair Value |
| Potentially Reasonable Buy | 0% | $206.32 | $209.94 | $208.13 |
| Potentially Good Buy | 5% | $196.00 | $199.44 | $197.72 |
| Potentially Strong Buy | 15% | $175.37 | $178.45 | $176.91 |
| Potentially Very Strong Buy | 25% | $147.00 | $157.45 | $156.10 |
| Potentially Ultra-Value Buy | 35% | $134.11 | $136.46 | $135.28 |
| Currently | $129.77 | 37.10% | 38.19% | 37.65% |
| Upside To Fair Value (Not Including Dividends) | 58.99% | 61.78% | 60.38% |
For anyone comfortable with its risk profile MMM is a potential Ultra Value buy.
Risk Profile: Why 3M Isn’t Right For Everyone
There are no risk-free companies and no company is right for everyone. You have to be comfortable with the fundamental risk profile.
What Could Cause MMM’s Investment Thesis To Break
- safety falls to 40% or less
- balance sheet collapses (highly unlikely, 0.6% probability according to rating agencies)
- growth outlook falls to less than 5.6% for seven years
- MMM’s role in my portfolio is to deliver long-term 8+% returns with minimal fundamental risk
- 8+% total return requirement for defensive sectors
- 10+% for non-defensive (cyclical) sectors – like industrials
How long it takes for a company’s investment thesis to break depends on the quality of the company.
| Quality |
Years For The Thesis To Break Entirely |
| Below-Average | 1 |
| Average | 2 |
| Above-Average | 3 |
| Blue-Chip | 4 |
| SWAN | 5 |
| Super SWAN | 6 |
| Ultra SWAN | 7 |
| 100% Quality Companies (MSFT, LOW, and MA) | 8 |
These are my personal rule of thumb for when to sell a stock if the investment thesis has broken. MMM is highly unlikely to suffer such catastrophic declines in fundamentals.
MMM’s Risk Profile Includes
- ongoing pandemic disruption risks (falling and transitory)
- economic cyclicality risk
- litigation risk (PFAS)
- regulatory risk (mostly FTC approving future acquisitions)
- M&A execution risk
- market share risk (almost 2,700 major industrial competitors)
- supply chain disruption risk
- talent retention risk (an industry leader in labor relations)
- currency risk (over 50% of sales international)
How do we quantify, monitor, and track such a complex risk profile? By doing what big institutions do.
Long-Term Risk Analysis: How Large Institutions Measure Total Risk
- see the risk section of this video to get an in-depth view (and link to two reports) of how DK and big institutions measure long-term risk management by companies
MMM Long-Term Risk-Management Consensus
| Rating Agency | Industry Percentile |
Rating Agency Classification |
| MSCI 37 Metric Model | 100.0% |
AAA Industry Leader, Stable Trend |
| Morningstar/Sustainalytics 20 Metric Model | 85.7% |
33.6/100 High-Risk |
| Reuters’/Refinitiv 500+ Metric Model | 96.7% | Excellent |
| S&P 1,000+ Metric Model | 66.0% |
Above-Average, Stable Trend |
| Just Capital 19 Metric Model | 85.4% | Very Good |
| FactSet | 30.0% |
Below-Average, Positive Trend |
| Morningstar Global Percentile (All 15,000 Rated Companies) | 26.0% | Poor |
| Just Capital Global Percentile (All 954 Rated US Companies) | 78.7% | Good |
| Consensus | 71% |
Low-Risk, Good Risk-Management, Stable Trend |
(Sources: MSCI, Morningstar, FactSet, S&P, Just Capital, Reuters)
MMM’s Long-Term Risk Management Is The 168th Best In The Master List (66th Percentile)
| Classification | Average Consensus LT Risk-Management Industry Percentile |
Risk-Management Rating |
| S&P Global (SPGI) #1 Risk Management In The Master List | 94 | Exceptional |
| Strong ESG Stocks | 78 |
Good – Bordering On Very Good |
| Foreign Dividend Stocks | 75 | Good |
| 3M | 71 | Good |
| Ultra SWANs | 71 | Good |
| Low Volatility Stocks | 68 | Above-Average |
| Dividend Aristocrats | 67 | Above-Average |
| Dividend Kings | 63 | Above-Average |
| Master List average | 62 | Above-Average |
| Hyper-Growth stocks | 61 | Above-Average |
| Monthly Dividend Stocks | 60 | Above-Average |
| Dividend Champions | 57 | Average |
(Source: DK Research Terminal)
3M’s risk-management consensus is in the top 34% of the world’s highest quality companies and similar to that of such other blue-chips as
- Caterpillar (CAT) – dividend aristocrat
- British American Tobacco (BTI) – global aristocrat
- Clorox (CLX) – dividend aristocrat
- NextEra Energy (NEE) – dividend aristocrat
- McCormick (MKC) – dividend aristocrat
- Enbridge (ENB) – global aristocrat
- Canadian National Railway (CNI) – global aristocrat
The bottom line is that all companies have risks, and MMM is good at managing theirs.
How We Monitor MMM’s Risk Profile
- 22 analysts
- 2 credit rating agencies
- 7 total risk rating agencies
- 29 experts who collectively know this business better than anyone other than management
- the bond market provides real-time fundamental risk-assessments
When the facts change, I change my mind. What do you do sir?” – John Maynard Keynes
There are no sacred cows at iREIT or Dividend Kings. Wherever the fundamentals lead we always follow. That’s the essence of disciplined financial science, the math behind retiring rich and staying rich in retirement.
Bottom Line: It’s The Best Time In 11 Years To Buy 3M
I can’t tell you when MMM will bottom, that’s likely to depend on a lot of macro and company-specific factors.
Stocks don’t stop falling because bad news stops coming but when the bad news is fully priced in.
Here’s what I can tell you with high confidence about 3M right now.
- MMM is one of the world’s safest, most dependable, and highest quality companies on earth
- top 9% of the world’s best companies
- 4.6% very safe yield
- 14.6% CAGR long-term total return potential
- 38% discount to fair value = potential Ultra Value strong buy
- 11.9X earnings
- 9.2X cash-adjusted earnings
- about 150% consensus return potential over the next five years, 18% CAGR, 2.5X more than the S&P 500
- about 2X better risk-adjusted expected returns of the S&P 500 over the next five years
Be greedy when others are fearful.” – Warren Buffett
If you’re tired of worrying about the market’s volatile swings, then 3M is one of the reasonable and prudent choices among world-class dividend aristocrats.
If you’re tired of fretting about inflation, then why not entrust some of your savings to a company that has successfully dealt with 22% inflation in the past?
If you’re looking for generous, safe, and steadily growing income in all economic and market conditions, well 3M has a 64-year dividend growth streak proving it’s a potentially excellent choice today.
And with the company now trading at the lowest P/E in 11 years, the reward/risk ratio is the best it’s been since the Great Recession.
In other words, if you’re looking to make your own luck on Wall Street, 3M is one of the best Buffett-like “fat pitch” blue-chips you can buy today.
Be the first to comment