

Thanks to floating rates, dividend yields on these preferred shares are set to climb. RichVintage/E+ via Getty Images
Get ready for charts, images, and tables because they are better than words. The ratings and outlooks we highlight here come after Scott Kennedy’s weekly updates in the REIT Forum. Your continued feedback is greatly appreciated, so please leave a comment with suggestions.
So far in 2022 we’ve seen abnormally high volatility in the mortgage REIT preferred shares. That has been a blessing to finding opportunities to open new positions.
There are quite a few options in the sector today, but I want to highlight a few in particular. The one that stands out the most to me right now is NLY-F (NLY.PF). The shares with a risk rating of 1 have smaller target ranges, so they can move into the strong-buy category on a smaller movement. That makes sense if you agree that these shares should be less volatile.
NLY-F
Shares of NLY-F are down $.18 on the day, which is about .76%. It’s not a massive movement, but it is material for shares that usually trade in such a tight range. This brings them much closer to the levels they saw in early March:
StreetSmart Edge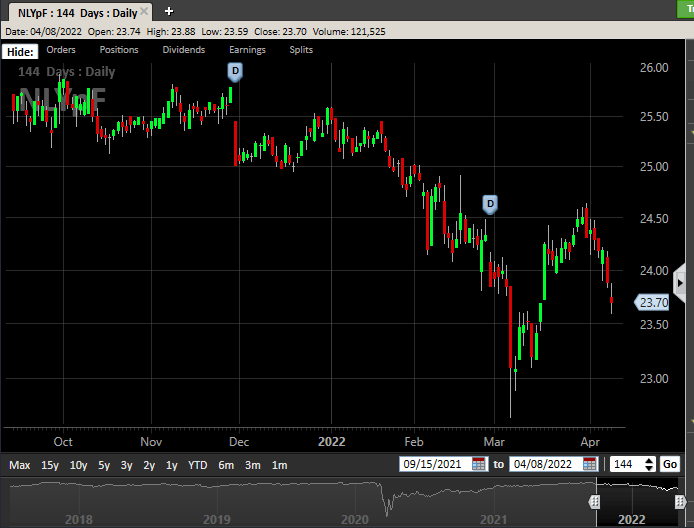
For a little over a week in March, shares were averaging a little under $23.50. At $23.70, they aren’t much higher. They also have $.19 in dividend accrual now, as compared to only a few cents back then. That’s a pretty nice deal.
Short-Term Rates
NLY-F is the first share to switch over to floating rates and will carry a spread of 4.993%. If shares were floating today, we would expect the stripped yield to be about 6.36% (compared to 7.39% with the fixed-rate). However, if short-term rates increase by another 100 basis points, the stripped yield would be higher than 7.39%. Remember that you would be buying the shares for less than $25.00. Counting dividend accrual, the $23.71 comes out to a stripped price of about $23.52.
If short-term rates go up 100 basis points, the annualized dividend rate would increase by $.25. On a stripped price of $23.52, the $.25 would add 106 basis points to the yield. That would bring 6.36% up to 7.42%.
Should we really expect short-term rates to increase by 100 basis points or more that quickly? I’m going to call it a “maybe”. I’d rank it as a medium probability, around 50-50. However, if we look another 3 to 6 months into the future, the odds of short-term rates being up 100 basis points becomes better than 50%. Therefore, there’s a pretty good shot that the Q1 2023 dividend for NLY-F would be bigger than the current dividend.
Call Risk
Annaly Capital Management (NLY) could simply call the preferred shares when call protection ends. That’s the same day they switch over to a floating rate. The call would be at $25.00 plus any dividend accrual. Current price is $23.71 with $.19 in dividend accrual (so $23.52 stripped). Does getting a few dividends and being called sound terrible? No, it doesn’t. At least not to me. On the other hand, I think there’s a pretty good chance NLY does not call the preferred share. At least given the spreads between MBS and Treasuries right now, calling wouldn’t make sense. Those spreads could tighten, remain the same, or widen during the next several months.
Unless spreads tighten significantly, I think NLY would probably just leave NLY-F outstanding. Is that a terrible deal for investors? I don’t think so, since the investor would probably be earning a yield around 7.4% on today’s stripped price.
Yield to Call Flaws
Another potential factor that can push the price of NLY-F higher is investors incorrectly evaluating the yield to call. In my experience, shares which are already callable are more likely to be overvalued during a dip. Imagine that nothing changed about NLY-F except the current call protection disappeared. What would happen to the yield to call. It would increase. Same price. Same dividend. Higher yield to call.
However, the investor would not actually have a better position. The only thing that would have changed about their cash flows is that NLY would have the right to push them out of their position. Yet investors (or early-stage computer algorithms) tend to overvalue these shares because they see the high yield to call. In that context, as NLY-F gets closer to the call date, either the price increases or the yield to call keeps getting higher and making the shares look more appealing.
Other NLY Preferred Share Opportunities
NLY-I (NLY.PI) also hit the strong-buy range, but I believe NLY-F is the better deal. Investors get a bigger discount to call value by about $.51. NLY-F has a higher stripped yield today using the fixed rate, but that doesn’t really matter since the fixed-rate ends soon anyway. The bigger issue is that NLY-F has a good shot for the floating rate dividends to quickly surpass the current fixed-rate dividend.
NLY-I gets an extra 21 months of call protection, but I don’t think that’s worth paying an extra $.51 and when NLY-F when short-term rates have risen so significantly.
NLY-G (NLY.PG) is back in the “buy under” range (by less than 1%), but I think it’s a much weaker deal than NLY-F. If they both switched to floating rates today, NLY-F would be at a 6.36% yield and NYL-G would be at 5.65% yield. The investor in NLY-G gets an extra $.71 discount to the call value, but I think the odds of NLY-G getting called are low. Not impossible, but I’d certainly consider it a surprising event.
AGNC Preferred Share Opportunities
Looking at the AGNC (AGNC) preferred shares, I give AGNCP (AGNCP) the edge by a hair at $23.18. With AGNCN (AGNCN) and AGNCO (AGNCO) both at $24.10, this is a very close race.
The worst deal among the risk-rating 1 preferred shares is AGNCM (AGNCM) at $24.65. This is another big call for investors in AGNCM to swap to any of the following:
- AGNCN
- AGNCO
- AGNCP
- NLY-F
- NLY-I
Any of those 5 is a dramatically better deal. The gap is absurd. There is no viable way to justify the difference in risk/reward.
I would encourage anyone to look at the spreadsheet and try to come up with a scenario where AGNCM is a better investment:
The REIT Forum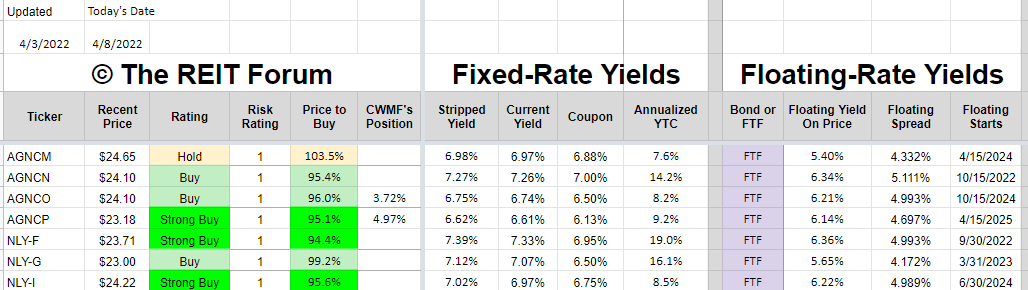
Yield to call? AGNCM is the worst. Floating yield on price? AGNCM is the worst. Call protection? AGNCM is about middle of the pack on the calendar, but has the smallest discount to call value. AGNCM can beat AGNCO and AGNCP on stripped yield, but that ends when the floating rates kick in. AGNCM’s initial fixed-rate dividend is just a bit higher than it should be. Investors who think they can get 6.98% from AGNCM but would only get 6.75% from AGNCO need to revise the math. The difference in the dividend rate is $.09375 per year.
What could an investor do? Dump AGNCM and buy AGNCO for a savings of about $.55 (prices may move after the alert), and pay yourself $.09375 from the $.55 savings each year until call protection ends. When it ends for AGNCM (2 years), you would still have $.36 of savings left. Meanwhile, AGNCO’s call protection ends in 2.5 years. From that point on, AGNCO pays out an extra $.16525 in dividends annually (compared to AGNCM).
What if the investor gets called? Well, they bought shares with a nice discount to call value so they just have to live with a capital gain.
Investors absolutely should be dumping AGNCM for any of those 5. What if the investor has to eat a capital gains tax? Not tax advice, but I’d say it would still be worth the trade unless the investor would face the tax now but has a plan to avoid the capital gains tax later (donating to charity or dying abruptly). That’s right, the scenario where holding AGNCM is better than swapping using current prices from publication relies on death.
Note: Sometimes investors assume they would be paying 23% on the entire sales price. That’s not how anything works. We avoid giving tax advice, but no one has a cost basis of $0.00 in these shares.
Quick Update
The analysis above is part of a subscriber update posted on Friday.
Part of the price disparity corrected on Monday, as NLY-F was the only preferred share from NLY or AGNC with a gain on the day. Meanwhile, AGNCM fell by 3%.
Seeking Alpha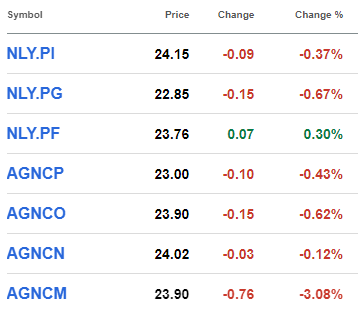
Compared to the other preferred shares, AGNCM is still less attractive on a fundamental basis even after falling by 3% in one day. I didn’t expect to see prices adjust so much in one day, but the fundamentals absolutely did not support AGNCM’s price compared to peers. I strive to provide analysis before prices move and succeeded with the subscriber post. There is naturally a delay on the public release and prices will often move at least slightly during that period.
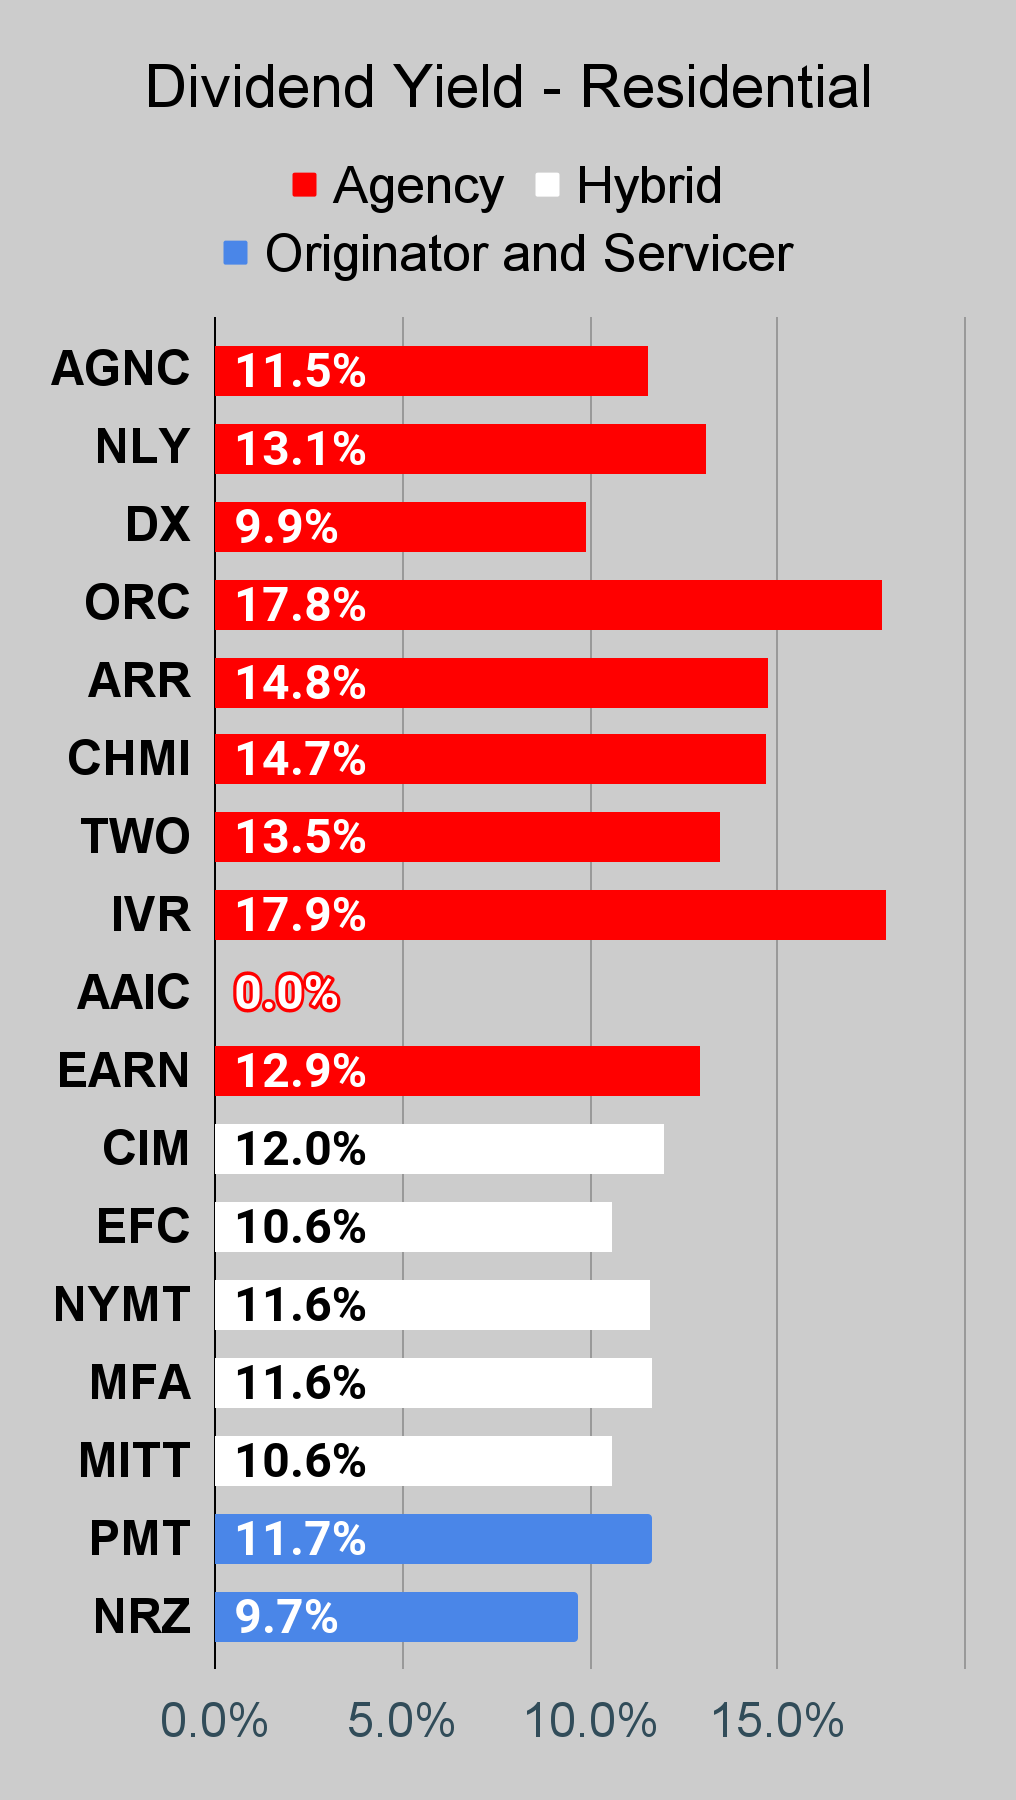
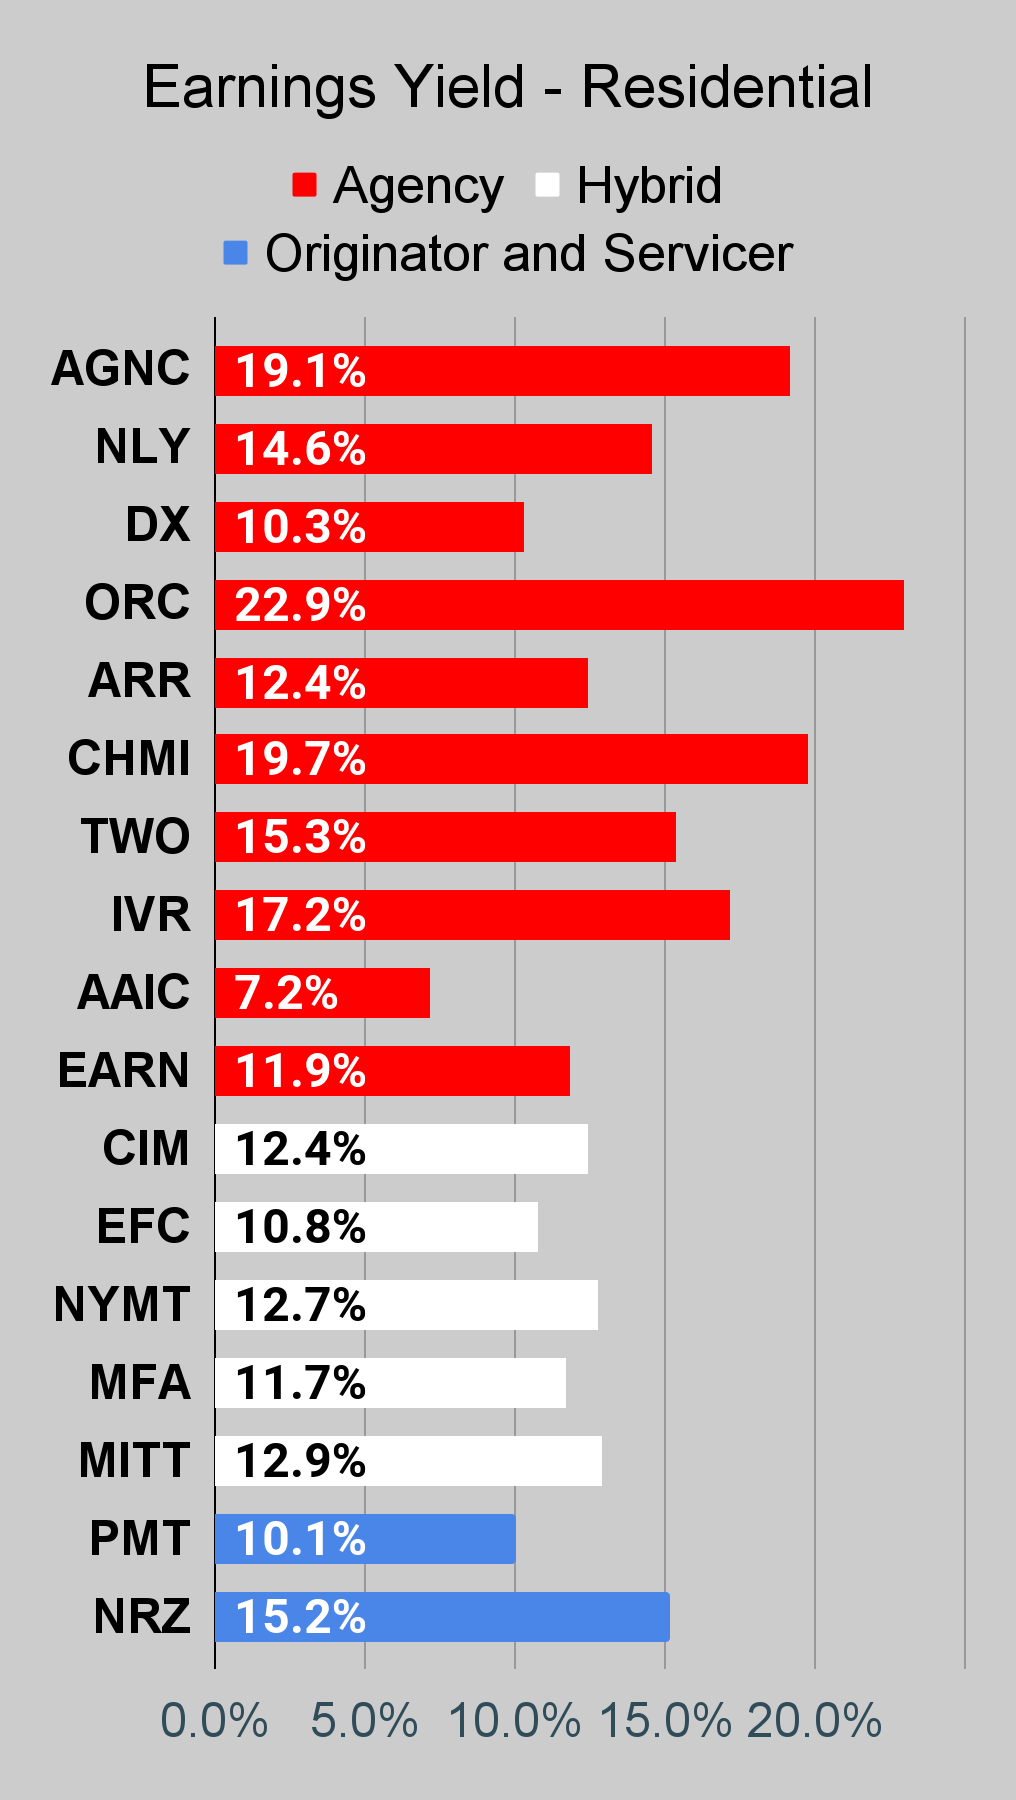
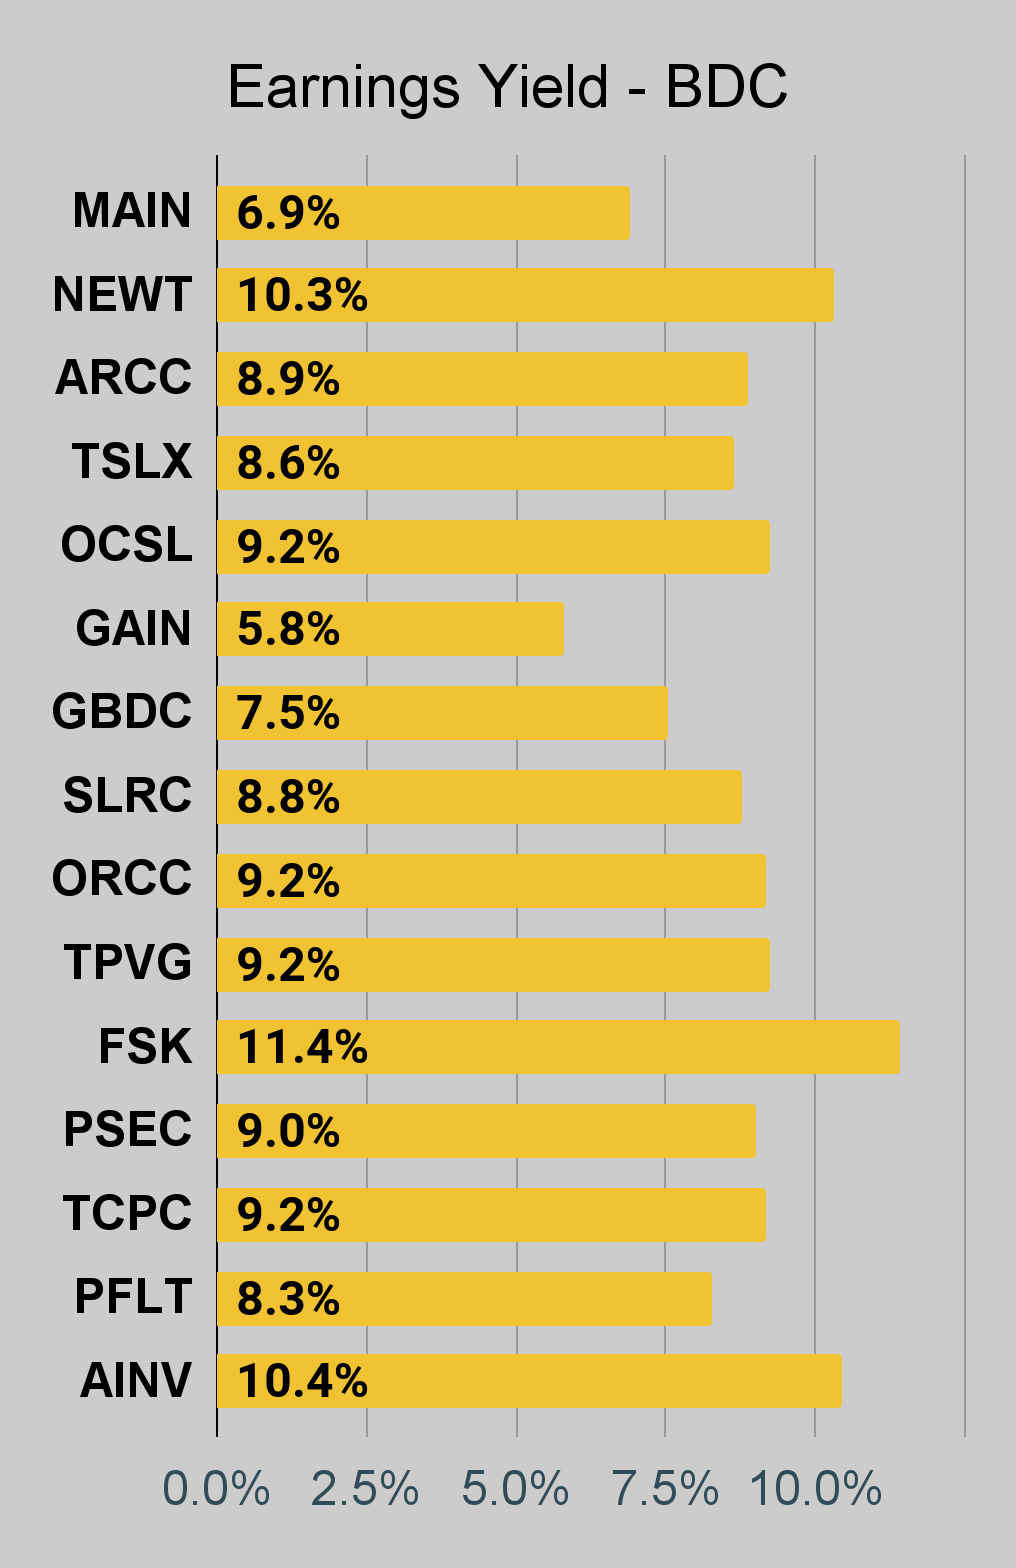
The other point I’d like to mention is that the earning yields data (in the tables below) uses consensus analyst estimates. In some cases, the “earnings yield” is absurdly high and I would caution investors not to treat it as a great indicator of long-term earnings power. I present it because investors want to see it, but it isn’t one of the metrics I use when deciding which shares to buy or sell.
The rest of the charts in this article may be self-explanatory to some investors. However, if you’d like to know more about them, you’re encouraged to see our notes for the series.
Stock Table
We will close out the rest of the article with the tables and charts we provide for readers to help them track the sector for both common shares and preferred shares.
We’re including a quick table for the common shares that will be shown in our tables:
Let the images begin!
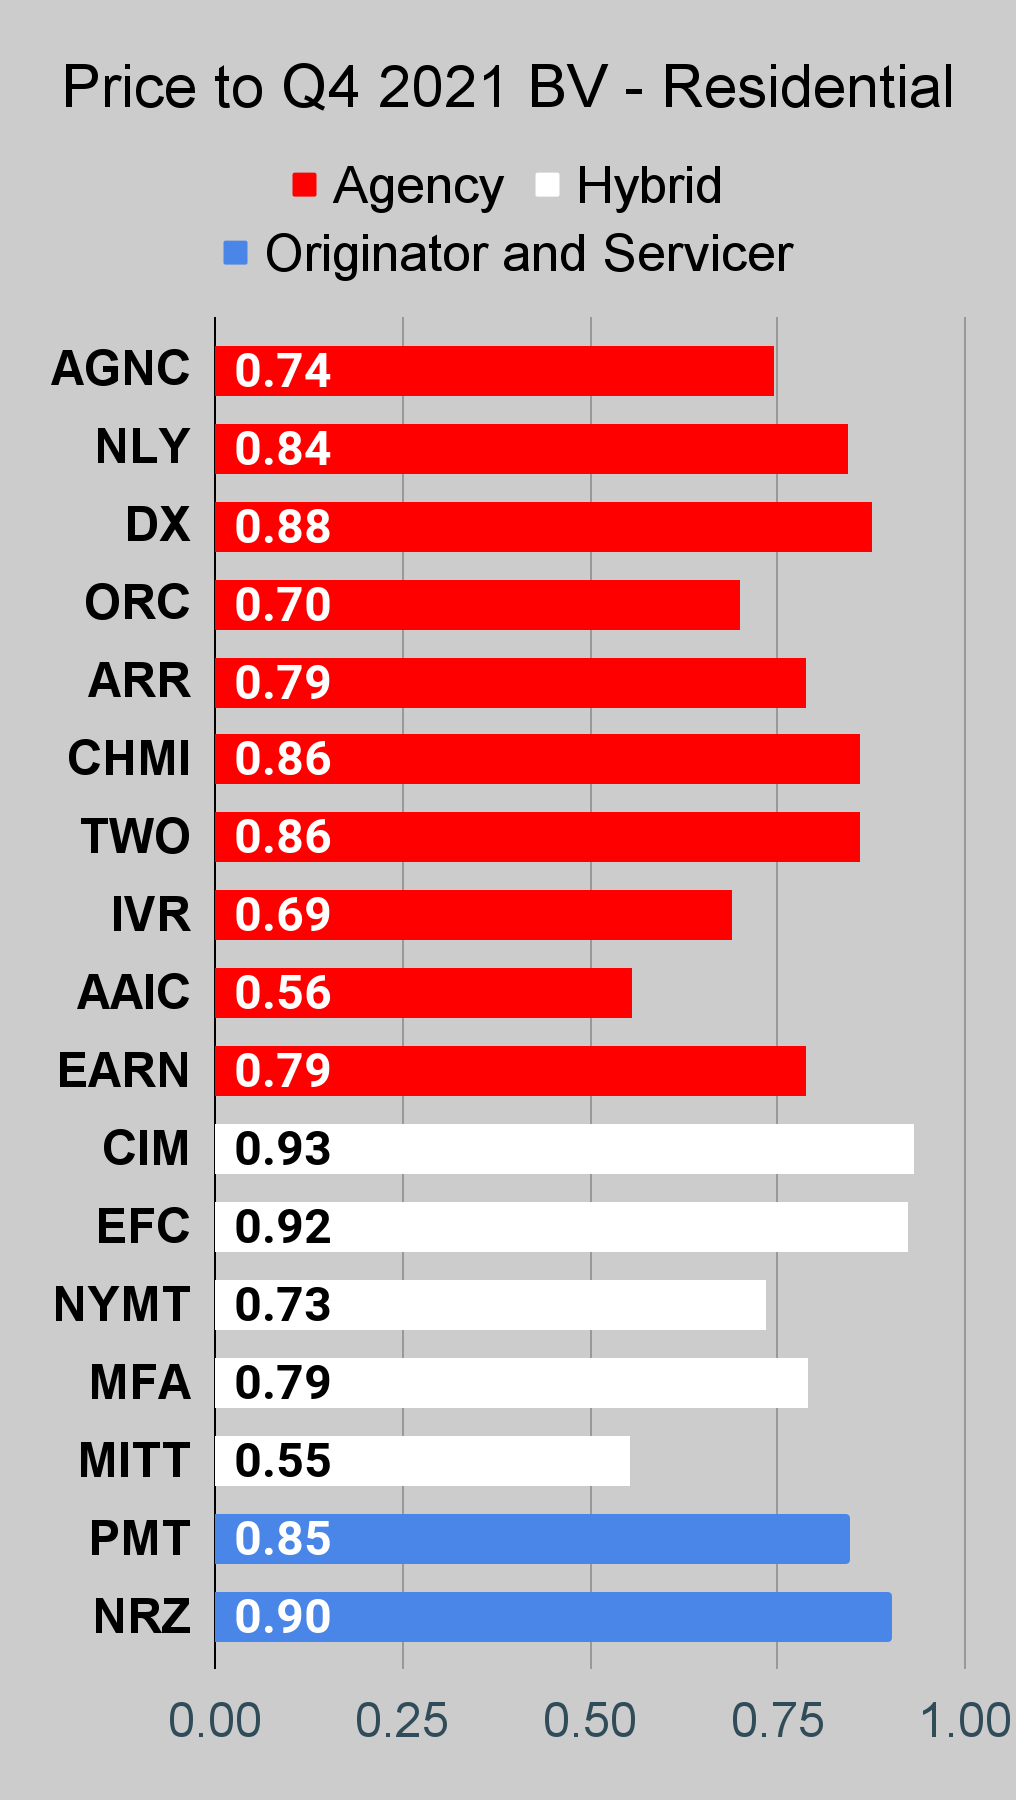
Residential Mortgage REIT Charts
Note: We are modeling some significant changes to BV since 12/31/2021 and some management teams have already publicly indicated a material change in BV per share. The chart for our public articles uses the book value per share from the latest earnings release. Current estimated book value per share is used in reaching our targets and trading decisions. It is available in our service, but those estimates are not included in the charts below.
 The REIT Forum |
 The REIT Forum |
 The REIT Forum |
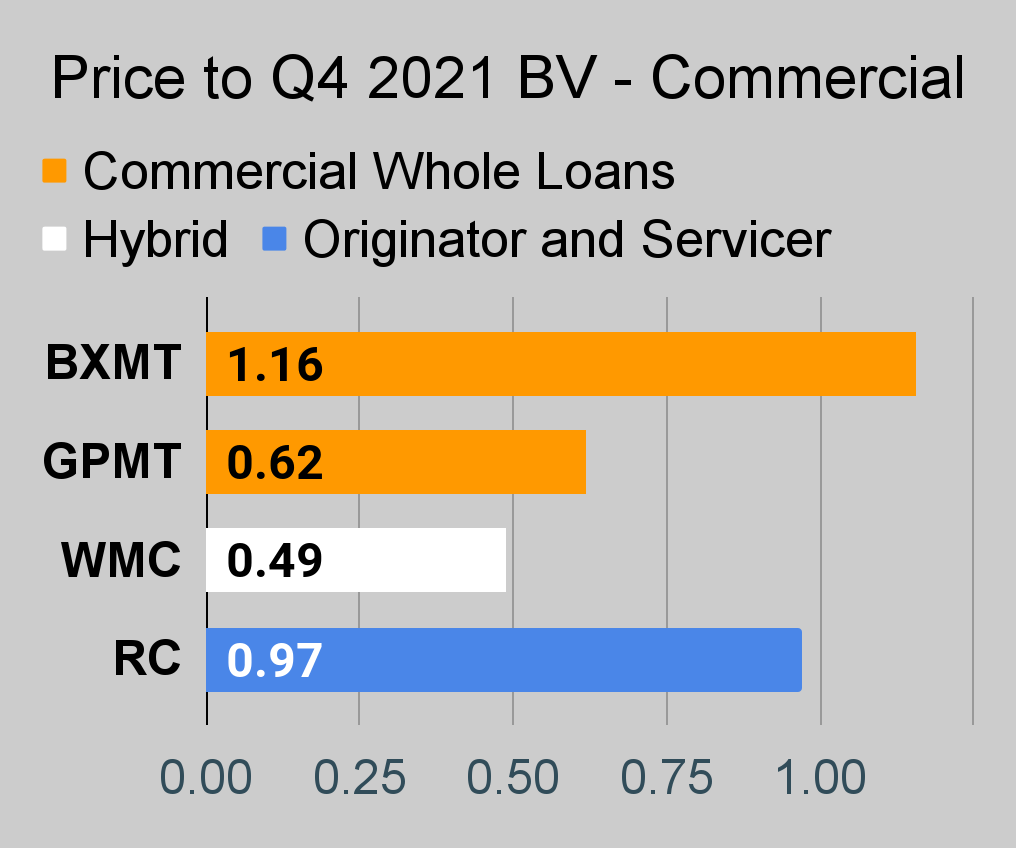
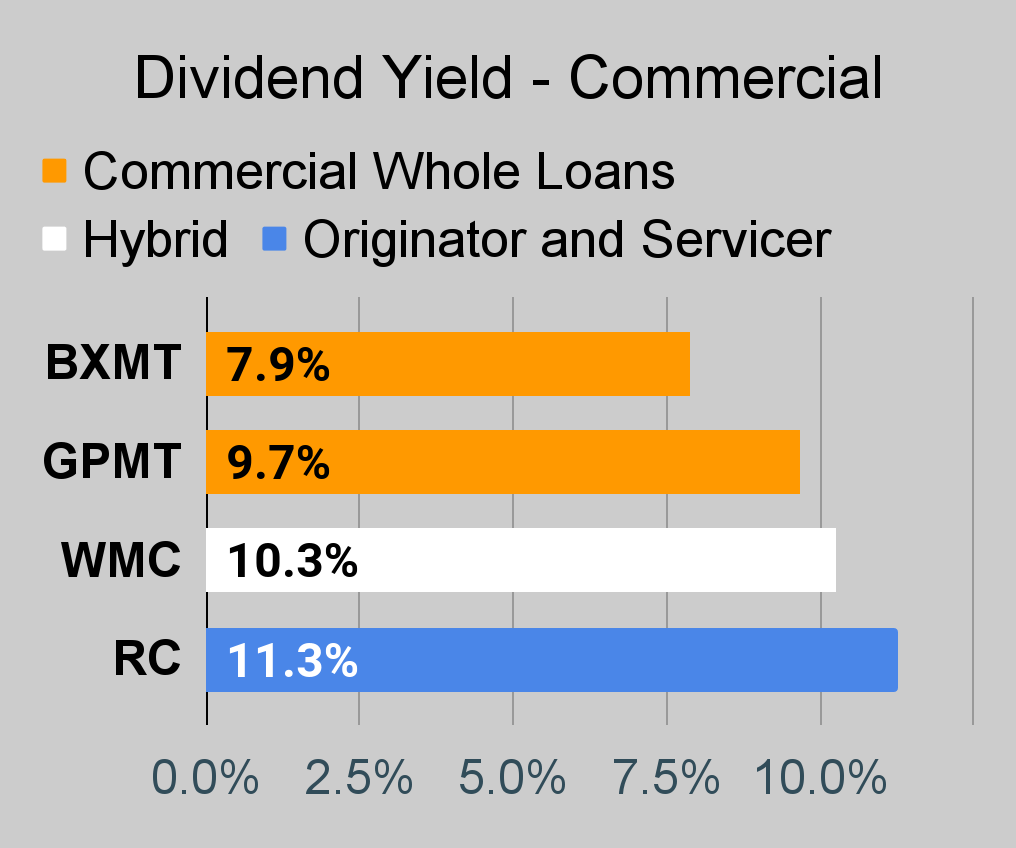
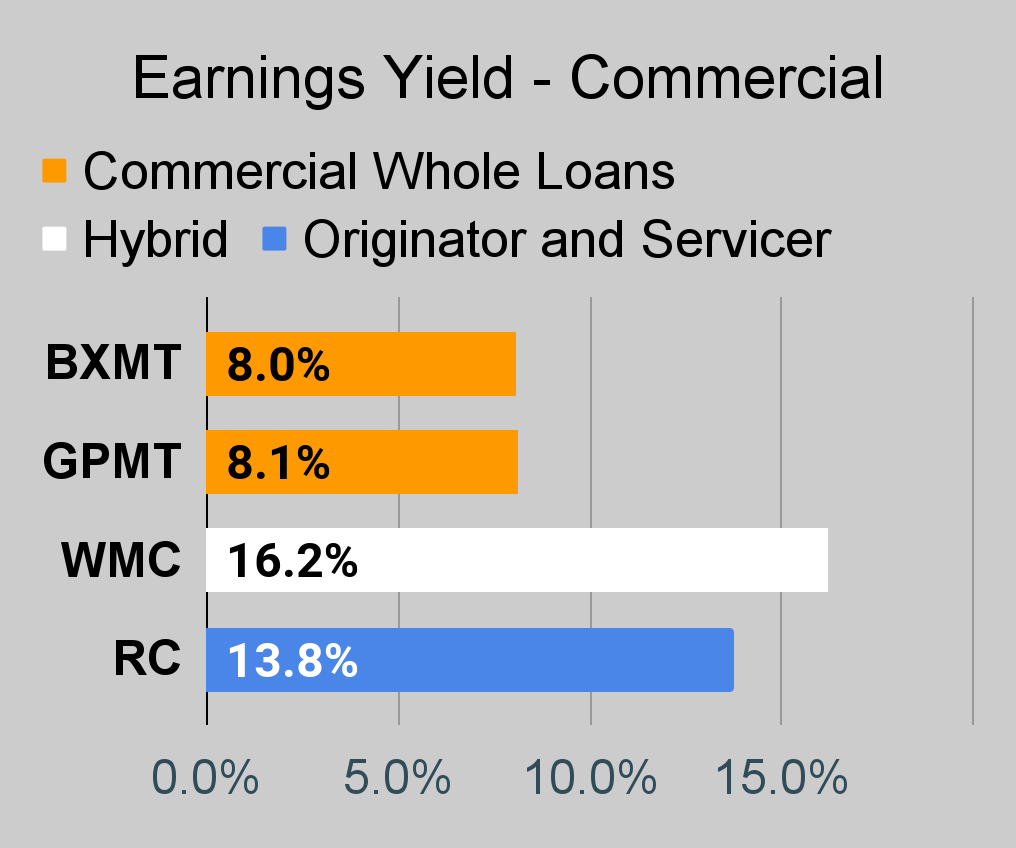
Commercial Mortgage REIT Charts
 The REIT Forum |
 The REIT Forum |
 The REIT Forum |
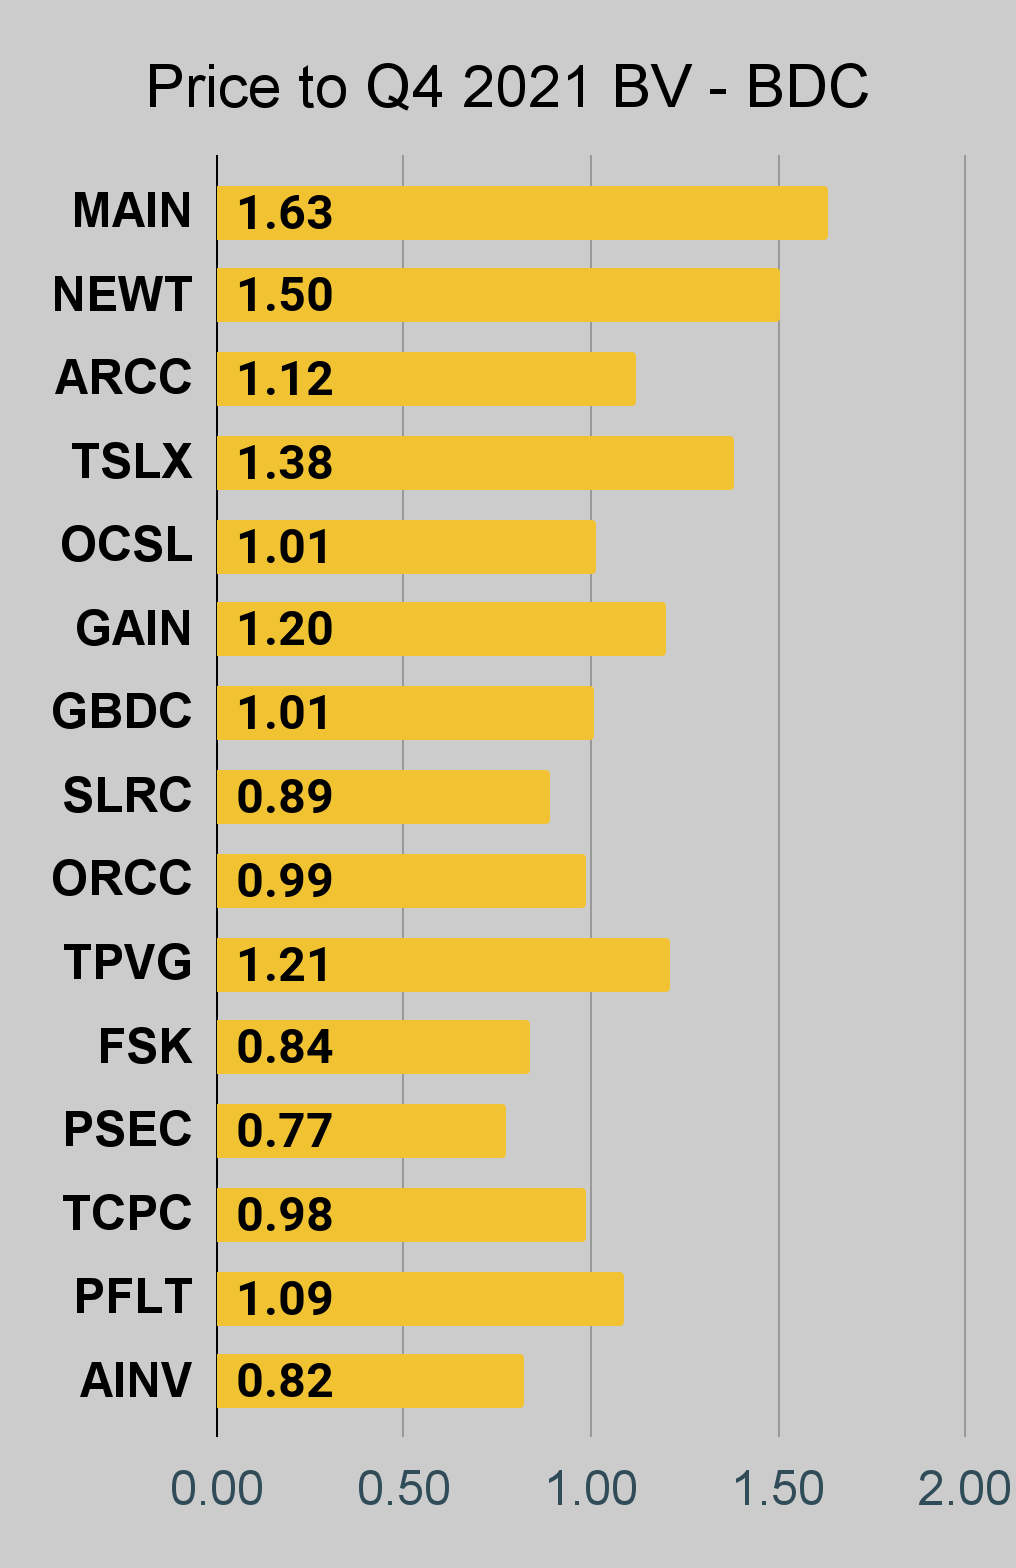
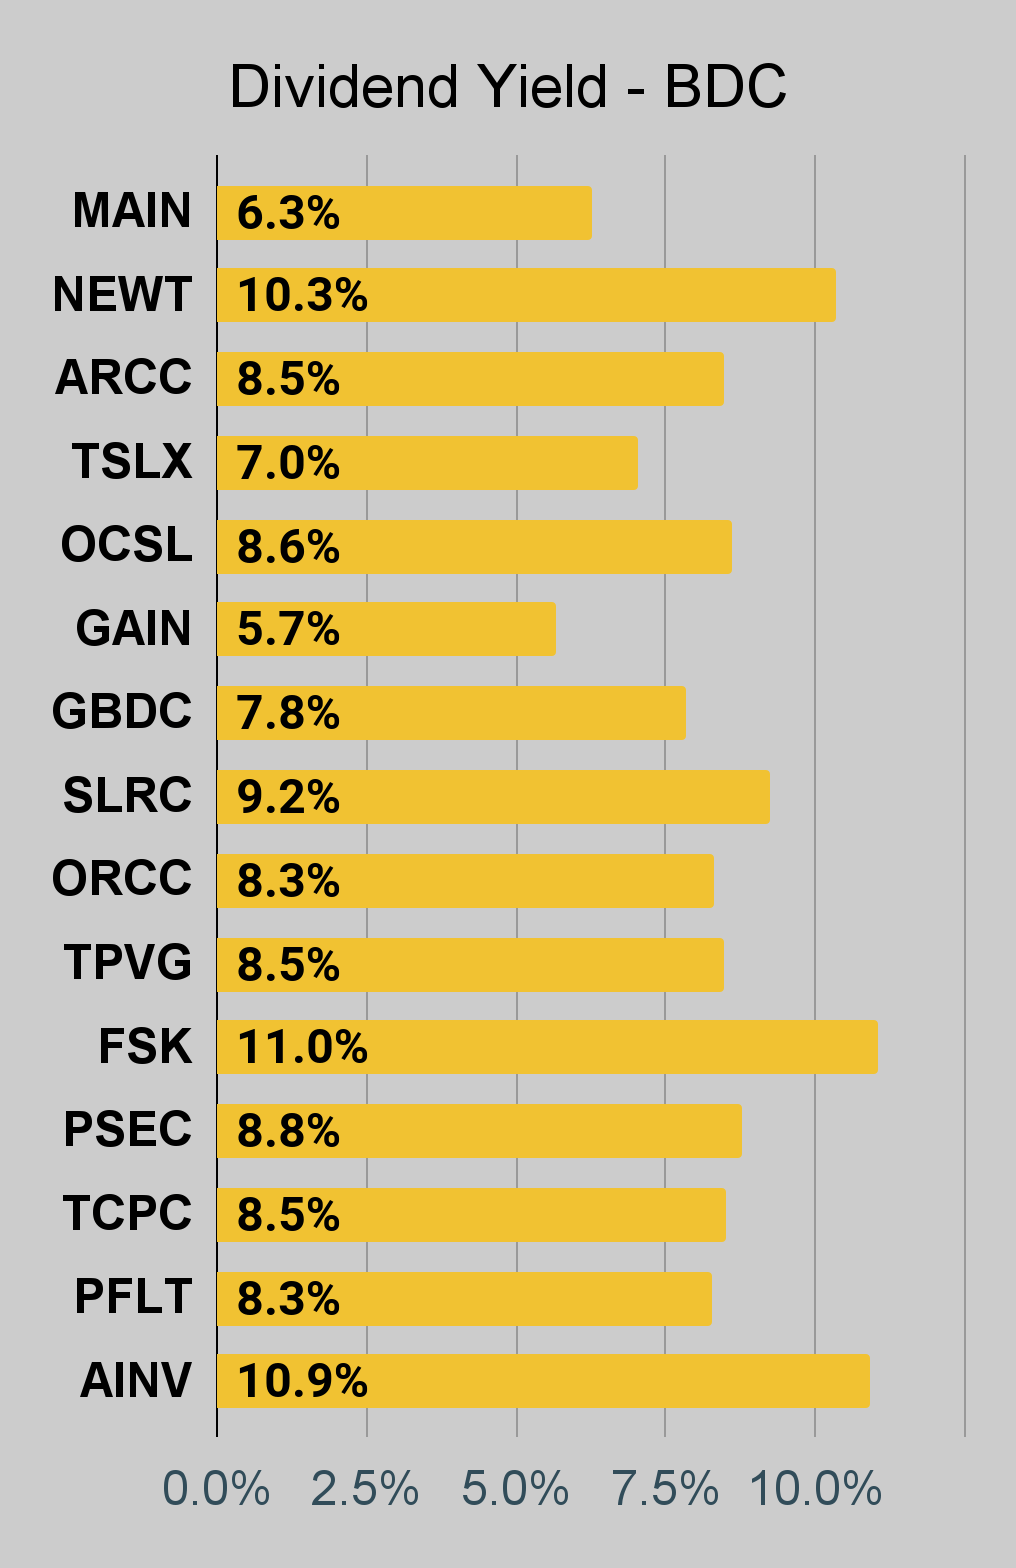
BDC Charts
 The REIT Forum |
 The REIT Forum |
 The REIT Forum |
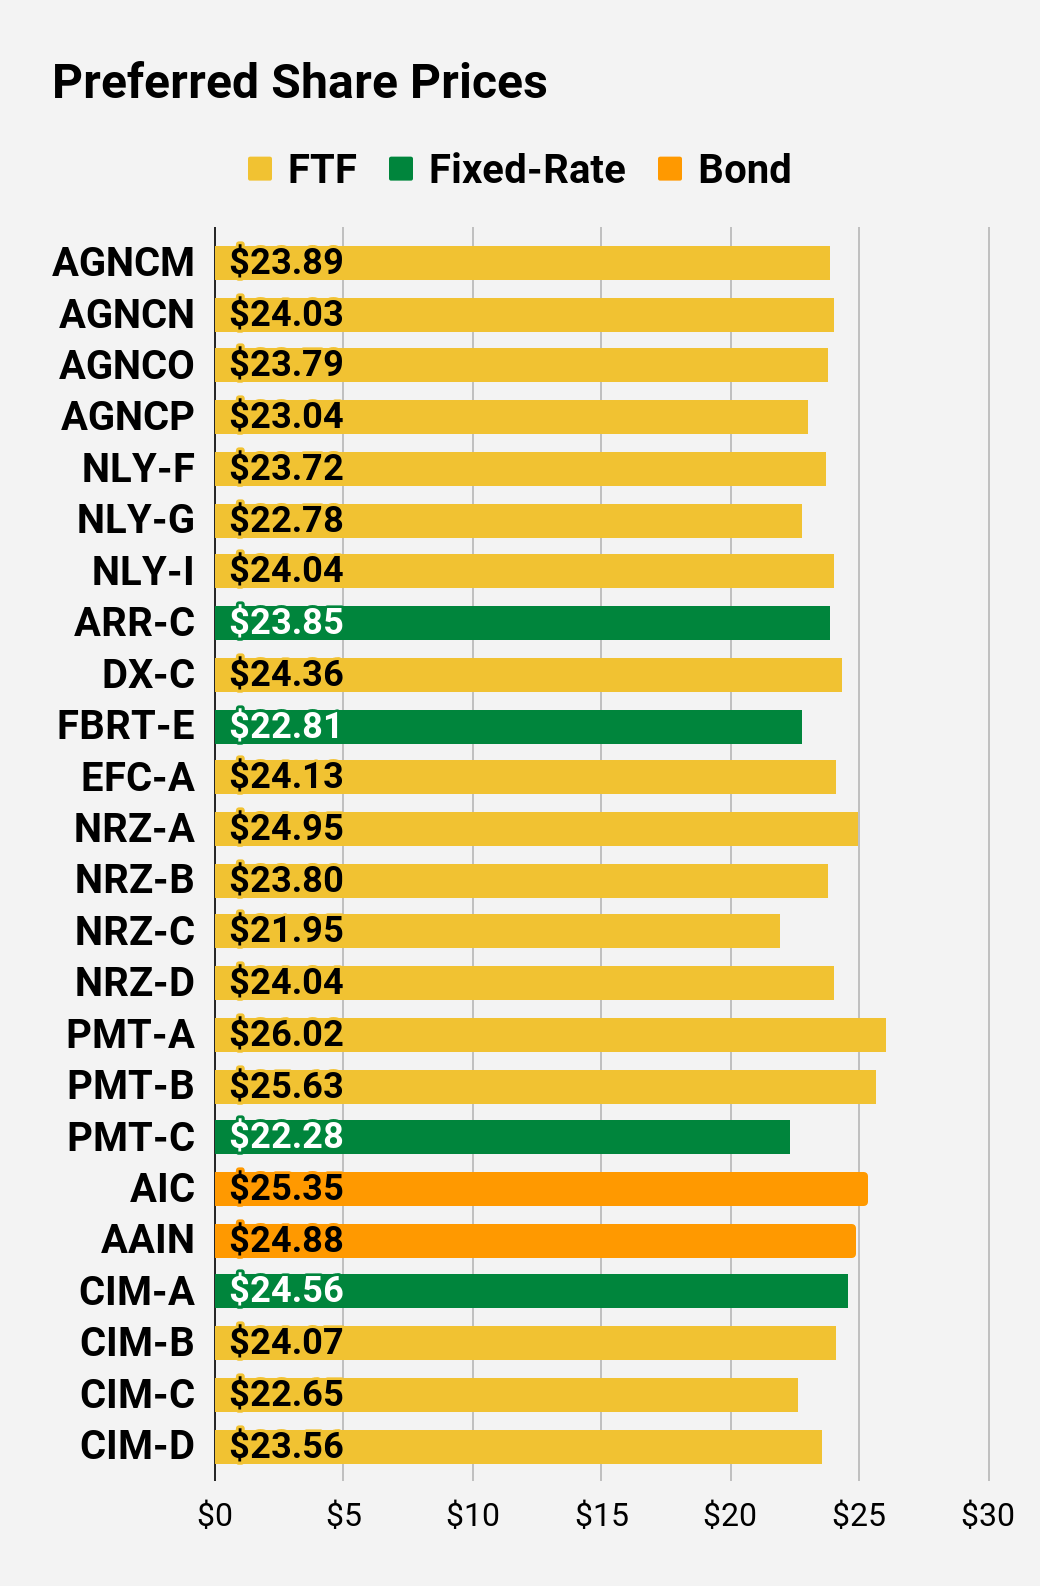
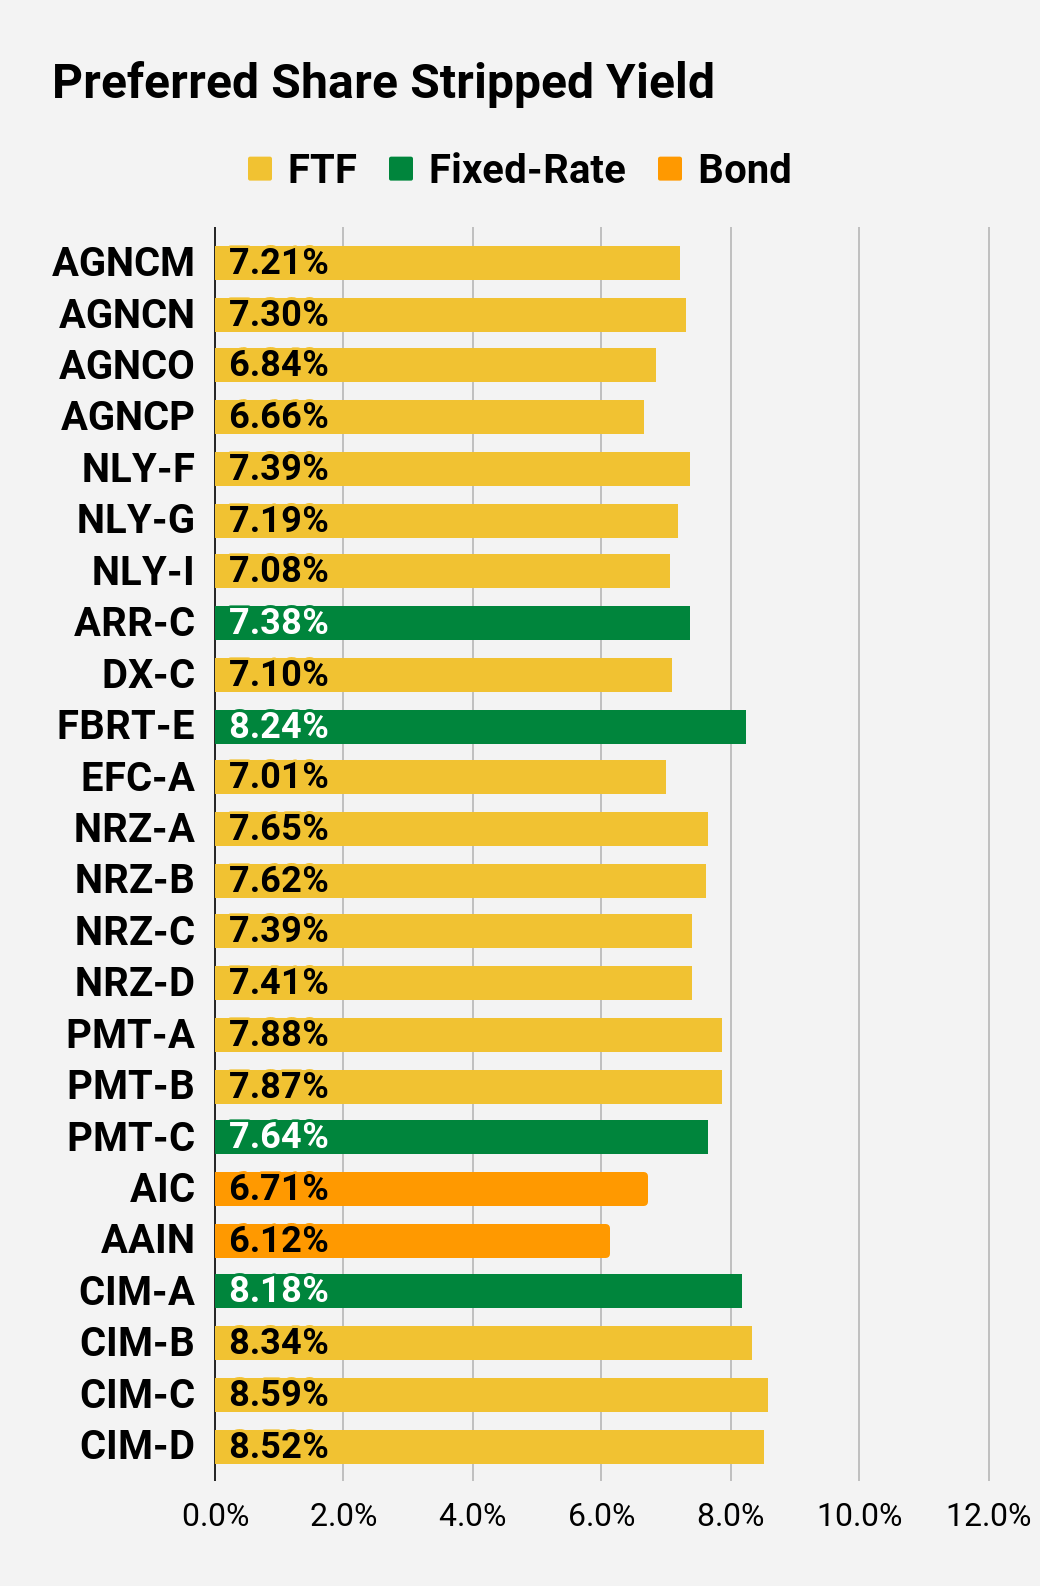
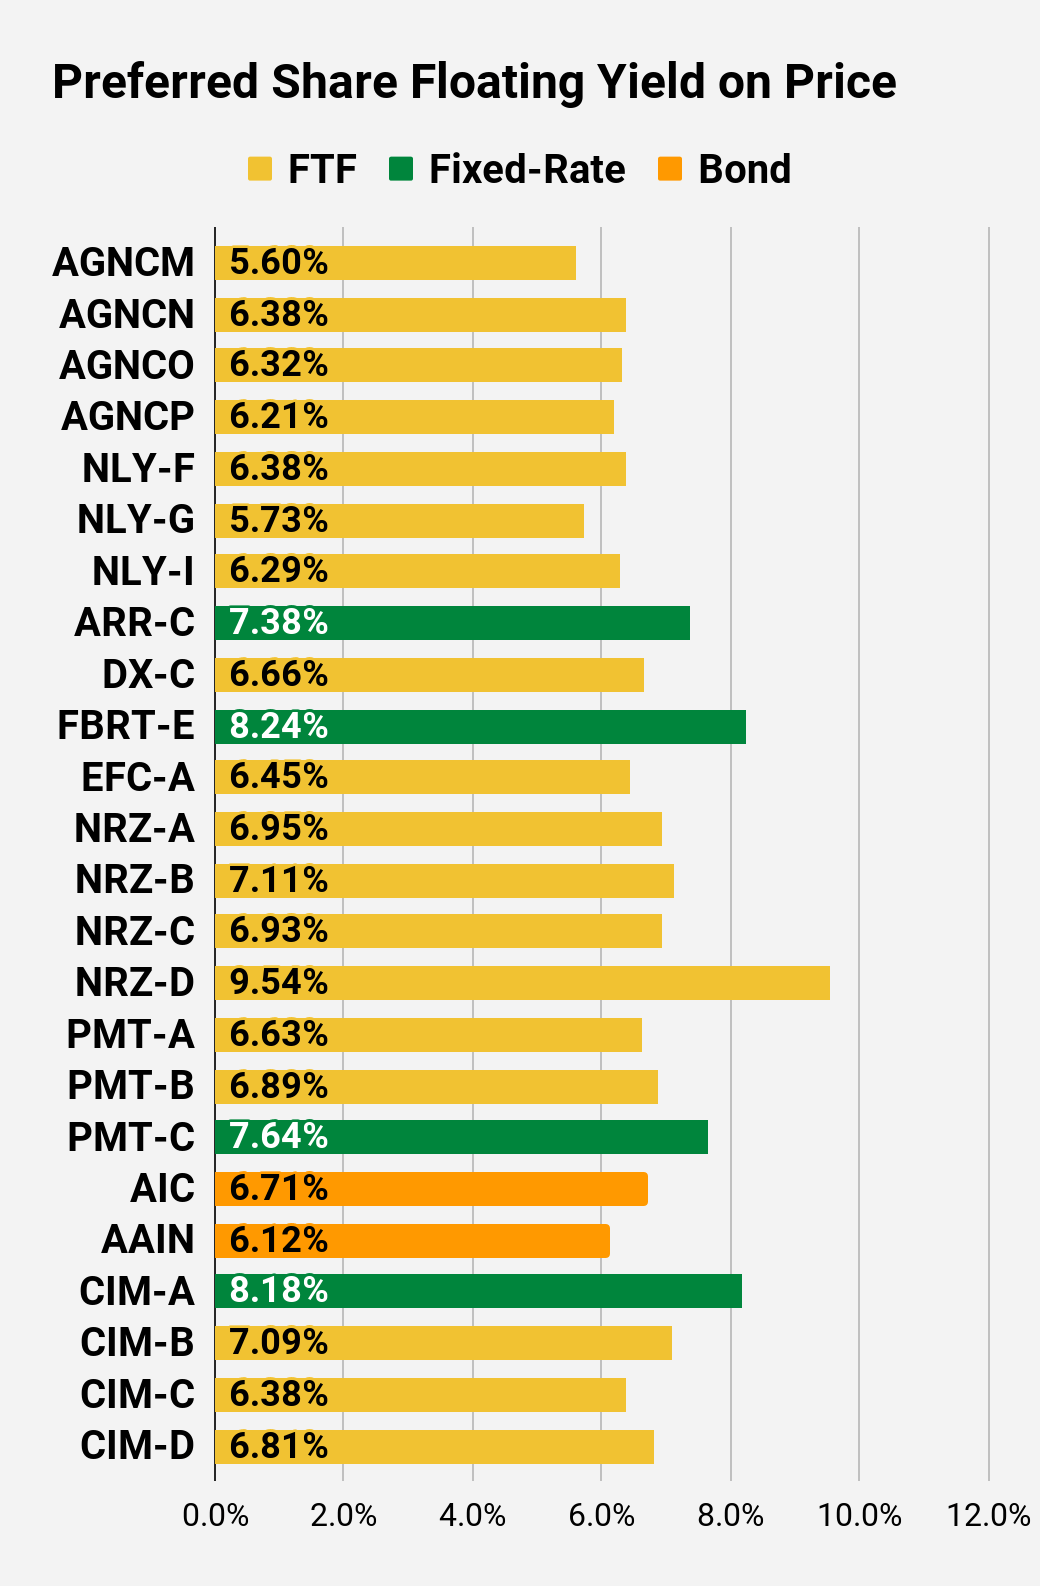
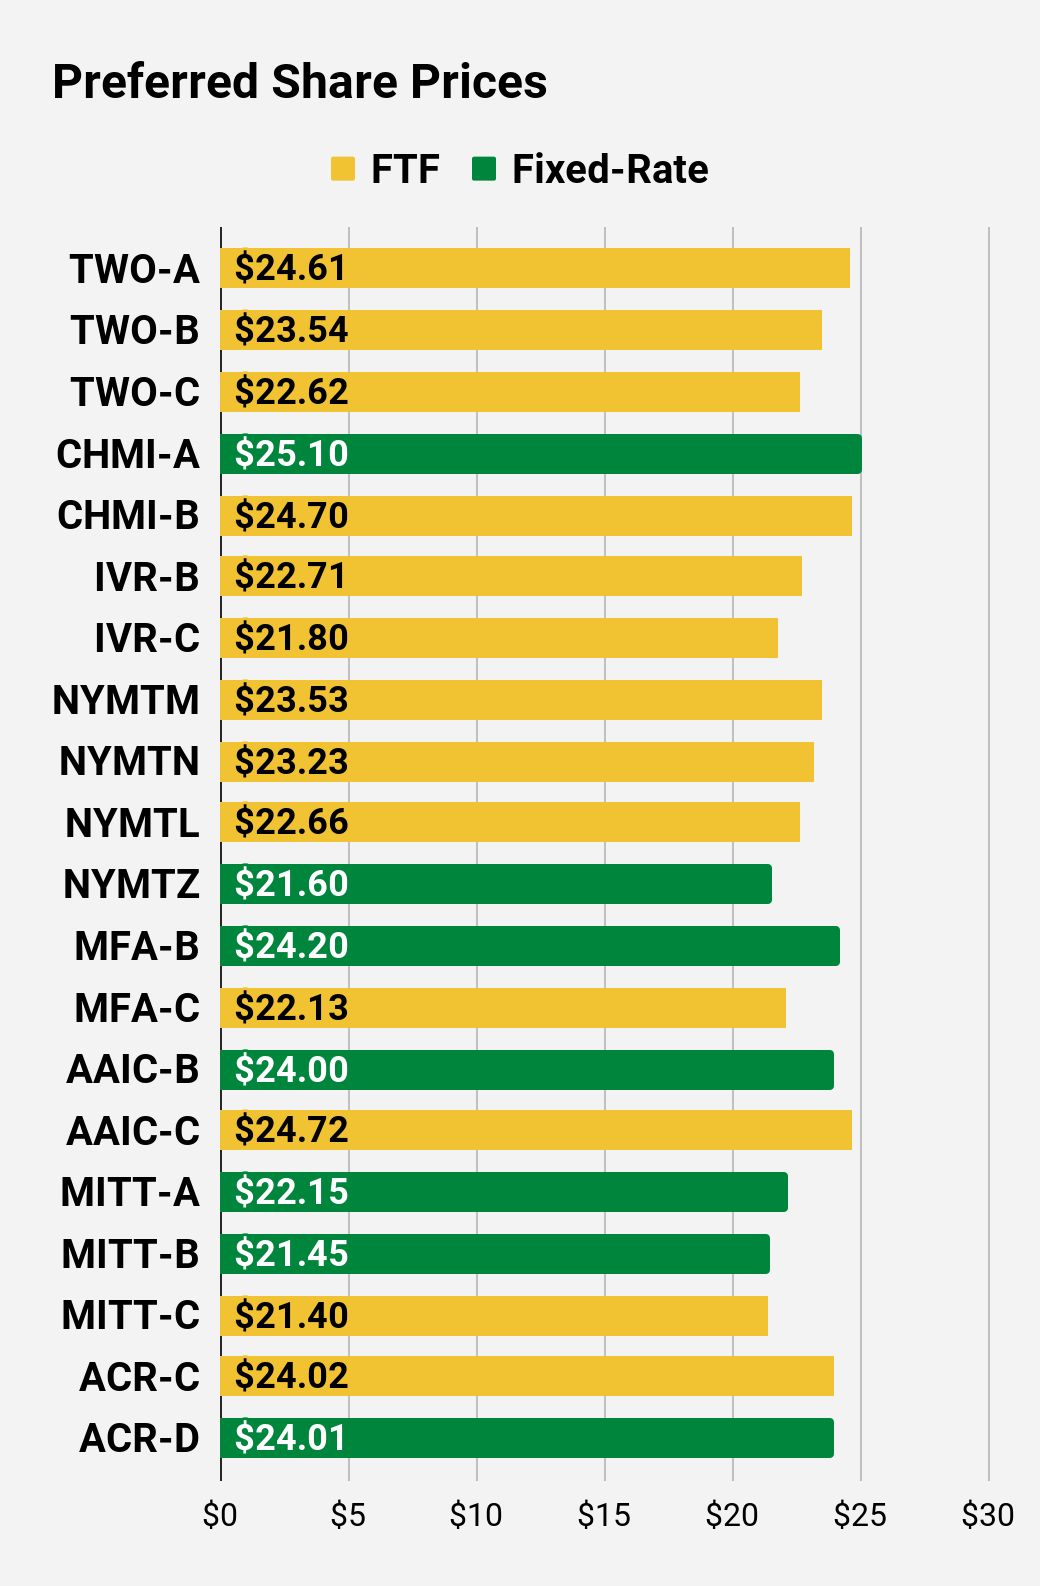
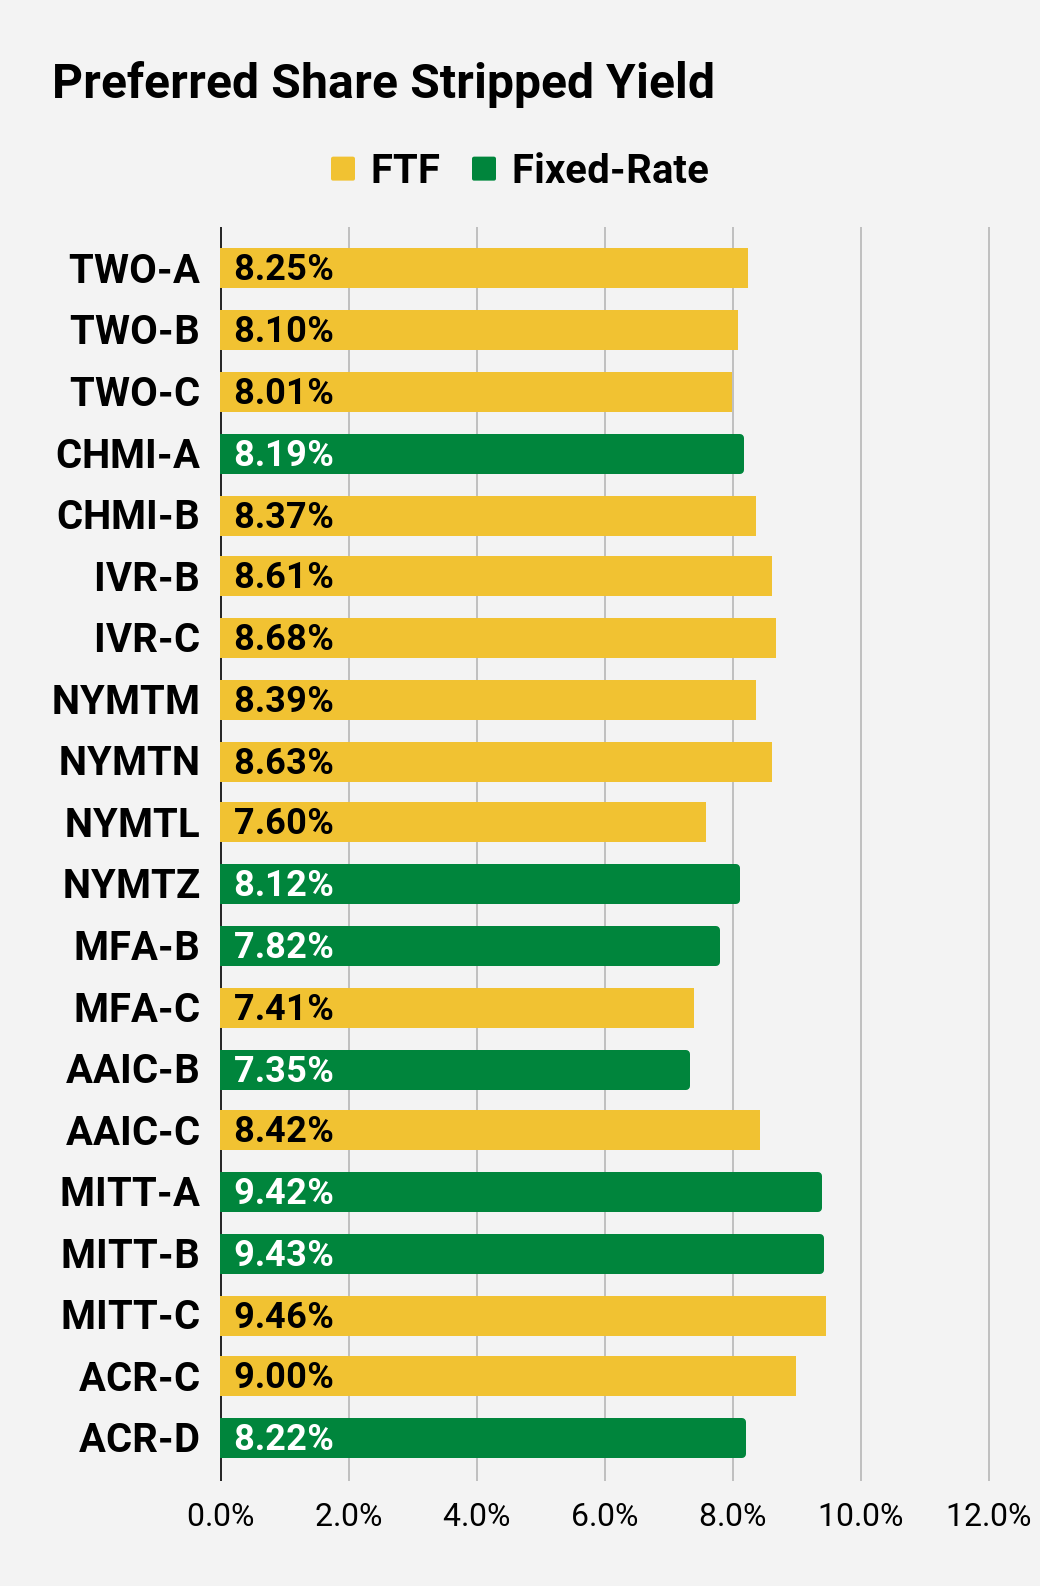
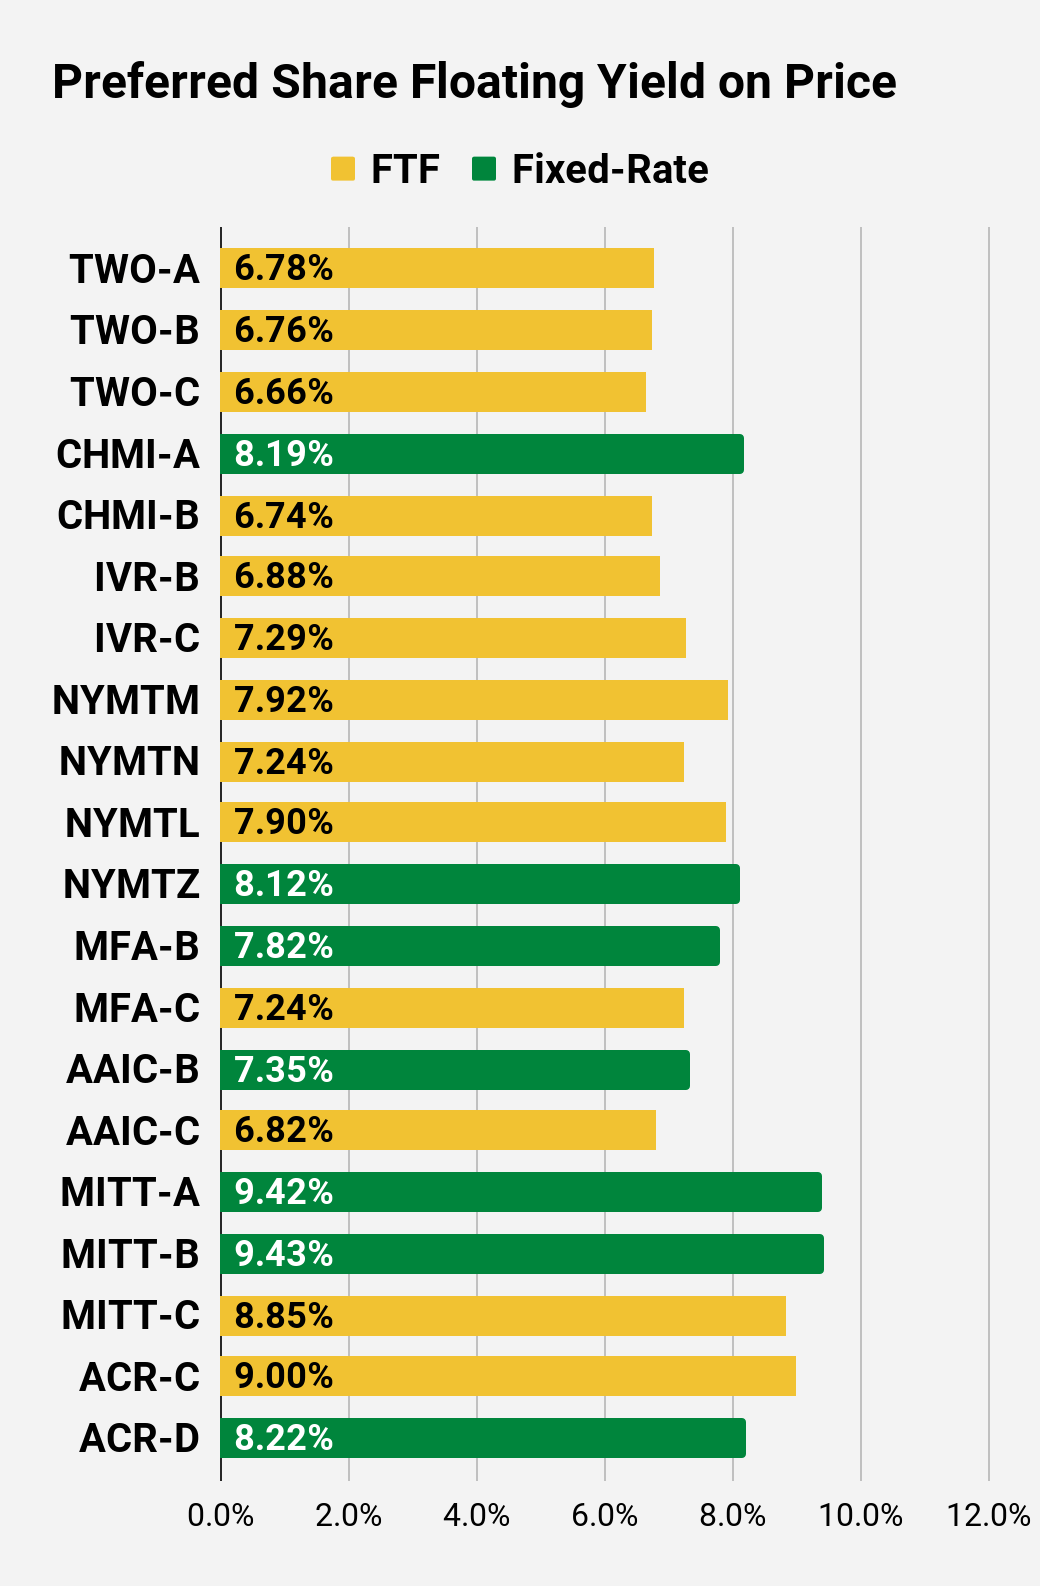
Preferred Share Charts
 The REIT Forum |
 The REIT Forum |
 The REIT Forum |
 The REIT Forum |
 The REIT Forum |
 The REIT Forum |
Preferred Share Data
Beyond the charts, we’re also providing our readers with access to several other metrics for the preferred shares.
After testing out a series on preferred shares, we decided to try merging it into the series on common shares. After all, we are still talking about positions in mortgage REITs. We don’t have any desire to cover preferred shares without cumulative dividends, so any preferred shares you see in our column will have cumulative dividends. You can verify that by using Quantum Online. We’ve included the links in the table below.
To better organize the table, we needed to abbreviate column names as follows:
- Price = Recent Share Price – Shown in Charts
- BoF = Bond or FTF (Fixed-to-Floating)
- S-Yield = Stripped Yield – Shown in Charts
- Coupon = Initial Fixed-Rate Coupon
- FYoP = Floating Yield on Price – Shown in Charts
- NCD = Next Call Date (the soonest shares could be called)
- Note: For all FTF issues, the floating rate would start on NCD.
- WCC = Worst Cash to Call (lowest net cash return possible from a call)
- QO Link = Link to Quantum Online Page
Second Batch:
Strategy
Our goal is to maximize total returns. We achieve those most effectively by including “trading” strategies. We regularly trade positions in the mortgage REIT common shares and BDCs because:
- Prices are inefficient.
- Long-term, share prices generally revolve around book value.
- Short-term, price-to-book ratios can deviate materially.
- Book value isn’t the only step in analysis, but it is the cornerstone.
We also allocate to preferred shares and equity REITs. We encourage buy-and-hold investors to consider using more preferred shares and equity REITs.
Performance
We compare our performance against 4 ETFs that investors might use for exposure to our sectors:
The REIT Forum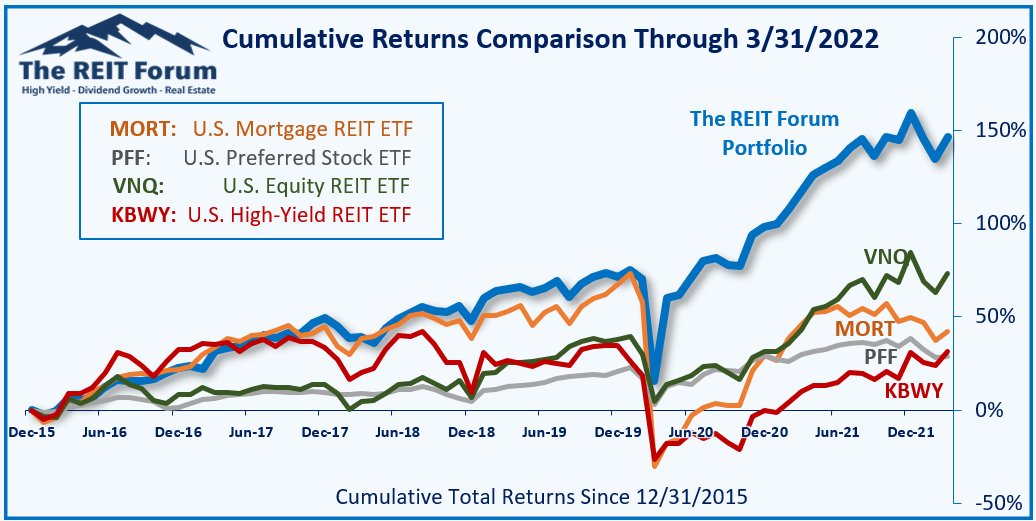
The 4 ETFs we use for comparison are:
|
Ticker |
Exposure |
|
One of the largest mortgage REIT ETFs |
|
|
One of the largest preferred share ETFs |
|
|
Largest equity REIT ETF |
|
|
The high-yield equity REIT ETF. Yes, it has been dreadful. |
When investors think it isn’t possible to earn solid returns in preferred shares or mortgage REITs, we politely disagree. The sector has plenty of opportunities, but investors still need to be wary of the risks. We can’t simply reach for yield and hope for the best. When it comes to common shares, we need to be even more vigilant to protect our principal by regularly watching prices and updating estimates for book value and price targets.
Ratings: Bullish on preferred share NLY-F / NLY.PF.
Be the first to comment