

zim286/iStock via Getty Images
As a value investor, I know the best time to buy slices of aerospace and defense contractors at reasonable prices is during peacetime when nobody is paying attention beyond the complex military-industrial relationship between the U.S. Department of Defense, Congress, and the defense industry.
Nevertheless, human nature prevails as the ludicrous Russian invasion of Ukraine compelled me to run the aerospace and defense players through my quality + value screener. As a result, four companies: General Dynamics (NYSE:GD), Huntington Ingalls Industries (NYSE:HII), Lockheed Martin (NYSE:LMT), and Northrop Grumman (NYSE:NOC), were the only contractors of 54 in the industry to survive the screening parameters that seek quality enterprises currently trading at reasonable stock prices.
In my first research report on the defense industry, I put the select companies and their common shares through my market-beating, data-driven investment research checklist of the value proposition, shareholder yields, returns on management, valuation multiples, and downside risk.
The resulting investment thesis:
In an unpredictable world, a strong defense is a necessary evil to fight evil when it arises which seems every few decades or so. GD, HII, LMT, and NOC each appear as fundamentally strong, below average risk defense contractors whose common shares are currently trading at reasonable, if not bargain prices.
Unless noted, all data presented is sourced from Seeking Alpha and YCharts as of the market close on March 23, 2022; and intended for illustration only.
A complimentary Glossary of Investing Terms is provided in a linked Google Sheet for article brevity and quick reference. The glossary is exclusive to Seeking Alpha readers. It is recommended to open the sheet in a separate window or tab. For convenience, a link back to SA is provided.
Outperforming the Broader Market
General Dynamics Corporation is a dividend-paying large capitalization stock operating worldwide through four segments: aerospace, marine systems, combat systems, and technologies. General Dynamics was founded in 1899 and headquartered in Reston, Virginia, USA.
Huntington Ingalls Industries, Inc. is a dividend-paying mid-cap stock that engages in designing, building, overhauling, and repairing military ships in the United States. It operates through three segments: Ingalls Shipbuilding, Newport News Shipbuilding, and technical solutions. Huntington Ingalls Industries was founded in 1886 and headquartered in Newport News, Virginia.
Lockheed Martin Corporation is a dividend-paying large-cap stock that engages in the research, design, development, manufacture, integration, and sustainment of technology systems, products, and services worldwide. It operates through four segments: aeronautics, missiles and fire control, rotary and mission systems, and space. Lockheed Martin was founded in 1912 and headquartered in Bethesda, Maryland, USA.
Northrop Grumman Corporation is a dividend-paying large-cap stock that operates globally through four segments: aeronautics systems, defense systems, mission systems, and space systems. The company was founded in 1939 and headquartered in Falls Church, Virginia.
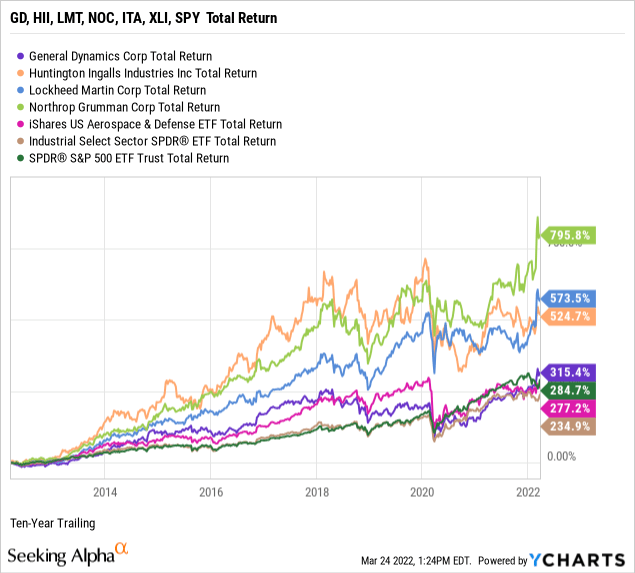
The chart below illustrates the group’s performance during the past ten years against the iShares U.S. Aerospace & Defense ETF (ITA), the Industrial Select Sector SPDR Fund ETF (NYSE:XLI), and the SPDR S&P 500 ETF Trust (NYSE:SPY). Ultimately, investing in individual common stocks should aim to beat the benchmark indices over time. For example, in this order by total return, NOC, LMT, HII, and GD have each outperformed the industry, sector, and market.
My value proposition elevator pitch for the group: Elections, periods of peacetime, and budget limitations notwithstanding, being an entrenched member of the military-industrial complex has the long-term benefits of predictable if incremental growth and steady profit margins leading to broader market outperformance.
Out Yielding the 10-Year Treasury
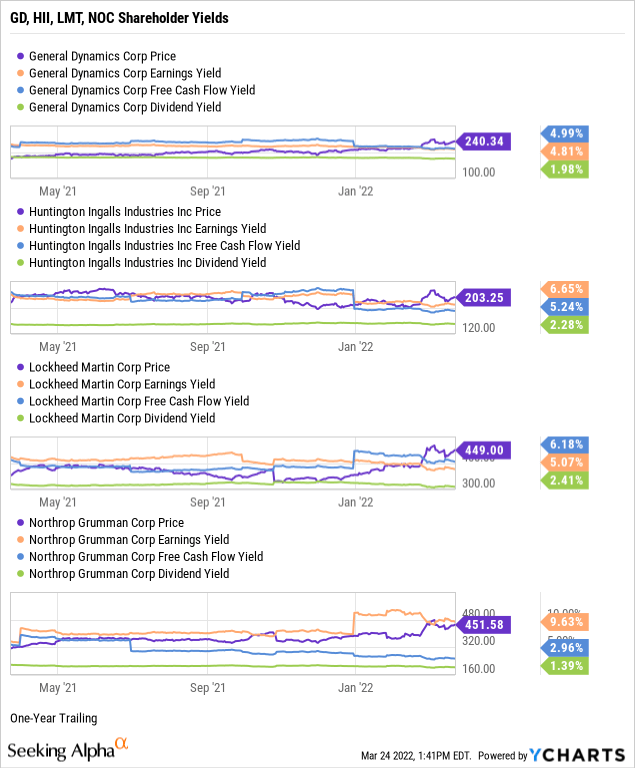
As part of my due diligence, I average the total shareholder yields on earnings, free cash flow, and dividends to measure how a targeted stock compares to the prevailing yield on the 10-year Treasury benchmark note. In other words, what is the equity bond rate of the common shares?
I target an earnings yield greater than 6 percent or the equivalent P/E multiple below 17 times, and as demonstrated in the chart below, Huntington Ingalls Industries and Northrop Grumman exceeded the floor.
I target a free cash flow yield or FCFY of 7 percent and higher or the equivalent of fewer than 15 times the inverted price-to-free cash flow multiple. None of the four select aerospace stocks exceeded the threshold.
Although not a dividend investor by definition, I prefer dividend-paying stocks for compensation in the short term while waiting for capital gains to compound over time. Each defense contractor offers a moderate yield with the following payout ratios: GD = 41.21%, HII = 34.02%, LMT = 38.90%, and NOC = 24.04%. Each stock being below my 60% payout ratio ceiling indicates safe, well-covered dividends.
Next, I take the average of the three shareholder yields to measure how each stock compares to the prevailing yield of 2.35% on the 10-year Treasury benchmark note. The average shareholder yield for GD was 3.93%, HII’s average yield was 4.72%, LMT was 4.55%, and NOC was 4.66%. Arguably, equities are deemed riskier than U.S. bonds. However, securities that reward shareholders at higher yields than the government benchmark, such as the four select defense contractors, favor owning the stocks instead of the bond.
Remember that earnings and free cash flow yields are inverses of valuation multiples and suggest the select stocks may be reasonably valued. I’ll further explore valuation later in this report.
Superior Management Performance
Let’s explore the fundamentals of the four defense contractors, uncovering the performance strength of each company’s senior management.
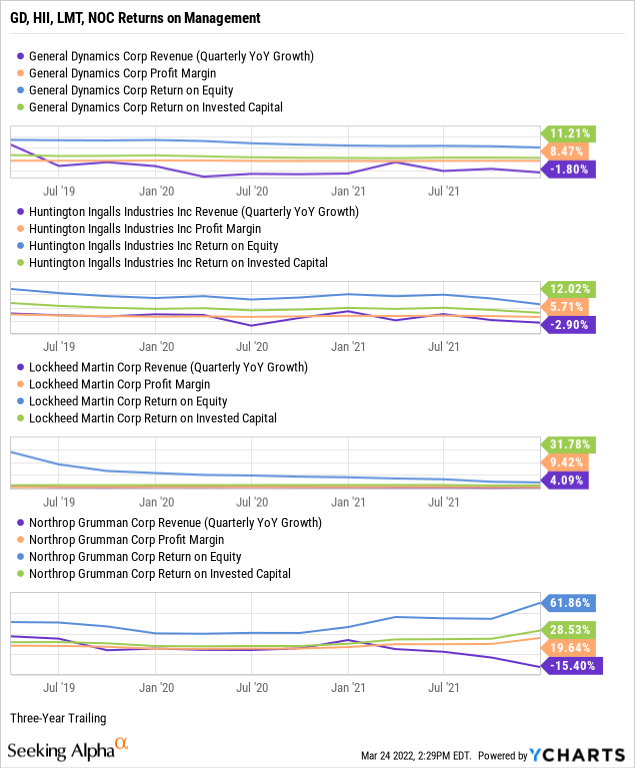
When analyzing a business, I am biased toward established growth instead of executive guidance and sell-side analyst projections. For example, per the below chart, General Dynamics had three-year revenue growth of -1.80%, Huntington Ingalls Industries was -2.90%, Lockheed Martin was 4.90%, and Northrop Grumman was -15.40%. The overall modest or negative growth was perhaps from a contraction in sales in the post-Iraq and Afghanistan era.
Northrop Grumman had a trailing three-year pre-tax net profit margin of 19.64%, more than twice its select peers. All but Huntington Ingalls Industries exceeds the aerospace and defense industry median net margin of 6.21%, but all four are margin positive enterprises. In general, I screen for profitable companies to avoid unnecessary speculation, as witnessed in the money-losing disruptive growth stocks of late.
Return on equity or ROE reveals how much profit a company generates from shareholder investment in the stock. I target an ROE of 15 percent or higher to discover shareholder-friendly management. Although buried in the chart, LMT at 74.11% and NOC’s 61.86% were producing extraordinary trailing three-year returns on equity against a median of 14.82% for the industry. GD’s ROE was 19.56%, and HII was 23.10%, exceeding the industry median.
I target a return on invested capital or ROIC above 12%. All four contractors meet or exceed the threshold indicating that senior executives at each firm are highly efficient capital allocators. Return on invested capital measures how well a company uses its working capital to generate returns on its investment. On the contrary, returns market-wide appeared challenged during the pandemic.
ROIC needs to exceed the weighted average cost of capital or WACC by a comfortable margin, giving management’s ability to outperform its capital costs. GD had a trailing WACC of 6.45%, HII was 6.17%, LMT’s was 5.58%, and NOC was 5.33% (Source: GuruFocus). Topline growth issues notwithstanding, the ample spreads between ROIC and WACC combined with positive net profit margins and compelling equity and capital returns indicate adequate management performance at the select defense contractors.
Quality Enterprises at Reasonable Stock Prices
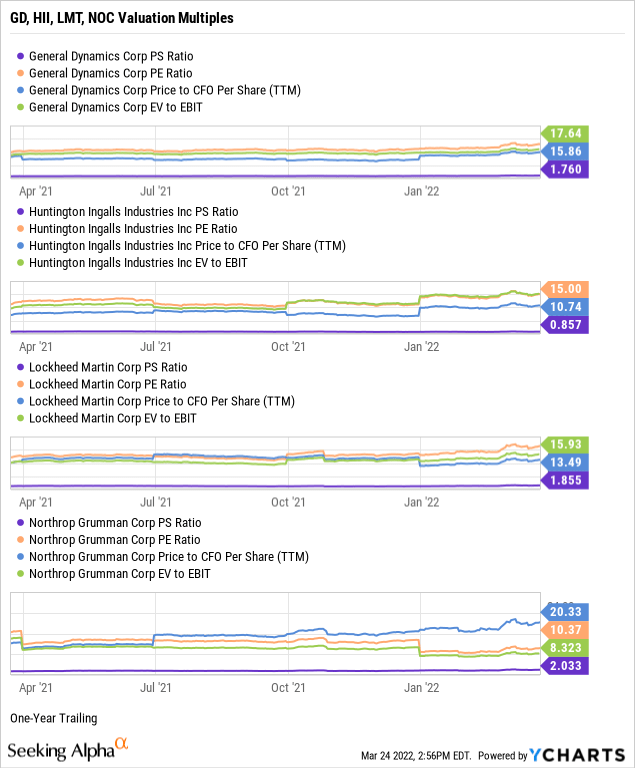
I rely on four valuation multiples to estimate the intrinsic value of a targeted quality enterprise’s stock price.
The price-to-sales ratio or P/S measures the stock price relative to revenues. I target fewer than 2.0 times, and each of the four stocks: GD, HII, LMT, and NOC, were trading at or below the ceiling. In addition, the trailing P/S ratio was 2.11 for the aerospace and defense industry and 2.94 times sales for the S&P 500. Thus, the weighted industry plus market sentiment suggests that each stock is reasonably valued relative to the topline.
Although often a hit or miss multiple, I target price-to-trailing earnings or P/E multiples fewer than 17 times or below the target stock’s industry and sector averages. GD had a price-to-earnings multiple of 20.75, HII was 15.00, LMT was 19.56, and NOC’s was 10.37, against an industry P/E of 34.01, indicating investor sentiment undervalues the stock prices relative to earnings per share. Further, the four select stocks were each trading at a discount to the S&P 500’s recent overall P/E of 24.53 (Source of S&P 500 P/E: Barron’s).
I target single-digit price-to-operating cash flow multiples for the best value. All four stocks were trading above my ceiling or compared to the industrials sector median of 16.24, indicating the market fairly values the stock prices relative to current cash flows. Notably, HII is nearest the bargain end of the cash flow valuation.
Enterprise value to operating earnings or EV/EBIT measures whether a stock is overbought, a bearish signal, or oversold, a bullish signal, by the market. I target an EV/EBIT of fewer than 15 times. Although hidden in the below chart, HII was trading at 16.40 EV/EBIT. Based on the broader sector median of 18.51 times, GD, HII, and LMT appear neither overbought nor oversold by the market. However, trading at 8.32 enterprise value to operating earnings signals NOC as underbought by the market.
The weighting of my preferred valuation multiples suggests that the market has reasonably valued the four stock prices. Therefore, based on the fundamentals and valuation metrics uncovered in this report, risks and potential catalysts notwithstanding, I would call the four select defense contractors the fairly valued, perhaps underbought stocks of quality operators within the aerospace and defense industry.
Low to Below Average Downside Risk Profiles
When assessing the downside risks of a company and its common shares, I focus on five metrics that, in my experience as an individual investor and market observer, often predict the potential risk/reward of the investment. Hence, I assign a downside risk-weighted rating of above average, average, below average, or low, biased toward below average and low-risk profiles.
Alpha-rich investors target companies with clear competitive advantages from their products or services. An investor or analyst can streamline the value proposition of an enterprise with an economic moat assignment of wide, narrow, or none.
Morningstar assigns General Dynamics, Lockheed Martin, and Northrop Grumman wide moat ratings:
They (wide moat ratings) exist because of intangible assets: product complexity that thwarts new entrants, contract structures that reduce risk for the contractor, decades long product cycles, a lack of alternative suppliers, and the switching costs of a risk-averse customer facing a significant time investment to switch over products.
While designating Huntington Ingalls Industries as a narrow moat defense contractor:
We think Huntington Ingalls is a narrow moat company. We think military shipbuilding for nuclear-powered ships is sufficiently complex to prevent new entrants and we appreciate the substantial revenue visibility provided by the company’s long-term contracts, but demand uncertainty for nuclear-powered aircraft carriers and potential overcapacity in nuclear-powered attack submarines constrains our segment moat rating to narrow.
– Burkett Huey, CFA, Equity Analyst, February 10 and January 28, 2022
A favorite of the legendary value investor Benjamin Graham, long-term debt coverage demonstrates balance sheet liquidity or a company’s capacity to pay down debt in a crisis. Generally, at least one-and-a-half times current assets to long-term debt is ideal. However, as reported on their most recent public financial statements, NOC was the only company whose long-term debt coverage was under the threshold at 0.97, whereas GD was 1.91, HII was 3.22, and LMT was 1.70.
Thus, three of the four companies have ample liquidity necessary to cover their longer-term leveraging needs. Moreover, in a further test of paydown capacity, GD’s long-term debt to equity was 60.93%, HII was 117.45%, LMT was 106.49%, and NOC at 98.85% were each significantly below my 200% ceiling. In other words, investors should become concerned only when a company’s debt is more than twice its equity.
Current liabilities coverage or current ratio measures the short-term liquidity of the balance sheet. I target higher than 1.00, and GD’s short-term debt coverage was 1.43, while HII was 1.15, LMT was 1.42, and NOC’s current ratio was 1.30. Thus, each defense contractor provides sufficient liquid assets to pay down its current liabilities such as accounts payable, accrued expenses, and unearned revenue.
As a long-term investor, I use a five-year beta trend line and screen for stocks lower than 1.25 or no more than 125% volatility to the market. GD’s 60-month trailing beta was 0.99, HII was 0.90, LMT was 0.80, and NOC has the lowest beta at 0.74. With price volatilities below the S&P 500 standard of 1.00, these defense contractors are relatively safe holdings across market cycles.
The short interest percentage of the float was 0.96%, 2.59%, 1.44%, 1.18%, respectively, for GD, HII, LMT, and NOC, all well under my 10% ceiling. Perhaps the few near-sighted bears view HII as the most vulnerable because of a narrower moat compared to its peers.
Overall, each select defense contractor is a fundamentally sound company with attractive risk profiles ranging from low for GD and LMT to below average for HII and NOC, in my view.
Investing in the Military-Industrial Complex
In his farewell address to the nation on January 17, 1961, General Dwight D. Eisenhower, the retiring two-term president and World War II hero warned U.S. citizens about the military-industrial complex.
The complex comprises the policy and monetary relationships at the federal level between legislators, the armed forces, defense contractors, and the president as commander-in-chief. During his speech, Eisenhower said, “We must guard against the acquisition of unwarranted influence, whether sought or unsought, by the military-industrial complex.” Historians could argue that his warning was intuitively profound.
“War, what is it good for? Absolutely nothing,” sings Edwin Starr in the 1970 #1 hit song, “War,” written by legendary Motown songwriters Norman Whitfield and Barrett Strong. Nevertheless, crazy, hate-filled autocrats with surnames such as Hitler, Bin Laden, and Putin, aided by their misguided supporters, come along and wreak havoc on the world every few decades or so, reminding us of the importance of a strong and adequately funded military.
With the inevitable need for a strong defense, nonetheless rife with waste and unwarranted influence, investing in the military-industrial complex, namely quality players such as General Dynamics, Huntington Ingalls Industries, Lockheed Martin, and Northrop Grumman, following adequate due diligence, may be a profitable and patriotic endeavor for the interested investor.
Be the first to comment