


josefkubes
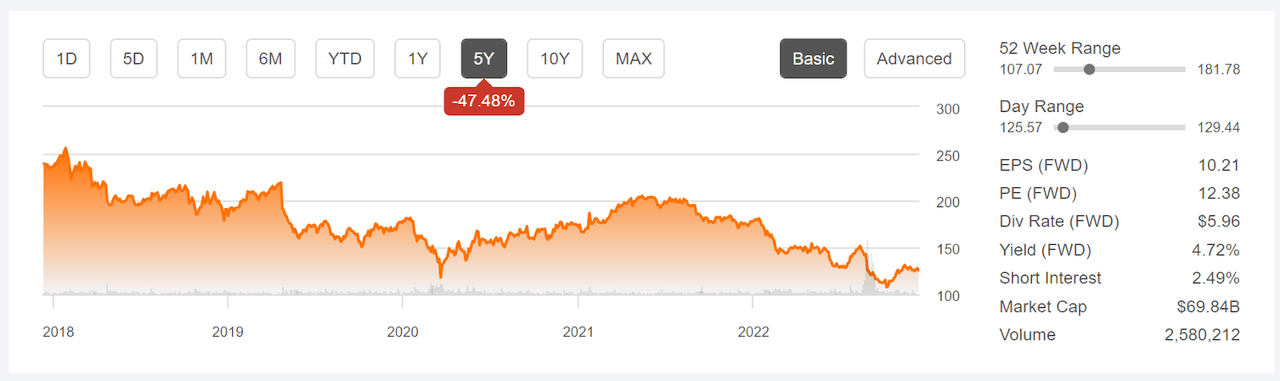
3M (NYSE:MMM) is in the midst of a very challenging period. The shares are down 47.48% over the past 5 years, with annualized total return of -8.36% per year over this period. There are a number of substantial headwinds that the company is coping with. First, inflation has cut into earnings. Second, 3M is facing significant litigation. The company is in the midst of a massive lawsuit in which 250,000 veterans are suing the company on claims that the company’s combat arms earplug is defective. In mid-November, California launched a lawsuit against 3M relating to cleanup and remediation of toxic chemicals. Third, the company is vulnerable to ongoing macroeconomic slowing in the U.S. and in Europe.
Seeking Alpha
5-Year price history and basic statistics for 3M (Source: Seeking Alpha)
Looking forward, 3M is focusing on a number of areas with substantial growth potential. One example is the suite of product lines that support electric vehicles. Another is 3M’s products for non-carbon-emitting energy sources, including solar, wind, and nuclear energy applications. The company also has intriguing fuel cell applications.
MMM has a 4.72% forward yield, with trailing 3-, 5-, and 10-year dividend growth rates of 1.14%, 4.86%, and 9.71% per year, respectively. While 3M is a dividend aristocrat, with a remarkable 64 consecutive years of dividend growth, the growth rate has slowed dramatically in the past 3 years. This is understandable, given the macroeconomic environment, but reduces the stock’s appeal for income investors.
The TTM and forward (non-GAAP) P/E for MMM are 12.5 and 12.4, respectively. The TTM GAAP P/E is 11, the lowest it has been in almost a decade. The decline in P/E reflects the challenges to growth, but the question is whether the shares look reasonable at the current valuation.
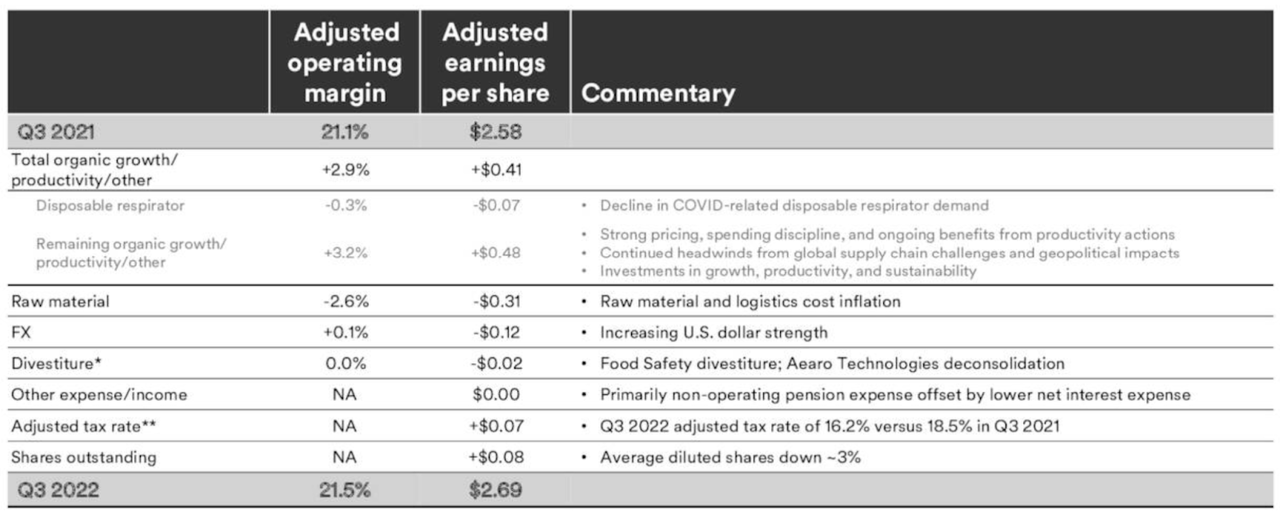
3M reported Q3 results on October 25, 2022, beating expectations on earnings but slightly missing on revenues. The company had modest organic growth, along with benefits from increasing productivity, but took a hit from inflation / logistics costs and foreign exchange.
3M
Summary of operating margin and EPS for 3M for Q3 2022 vs. Q3 2021 (Source: 3M)
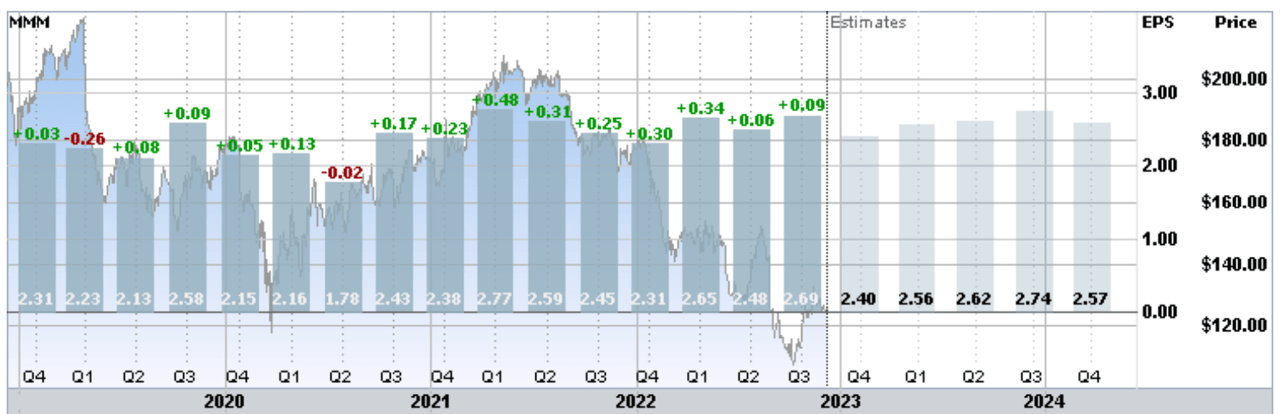
A major factor in constraining share price appreciation is 3M’s notable lack of earnings growth in recent years. There is little, if any, discernible trend over the past 4 years and the EPS for Q3 of 2022 was barely higher than for Q3 of 2019. The company’s ability to maintain EPS through COVID is a positive sign, reflecting the firm’s diverse portfolio. The outlook for EPS growth in the next year is negligible.
ETrade
Trailing (4 years) and estimated future quarterly EPS for MMM. Green (red) values are amounts by which EPS beat (missed) the consensus estimated value (Source: ETrade)
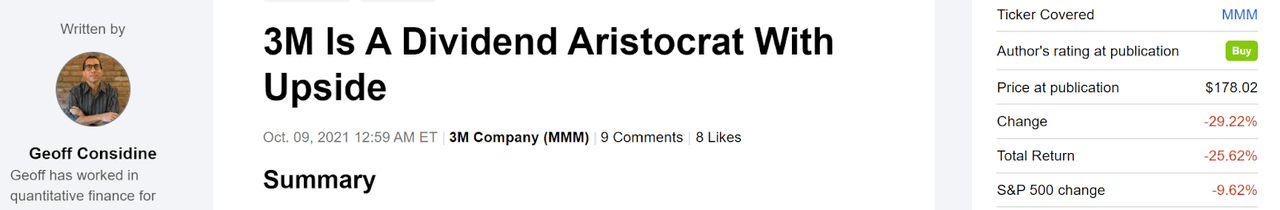
I last wrote about 3M on October 9, 2021, at which time I upgraded the shares to a buy. This has not been a great call, with the share price having decreased substantially in the period since. At that time, the Wall Street consensus rating was calculated as a sell by ETrade and as a hold by Seeking Alpha. The consensus 12-month price targets from these 2 sources were 11.4% and 13% above the share price at that time. Combined with the 3.3% forward dividend yield, the expected total return was expected to be 14.7% to 16.3% over the next year. I also looked at the market-implied outlook, a probabilistic price forecast that represents the consensus view implied by the prices of call and put options. The market-implied outlook was a buy to the middle of 2022, with expected volatility of about 26%. As a rule of thumb for a buy rating, I want to see an expected total return that is at least ½ the expected volatility. Taking the Wall Street consensus price targets at face value, MMM met this buy criterion. MMM has reported 5 quarters of results since this post, and has beaten EPS expectations for all of these. Even so, the shares have sold off and the forward P/E has fallen from 18 at the time of this article to 12.4 today.
Seeking Alpha
Previous analysis of MMM and subsequent performance vs. the S&P 500 (Source: Seeking Alpha)
For readers who are unfamiliar with the market-implied outlook, a brief explanation is needed. The price of an option on a stock is largely determined by the market’s consensus estimate of the probability that the stock price will rise above (call option) or fall below (put option) a specific level (the option strike price) between now and when the option expires. By analyzing the prices of call and put options at a range of strike prices, all with the same expiration date, it is possible to calculate a probabilistic price forecast that reconciles the options prices. This is the market-implied outlook. For a deeper explanation and background, I recommend this monograph published by the CFA Institute.
I have calculated updated market-implied outlooks for MMM and I have compared these with the current Wall Street consensus outlook in revisiting my rating.
Wall Street Consensus Outlook for MMM
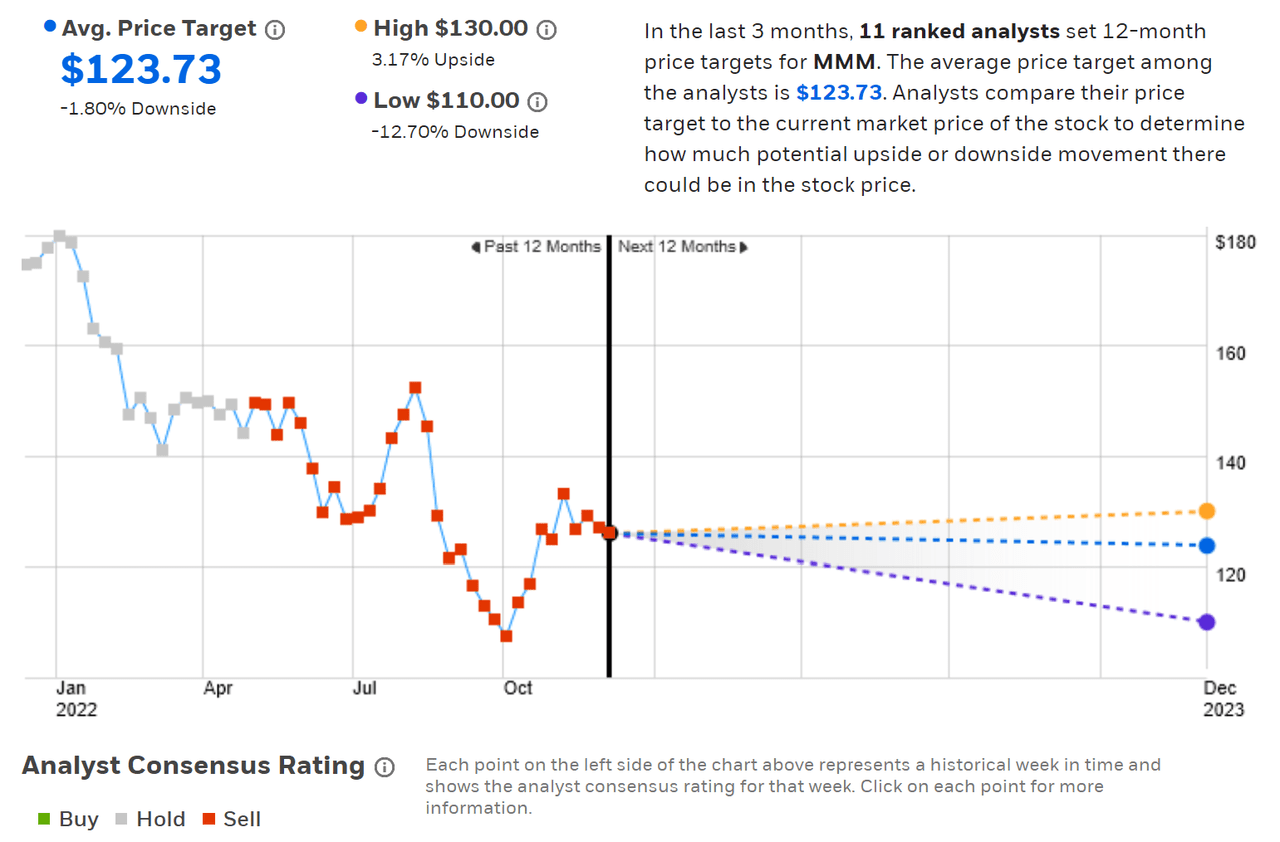
ETrade calculates the Wall Street consensus outlook for MMM using price targets and ratings from 11 ranked analysts who have published their views over the past 3 months. The consensus rating is a sell and the consensus 12-month price target is 1.8% below the current share price. Of the 11 analysts, 8 assign a hold rating and 3 have a sell rating. The highest of the individual analyst price targets is 3.17% above the current share price.
ETrade
Wall Street consensus rating and 12-month price target for MMM (Source: ETrade)
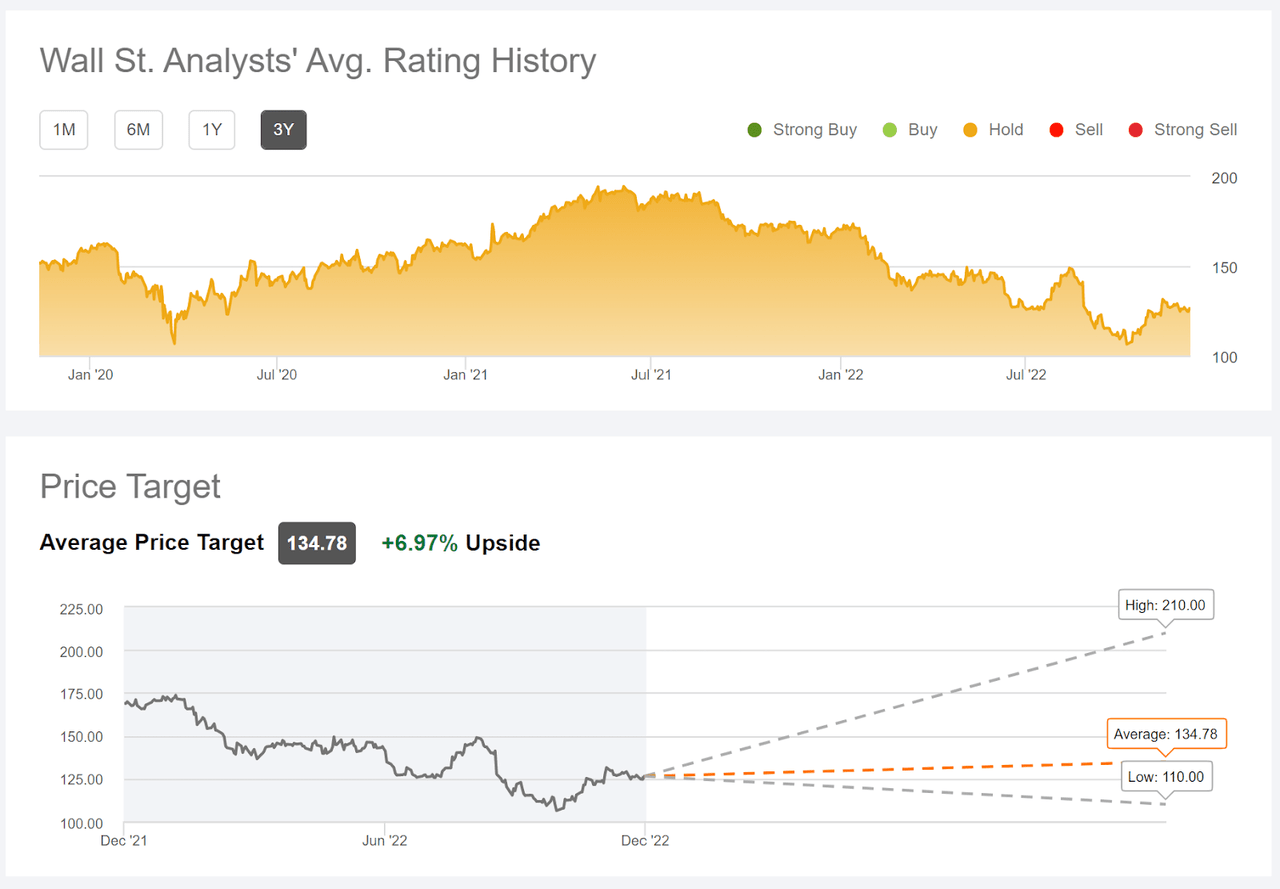
Seeking Alpha’s version of the Wall Street consensus outlook is calculated using price targets and ratings from 20 analysts who have published opinions over the past 90 days. The consensus rating is a hold, as it has been for all of the past 3 years, and the consensus 12-month price target is 7% above the current share price.
Seeking Alpha
Wall Street consensus rating and 12-month price target for MMM (Source: Seeking Alpha)
The differences between these two calculations for the Wall Street consensus outlook are rather striking and it is hard to really reconcile these. The difference is partly due to the fact that Seeking Alpha’s larger group of analysts includes one with a buy rating and one with a strong buy rating. In addition, 3 out of 8 of ETrade’s analyst cohort, 37.5%, have a sell rating on MMM vs. 5 out of 20, 25%, in Seeking Alpha’s cohort. Considering both of these consensus estimates, one may reasonably conclude that the prevailing view is that MMM offers little price appreciation potential over the next year.
Market-Implied Outlook for MMM
I have calculated the market-implied outlook for MMM for the 6.25-month period from now until June 16, 2023 and for the 13.4-month period from now until January 19, 2024, using the prices of call and put options that expire on these dates. I selected these specific expiration dates to provide a view to the middle of 2023 and for the full year.
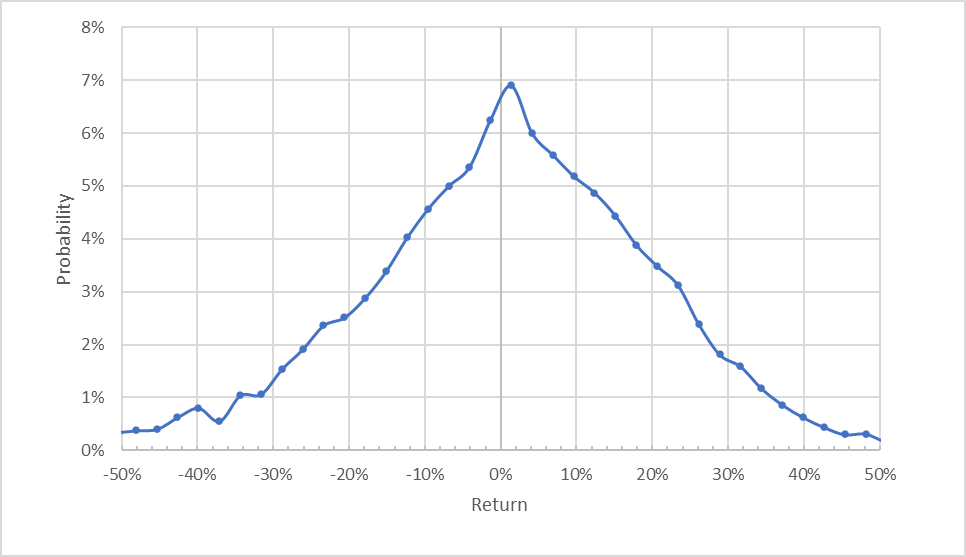
The standard presentation of the market-implied outlook is a probability distribution of price return, with probability on the vertical axis and return on the horizontal.
Geoff Considine
Market-implied price return probabilities for MMM for the 6.25-month period from now until June 16, 2023 (Source: Author’s calculations using options quotes from ETrade)
The market-implied outlook to the middle of 2023 is centered close to zero, with the maximum probability corresponding to a price return of +1.4%. There is, however, an asymmetry in the distribution that favors positive returns over this period. Compare, for example, the probability of having a 10% return to that for a -10% return. The expected volatility calculated from this distribution is 28% (annualized), which is moderate for a large cap stock. For comparison, ETrade calculates a 27% implied volatility for the options expiring on June 16, 2023.
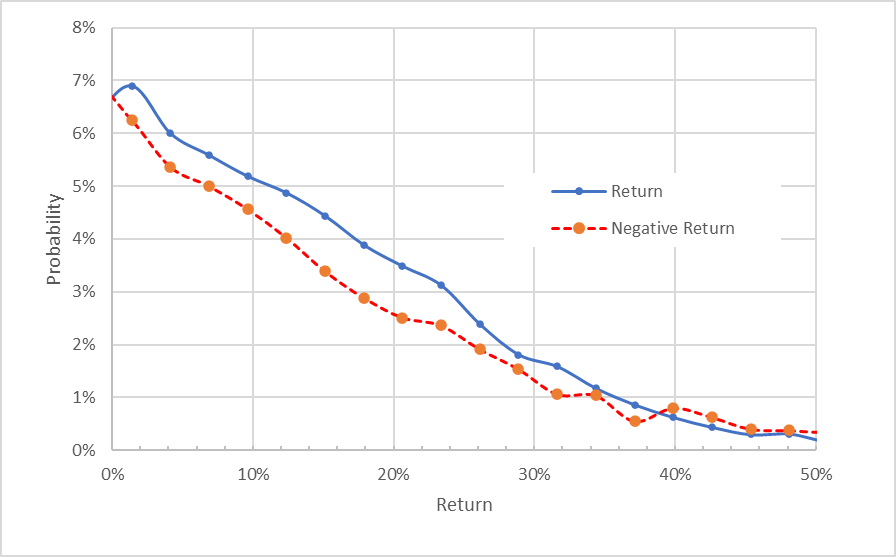
To make it easier to compare the relative probabilities of positive and negative returns, I rotate the negative return side of the distribution about the vertical axis (see chart below).
Geoff Considine
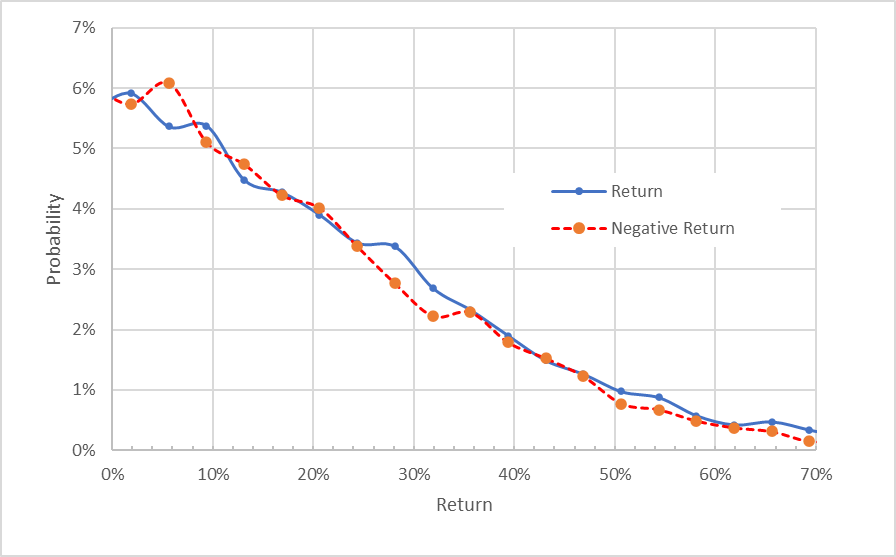
Market-implied price return probabilities for MMM for the 6.25-month period from now until June 16, 2023. The negative return side of the distribution has been rotated about the vertical axis (Source: Author’s calculations using options quotes from ETrade)
Viewed in this way, it is clear that the probabilities of positive returns are consistently higher than for negative returns of the same magnitude, across a wide range of the most-probable outcomes (the solid blue line is above the dashed red line over the left ¾ of the chart above). This is a bullish orientation in the market-implied outlook to mid-2023.
Theory indicates that the market-implied outlook is expected to have a negative bias because investors, in aggregate, are risk averse and thus tend to pay more than fair value for downside protection. There is no way to measure the magnitude of this bias, or whether it is even present, however. The expectation of a negative bias reinforces the bullish interpretation of this outlook.
The market-implied outlook for the 13.4-month period to January 19, 2024 exhibits a much closer match between the probabilities of positive and negative returns. Because of the expectation that there will be a negative bias, this outlook is interpreted as slightly bullish. The expected volatility calculated from this distribution is 28% annualized.
Geoff Considine
Market-implied price return probabilities for MMM for the 13.4-month period from now until January 19, 2024. The negative return side of the distribution has been rotated about the vertical axis (Source: Author’s calculations using options quotes from ETrade)
The market-implied outlook to the middle of 2023 is bullish and the outlook to the start of 2024 is slightly bullish. The expected volatility is moderate. Overall, this is a fairly favorable view. That said, the market-implied outlook from October 9, 2021 to the middle to the middle of 2022 was somewhat bullish (albeit less than the current view to the middle to 2023).
Summary
There is no question that 3M has been operating in, and continues to face, difficult circumstances. The prevailing analyst view, supported by management commentary, suggests a low- or no-growth view for the next year or so. The Wall Street consensus rating calculated by ETrade is a sell and the version from Seeking Alpha is a hold. Seeking Alpha’s estimate of the consensus price target implies an 11.7% total return for the next year, while ETrade’s calculation corresponds to a total return of 2.9%. With an expected volatility of about 28%, even the 11.7% expected return is not terribly attractive. As a rule of thumb for a buy rating, I want to see an expected total return that is at least ½ the expected volatility. The market-implied outlook for MMM is bullish to the middle of 2023 and slightly bullish to the start of 2024. With the disagreement between the Wall Street consensus and market-implied outlook, along with the evident major challenges that the company faces in the near term, I am changing my rating on MMM to a hold.
Even with little expected price appreciation, there is a decent income opportunity available with MMM. As I have been writing this post, I purchased shares of MMM for $126.02 and sold call options with a strike price of $130, expiring on January 19, 2024, for $12.82. This net position provides 10.17% in option premium income ($12.82/$126.02) over 13.4 months (9.1% annualized). Adding the annualized option premium income to the 4.7% dividend yield, the total 12-month income is 13.8%. This is quite a lot of income for a stock with 28% expected volatility. If the Wall Street consensus view is correct, and the shares have little or no upside, selling covered calls will turn out to be a good way to play MMM.
Be the first to comment