

Vasil Dimitrov/iStock via Getty Images
In a bull market it’s easy to be right, but a bear market can show you what you are doing wrong. Not paying attention to risk ranks at the top of the list.
Reducing Risk
There are three ways to reduce risk in any market:
- Reduce your portfolio volatility when it gets too high
- Exit positions when the trend goes against you
- Diversify into three or four “industrial” groups
Increasing Returns
- Increase your exposure during uptrends with lower volatility
- Concentrate your portfolio in markets that are outperforming
Combine both risk reduction and increased returns with the discipline of a single moving average and your performance will increase dramatically.
1. Reducing Volatility
The best way to set your initial positions is with equal risk. For stocks, you divide your current equity by the number of stocks you will trade, then just divide by the closing price to get the position size. It’s not perfect, but if you don’t trade stocks priced under $10, it works well. Low prices stocks make much bigger percentage moves and can be wildly erratic.
But starting with equal risk does not continue with equal risk. The overall market can become more volatile, which can be seen in the VIX (Chart 1). Anything over 30% is considered unusually volatile and very risky.
Data from CSI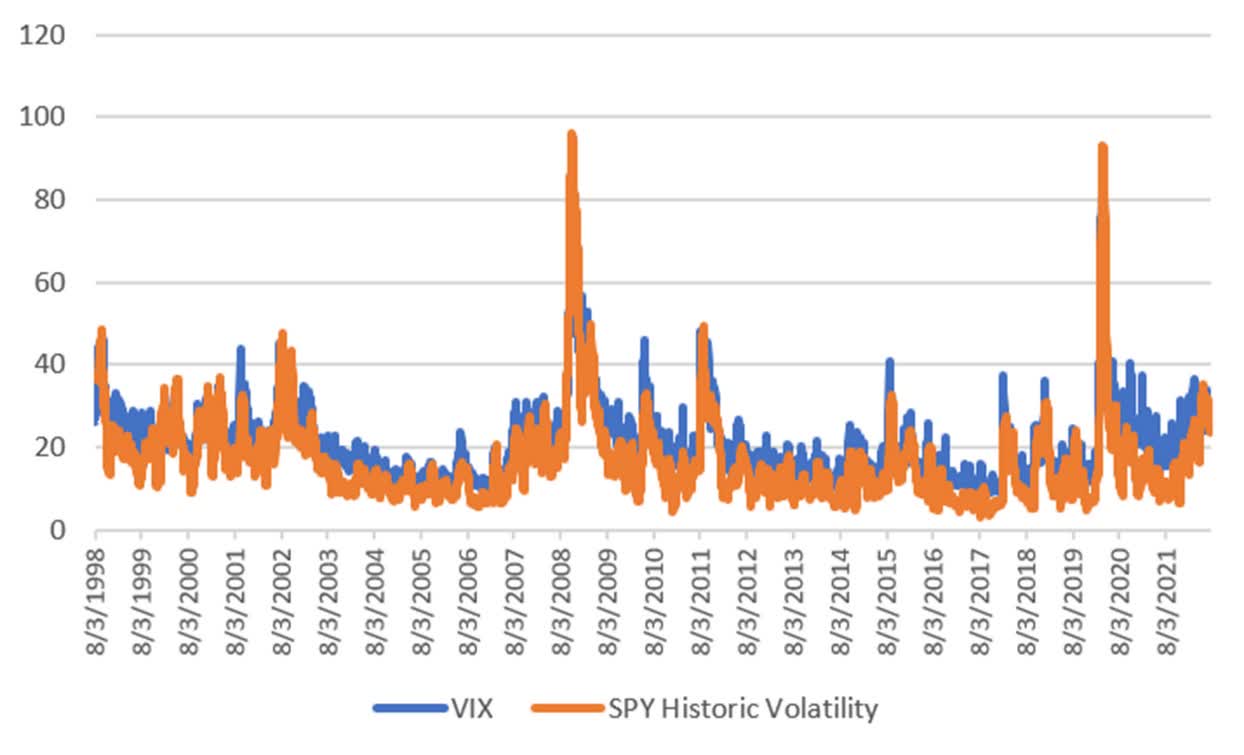
Chart 1. VIX compared to historic volatility (the 20-day annualized volatility)
There are two ways of measuring volatility. VIX is done for us and available online daily. It shows how trader think volatility will be in the future. Historic volatility measures the volatility over the last 20-days. It is the standard deviation of last 20-day returns times the square root of 252. Again, if it is greater than 30% we have extreme volatility. It can go to 100%. Either way you measure it is fine. VIX tends to be a bit higher and more erratic, so I prefer historic volatility. To control volatility, you follow these steps:
- Measure the volatility of your portfolio returns to get a benchmark. You do this by applying the historic calculate (above) to the most recent 20-day returns of your portfolio. Most fund managers want this value to be about 12%.
12% volatility means there is a 16% chance of losing 12% and a 2.5% chance of losing 24%. You can change that by setting your target volatility higher or lower than 12% and scaling your position size to match that volatility.
- If volatility increases by 20% (from 12% to 14.4%) reduce your position size by 20% or in proportion to the increase in volatility. That will keep your risk under control.
2. Exit Your Portfolio When the Trend Goes Against You
This is an easy concept but deciding on the speed of the trend is more difficult. You can go with the classic death cross, 50-day moving average crossing below the 200-day average, or any combination that includes a long-term trend, 60 days or longer, to capture the underlying economic basis for the market direction.
Personally, I like using just a 110-day moving average for S&P futures or ETF (SPY) as well as Nasdaq (QQQ). You exit when the trendline turns down (not when the price crosses the trendline) and reenter when the trendline turns up. Any trading platform will let you display a 110-day moving average. No calculation necessary.
Trend-following is not perfect because it lags price movement. But that is also its greatest benefit. By lagging it does not get in and out with every price turn. It only reacts to the bigger moves. On balance, that turns out to be good.
There have been three major bear markets since 2000, the end of the dot.com bubble in 2000, the financial crisis in 2008, and the trade war at the beginning of 2020. Charts 2 shows SPY with a 110-day moving average and the places where the trend turned down at the end of 2007, then up in 2009, after the financial crisis.
TradeStation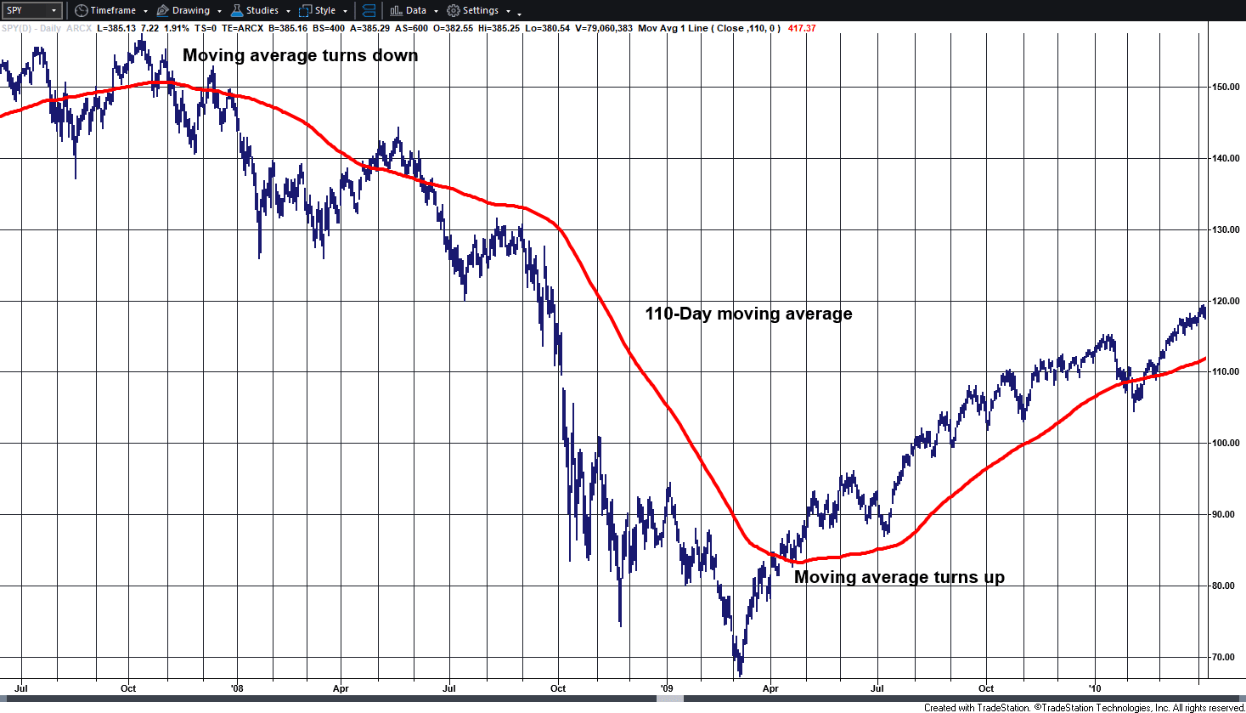
Chart 2. SPY with a 110-day moving average during 2008.
Figure 3 shows how the same 110-day moving average, applied to Nasdaq (QQQ), would have gotten out during our current stock market downturn. It shows a small loss at the beginning of 2020 (the trade war, left bottom) and an exit not far from the top at the beginning of 2022.
TradeStation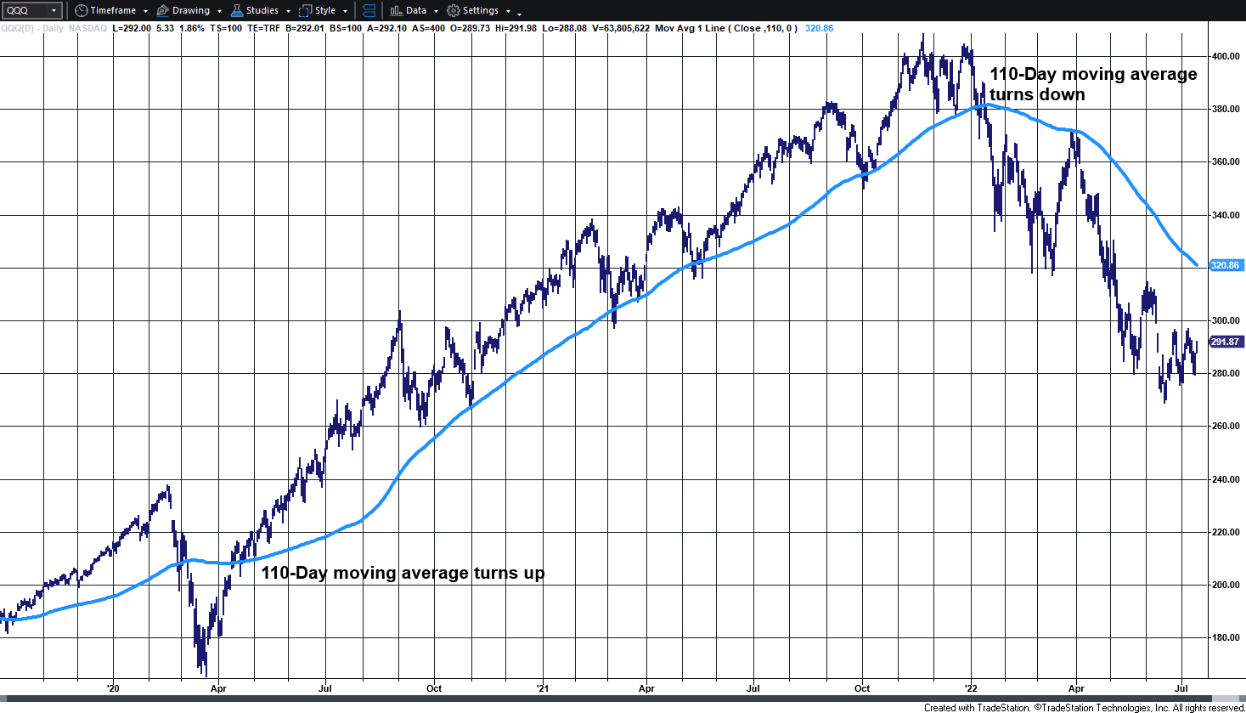
Chart 3. QQQ using a 110-day moving average to capture the uptrend and exit early in the recent sell-off.
You will suffer some equity swings using a slow trend as a trading tool, but that trend will track the economic climate and react to significant changes in trader sentiment. If you apply the moving average to QQQ from 2000 to 2003 you will see it also performed well.
3. Diversify Into 3 or 4 Industrial Groups
The more you diversify, the closer you get to the broad index, SPY or QQQ. By using only 3 or 4 different groups you get the best of diversification and still leave room to outperform the overall market.
You can’t get more than modest diversification in stocks, no matter how hard you try. A large percentage of stocks will go up and down together. When you are making the most money, stocks are rising; therefore, they are highly correlated. Just do your best to pick stocks from groups that benefit differently from various economic situations, such as defense, healthcare, and retail. Look at the offering by iShares, then pick one important stock from each of 3 or 4 groups.
Increasing Returns
Oddly enough, you can increase returns by doing the opposite of diversifying.
1. Don’t Diversify
By choosing stocks in the same sector, such as energy during June, you increase your chances of outperforming the market and at the same time increase your risk. It’s called concentration. You can offset the risk by tracking your portfolio volatility and reducing your exposure when risk gets too high (discussed at the beginning of this article). You then get a better return without extreme risk.
Chart 4 shows the returns of the ETFs XLE (Energy), XLF (Financials), and XLV (Healthcare). Energy outperformed starting in January 2022 but now the other ETFs are trying for a rally while energy trades lower. You can use a simple moving average to track the buy and sell points for these ETFs.
Data from CSI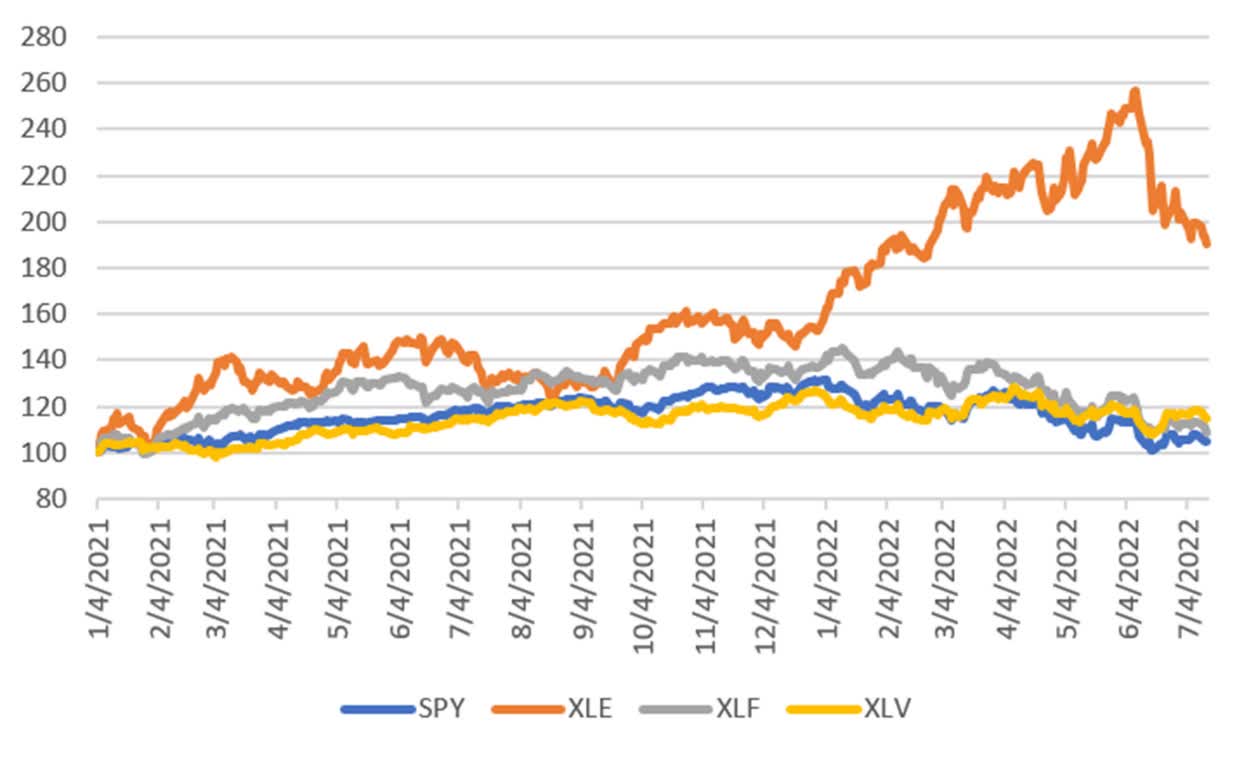
Chart 4. Comparing the performance of XLE, XLF, and XLV compared to SPY.
2. Increase Exposure During Upward Trends with Low Volatility
It is an interesting characteristic that a bull market has lower volatility than either a sideways (uncertain) or bear market. You can identify a bull market using a long-term trend. You can measure volatility using either VIX or calculating historic volatility as discussed earlier.
As an example, Chart 5 shows the VIX and historic volatility with highlighted areas corresponding to the bull markets that started in 2003 and 2010. With the current bear market, volatility has increased in a pattern similar to the beginning of the financial crisis in 2007.
Data from CSI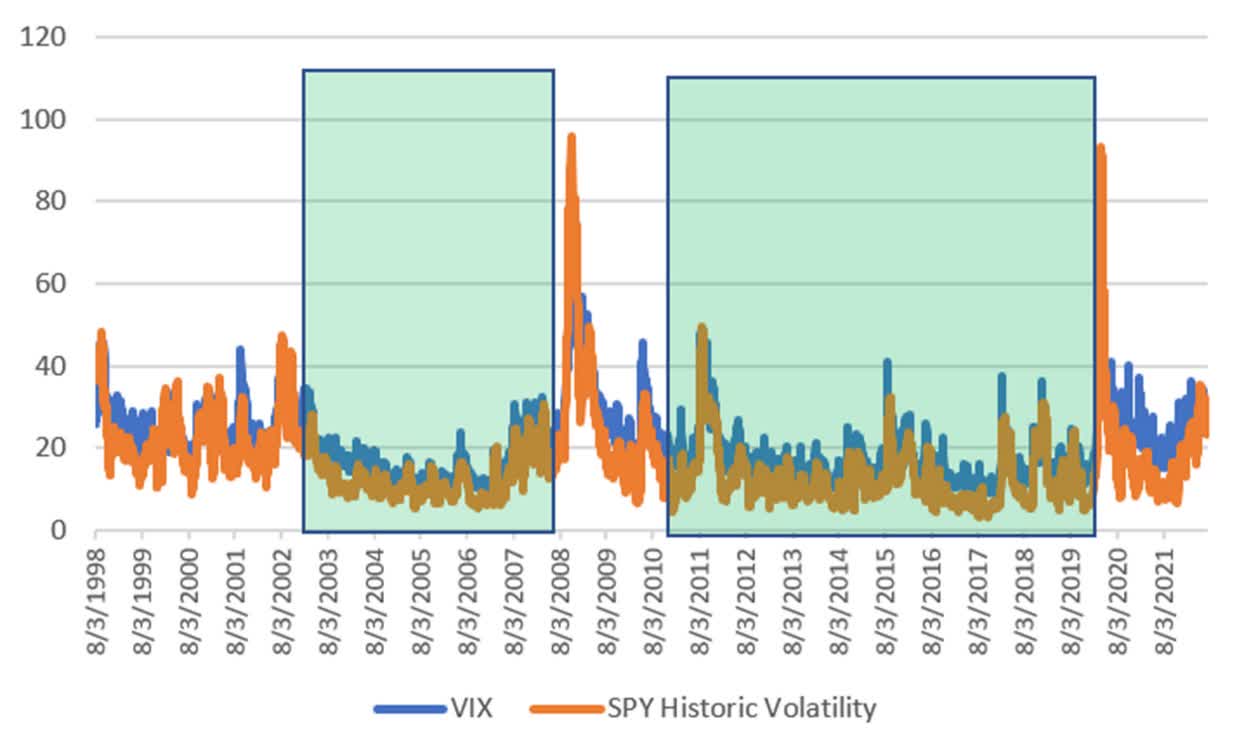
Chart 5. Periods of lower volatility during bull markets.
This is just a reminder that you need to increase your exposure during an uptrend when volatility falls below your target. If not, your returns will be profitable, but disappointing.
It’s Your Money
If you are a passive investor, you do nothing and eventually the market comes to you. But the risk is still there, and the returns do not justify the risk. By managing the risk using leverage and recognizing changes of direction with a long-term trend, you can greatly improve your returns and lower your risk. It may take more time, but it’s your money. Our investments represent a good part of our wealth. They deserve some extra attention.
Be the first to comment