

Nordroden/iStock via Getty Images
Investment Thesis
A commodity supercycle has begun due to increased demand for metals, tight supply dynamics, and record inflation, all of which are acting as tailwinds to rising prices. Companies whose operations are directly tied to the prices of these resources will benefit, and three, in particular, stand out as winners: Nucor (NUE), Newmont (NEM), and NextSource Materials (OTCQB:NSRCF). After years of underperforming, I argue that all three of these companies are still “cheap” fundamentally and can move higher despite their recent moves higher. But, before diving into the business models and valuations of these companies, I first want to explain why we just entered the beginning of a commodity supercycle.
The Commodity Supercycle Has Begun
Since 2014, there has been an underinvestment in commodities, especially metals such as gold and silver. This is primarily due to tempered inflation over the period which led to explosive economic growth and outperformance from other asset classes. Now that the genie is back out of the bottle and inflation is at a 40-year high, commodities have enjoyed a handsome rally. I believe the rally has much more than just “legs” and we could be at the start of a multi-decade sustained period of price expansion for commodities and the chart below suggests the same.
Commodity Supercycle Chart (www.zerohedge.com/commodities/primer-commodity-supercycles)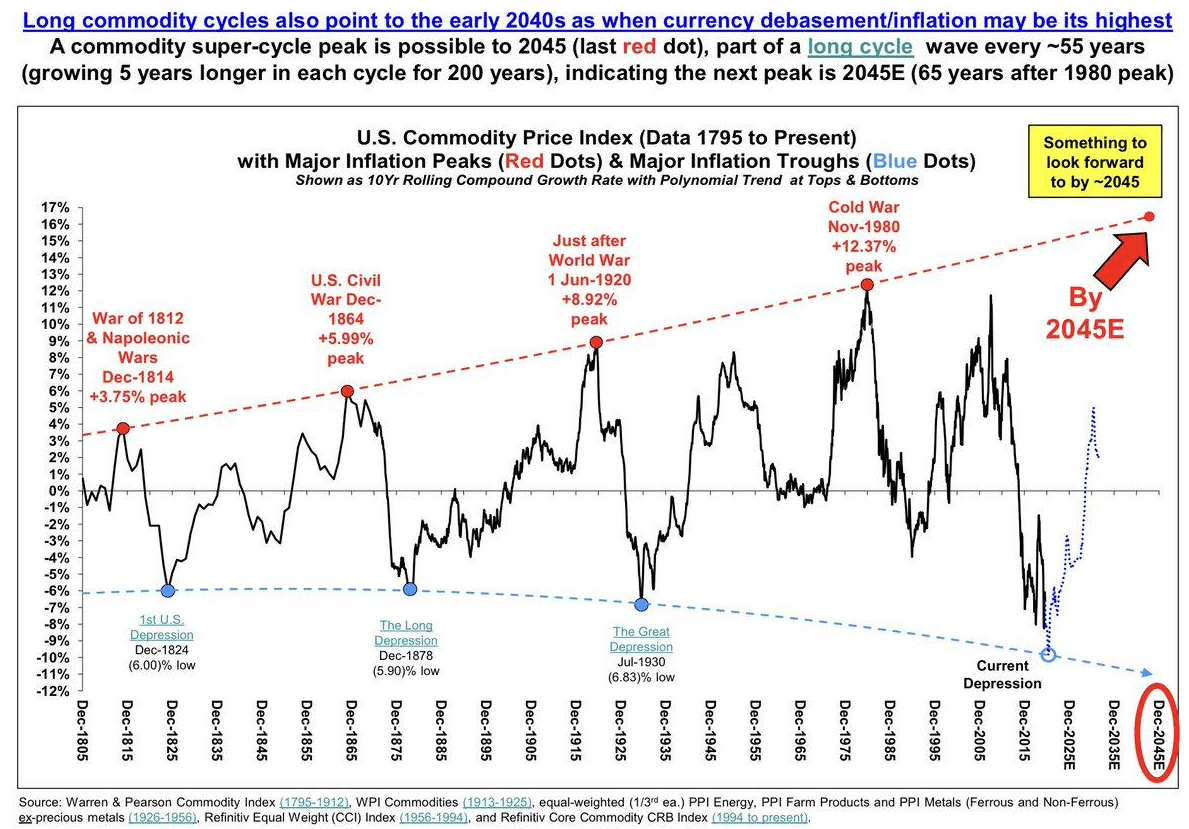
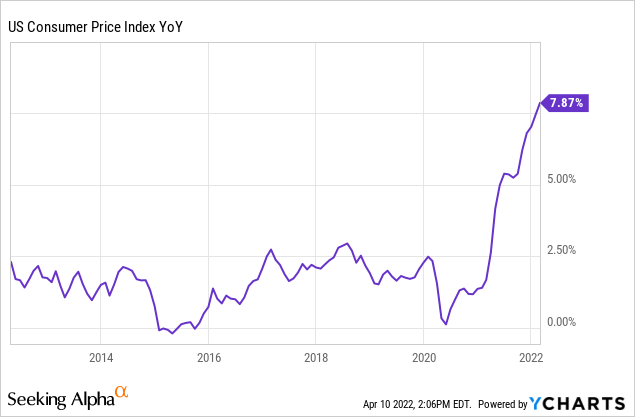
According to the chart of the U.S. Commodity Price Index, we are at the beginning of an expansion that could last until 2045. Troughs in the index (blue dots) have corresponded with troughs in inflation. Peaks in the index correspond with peaks in inflation (red dots). It is no doubt that inflation has recently troughed, and it’s anybody’s guess as to how long it will take to peak out. Recent CPI data supports this.
A common argument could be that the federal reserve is acting to tame inflation by raising rates and commodity prices will come down. My counterargument is that there is a structural demand for metals due to increased investment in infrastructure ($1T U.S. infrastructure bill) and electric vehicle buildout/demand. This demand is predicted to be lasting and increase over the years, as shown by the chart below.
BloombergNEF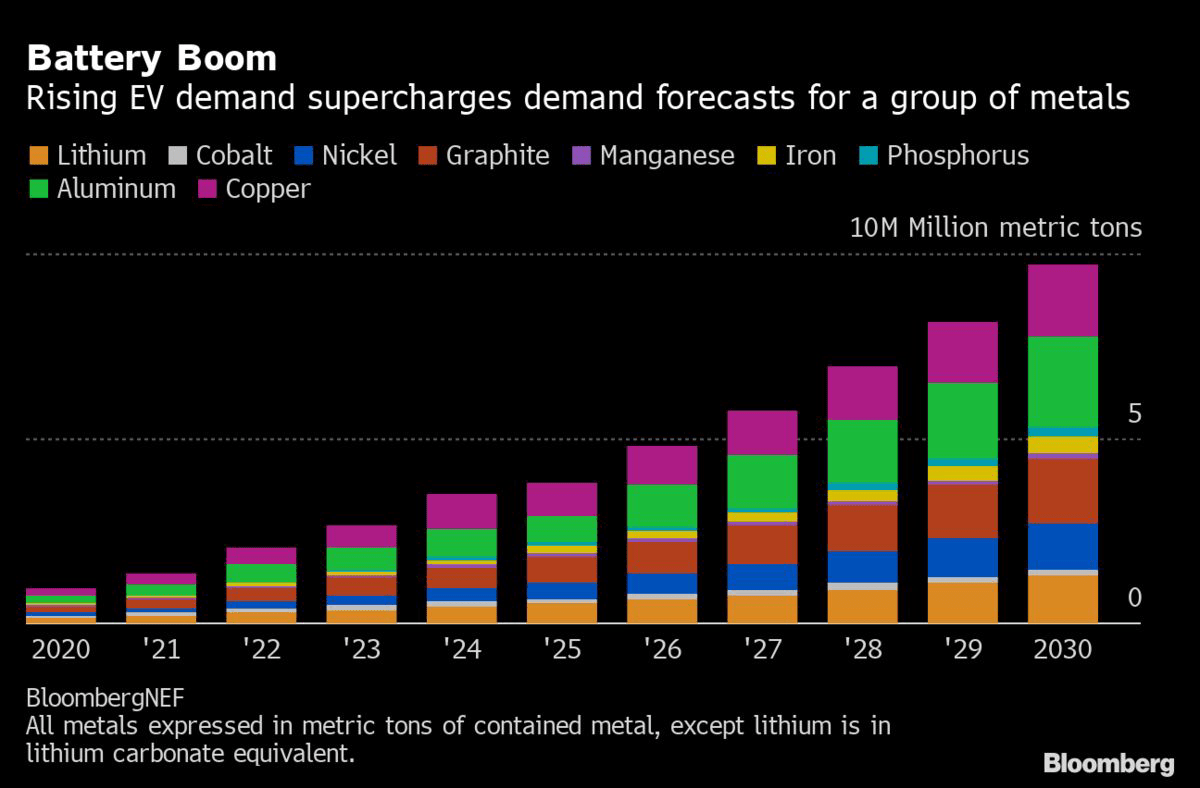
This group of metals includes graphite (which is why I am bullish on NSRCF… more on that later), but as they say “a rising tide lifts all boats.” This is why I continue to be bullish on the price of steel and gold.
But what is the best way to play this “supercycle” that is upon us? Instead of buying the physical commodities themselves, I am more interested in finding companies that benefit from these higher prices and high demand. This brought me to Nucor, Newmont, and NextSource Materials.
Nucor’s Business Overview
Nucor was founded in 1958 and is a manufacturer of steel and steel products. The company reports through three segments: steel mills, steel products, and raw materials. Its biggest segment, steel mills, made up 66% of the company’s revenue in 2021 and is concerned with manufacturing steel plates, beams, bars, etc, for industrial use. Below is a chart of the company’s customers by end market.
10-K SEC Filing Nucor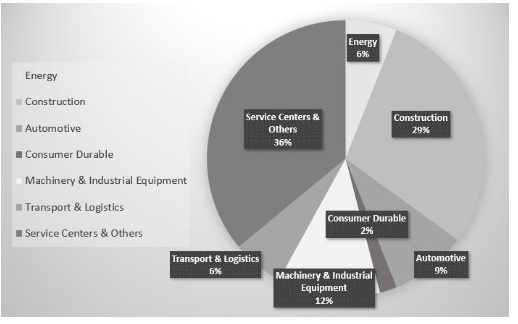
Service Centers & Others/Construction made up the majority (55%) of customers in 2021 within its steel mills segment. Nucor’s diversity of customers and industries in which it does business allows it to have a broad reach.
Steel prices are up ~25.10% YTD which shows the strong demand to continue building out infrastructure.
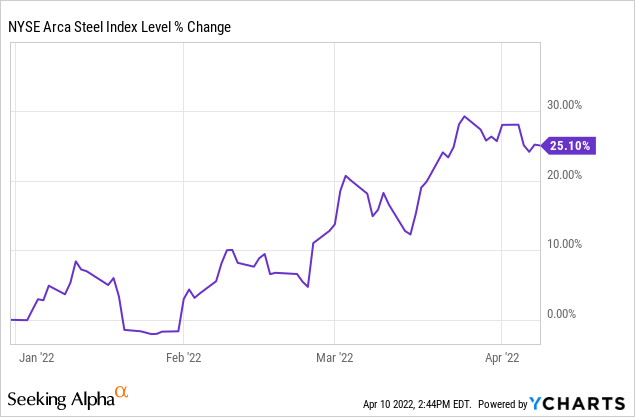
As steel prices increase, Nucor will benefit from pricing power as input costs to produce steel are passed on to customers. As cited by the company’s CFO Jim Frias in the Q4-21 earnings call “The steel products segment is expected to achieve further margin expansion and profitability in the first quarter of 2022.”
In terms of the $1T infrastructure bill passed by the Senate last year, Nucor’s CEO told Jim Cramer in an interview on Mad Money that the company is “eager to help build out this country.” The combination of rising steel prices, sustained demand, and pricing power are all important to my valuation of the company which can be found below.
Nucor Valuation
Over the past three years, Nucor has increased revenues by 45.76%. Most of this increase in revenues was post mid-2020, during the COVID-19 economic recovery.
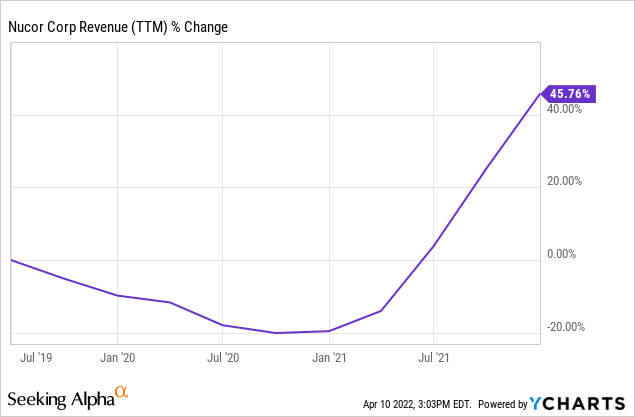
I expect revenues to continue on a strong path forward but at a more muted rate. Below you can find a chart of my revenue expectations for the company over the next five years which is the main driver of my DCF valuation.
The Black Sheep Revenue Forecast – Nucor (Forecast/Image by author using own calculations )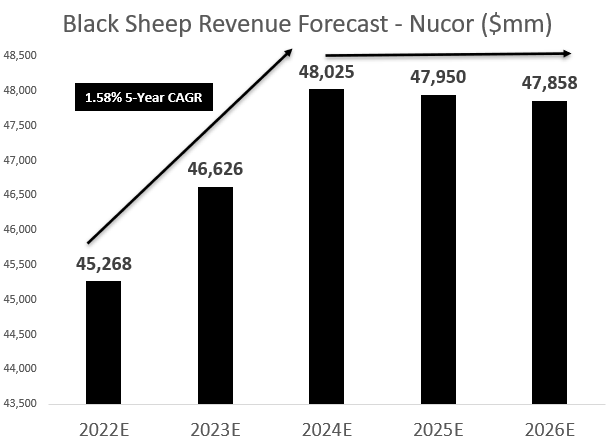
The 1.58% 5-Year CAGR in revenues is predicated on continued demand for Nucor’s products. I also assume that silver prices remain elevated as the commodity supercycle I anticipate plays out. These assumptions lead me to my DCF model which can be found below.
Nucor DCF Model – The Black Sheep (Model made by author using own forecasts and calculations )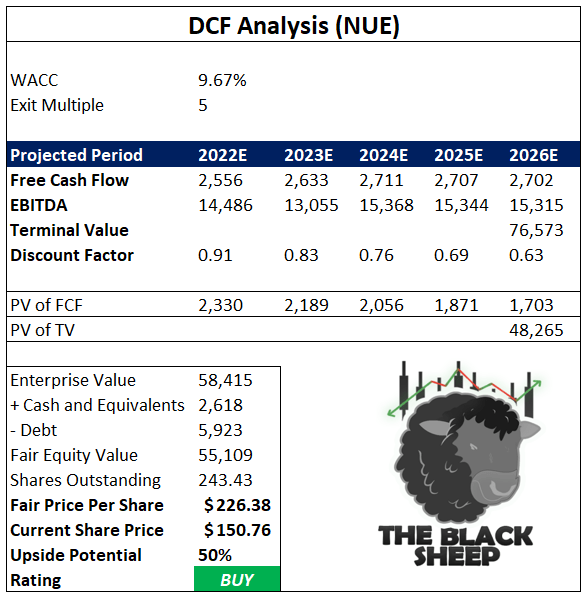
Beyond my free cash flow and EBITDA forecasts which can be found in the model, I also assume a 9.67% WACC, 5x exit multiple on year-5 EBITDA, and arrive at a terminal value of $76.573B. After discounting all cash flows, subtracting net debt, and dividing by shares outstanding, I arrive at a fair value of $226.38. This represents a 50% upside opportunity for the stock.
Seeking Alpha’s “Quant Score” agrees, rating the stock a ‘strong buy’ at current levels.
Nucor “Strong Buy” Quant Rating (Seeking Alpha )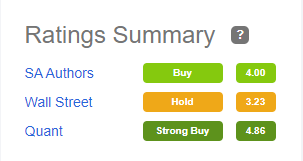
I have also accounted for the company’s anticipation to continue repurchasing shares. As of the company’s recent 10-K, $3.849B remains available for repurchases. At current levels, this represents roughly 25.5M more shares. I subtracted this number from the company’s current shares outstanding (269.1M) to arrive at the 2433.43M assumed in the model.
Nucor Balance Sheet Analysis
Below you will find the important line items of Nucor’s balance sheet.
Important BS Items – Nucor (Image Made By Author Using Seeking Alpha Financials )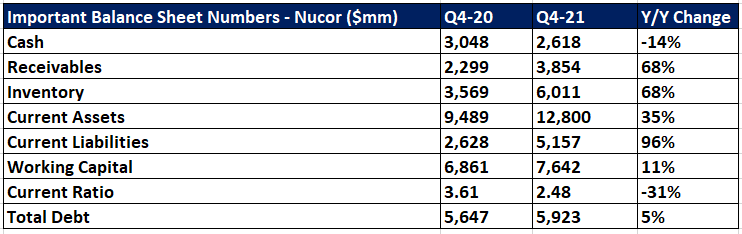
The company’s balance sheet looks strong, with a 2.48x current ratio and nearly doubling working capital Y/Y. This shows that the company is in a strong stance in terms of liquidity. Inventory is up 68% as well. I always find it encouraging when a company is increasing its inventory as I’ve found it is often a precursor to heightened future demand.
Newmont’s Business Model
Newmont’s main course of business is through the mining and distribution of gold. The company has gold reserves of 92.8M ounces across the United States, Canada, Mexico, Dominican Republic, Peru, Suriname, Argentina, Chile, Australia and Ghana. In addition to gold, the company also mines copper, silver, lead, and zinc. In 2021, the company had total sales of $12.222B. disaggregation of revenue by metal can be found below.
Newmont Revenue Disaggregation (Image Made By Author Financials From Newmont 10-K SEC Filing )
The results of Newmont’s operations are heavily tied to the prices of these metals.
Newmont 2022 BMO Global Metals & Mining Conference Presentation (Newmont Investor Relations )
It is no secret, therefore, that the company has performed well YTD in sympathy with the recent breakout in gold prices.
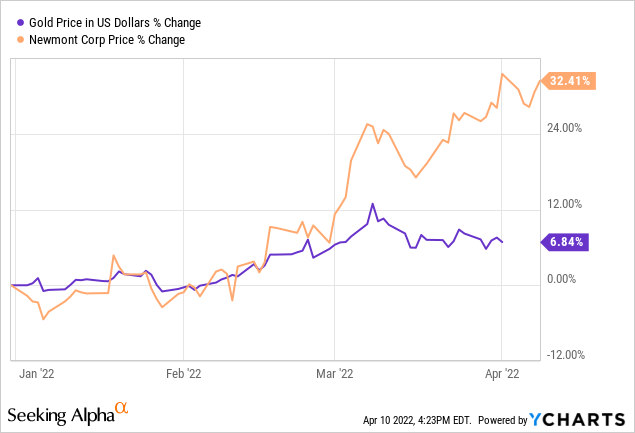
While my position on gold prices has already been stated, that the rally is just getting started, Goldman Sachs believes gold prices will hit $2500/oz by year’s end. Recent price action in Newmont suggests that if this occurs, the stock will continue its momentous move higher. My DCF valuation supports this possibility, as will be shown below.
Newmont Valuation
My valuation of Newmont is predicated on my revenue assumptions which can be found below.
Newmont Revenue Forecast – The Black Sheep (Forecast made by author using own calculations )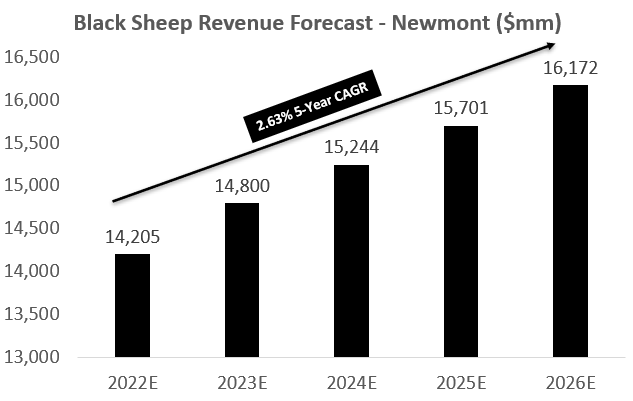
My 2.63% revenue CAGR over the next five years is based on my optimism that gold and other metal prices will move higher. This is primarily due to the record inflation we are currently seeing, increased demand for battery-related metals, and tight supply currently. Given the leverage to gold and other metal prices is so tight for Newmont, this would greatly support the company’s revenues. Based on this top-line assumption, my DCF model can be found below.
Newmont DCF Model (DCF Made by author using own calculations )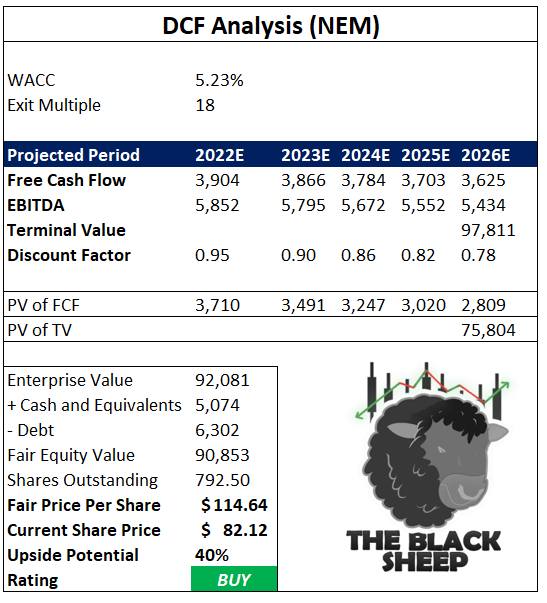
Beyond my free cash flow and EBITDA assumptions which you can find in the model, I also assume a WACC of 5.23%, exit multiple on year-5 EBITDA of 18 (giving a TV of $97.811B), and after discounting/subtracting net debt/dividing by shares outstanding derive a fair value of $114.64 for the stock. This signifies a buying opportunity with 40% upside potential.
Newmont Balance Sheet
Outlined below are some of Newmont’s important balance sheet metrics that investors should be paying attention to.
Important BS Items – Newmont (Image Made By Author Using Seeking Alpha Financials )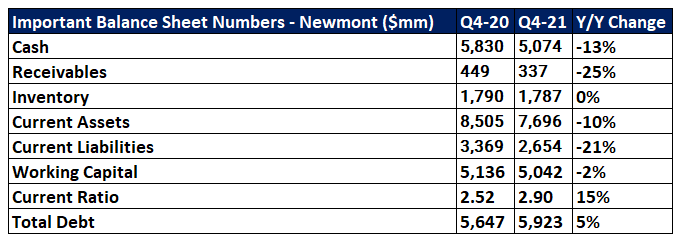
The company’s cash and receivables shrunk Y/Y, but the company was able to reduce its current liabilities 21% which allowed its current ratio to increase. This shows that the company has plenty of liquid assets to cover its near-term liabilities and I view that positively. Total debt increased slightly, but I am not worried given the free cash flow characteristics of the company more than offset any slight increase in debt. In general, the balance sheet remained strong Y/Y.
NextSource Material’s Business Model
NextSource Materials is unique among the three companies I am covering because it is a small-cap, pre-revenue, but fully funded graphite mining company with operations on a small island off of Madagascar.
Molo Mine – NextSource Materials (NextSource Materials Investor Presentation)
*Note: Although the operations of the company are in Madagascar, the company is based in Toronto, Canada.
The company is headed by Sir Mick Davis, an extremely successful executive within the mining industry that has even earned him the title “Mick The Miner.” Sir Mick Davis financed NextSource’s $28.5M through his holding company Vision Blue Resources. Construction is underway and the mine is expected to be completed in Q4-22. The location is perfect as it is near several key ports for easy offtake. Luckily for NextSource, it has already secured supply agreements for >100% of its phase one capacity. It first signed an agreement with a major Japanese electric vehicle anode producer in 2018 and more recently with a German electric vehicle battery producer “thyssenkrupp“. NextSource Materials stated that the Japanese battery producer (of which a name has not been publicized) is integrated into Tesla’s supply chain.
NextSource Materials Partnership In Supply Chain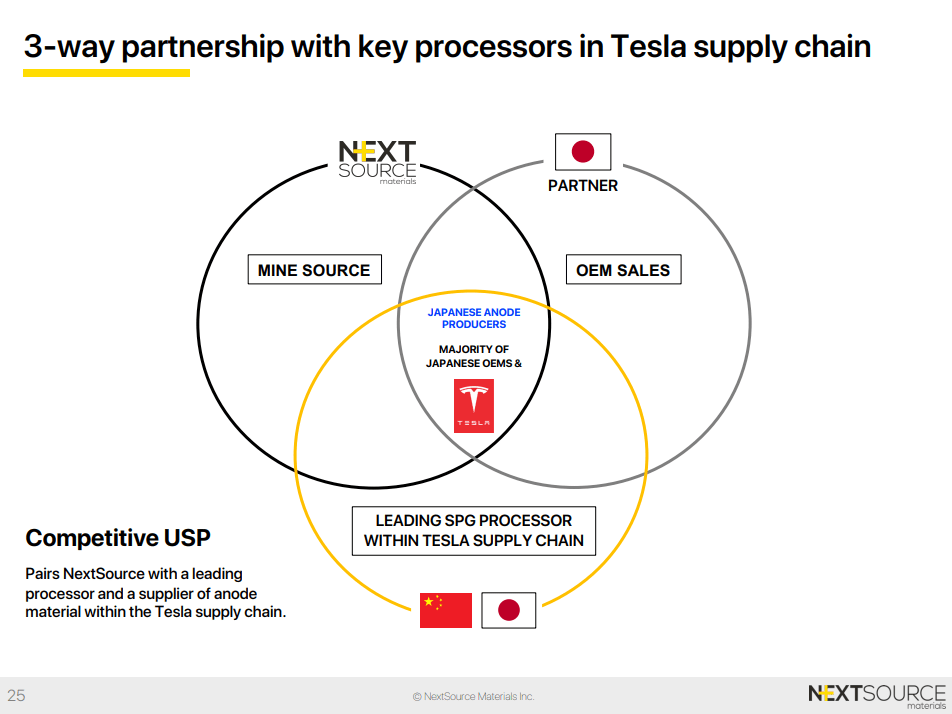
In terms of operations, the mine will have a production capacity of 17,000 tonnes of graphite a year over the first two years and then 45,000 tonnes per year from year three on. NextSource coins this graphite as a “superflake” through a registered trademark. The applications for this superflake are wide-ranging as shown in the graphic below.
NextSource Materials Superflake (NSRCF Investor Presentation )
In addition, the company just recently announced a new PEA (preliminary economic assessment) for an enhanced phase two of expansion of the graphite mine that would increase the company’s mining capabilities to a total of 150,000 tonnes annually.
A summary of the PEA can be found below.
|
Description |
Preliminary Economic Assessment (150k tpa) |
|
Economic Highlights |
|
|
Pre-tax Net Present Value (“NPV”) (8% discount rate) (1)(2) |
US$929.6 million |
|
Post-tax and royalty NPV (8% discount rate) (1)(2)(3) |
US$612.6 million |
|
Pre-tax Internal Rate of Return (“IRR”) (1)(2)(3)(4) |
41.1% |
|
Post-tax and royalty IRR (1)(2)(3)(4) |
32.0% |
|
Life of Mine (“LOM”) |
26 years |
|
Annual average production of SuperFlake® graphite concentrate(5)(6) |
150,000 tonnes |
|
Payback (Pre-tax) (1)(2)(3)(4) |
3.1 years |
|
Payback (Post-tax and royalty) (1)(2)(3)(4) |
3.7 years |
|
Capital cost (“Capex”) (including a contingency of $31.96 million) |
US$155.8 million |
|
Operating Costs FOB (“Opex”) (per tonne of concentrate following ramp-up) (7) |
US$479.03 |
|
Average sale price of SuperFlake® concentrate (US$/tonne) (8) |
US$1,231 |
|
Operational Highlights |
|
|
Average material mined per annum over LOM |
2,532,345 |
|
Average Head Grade |
6.16% |
|
Concentrate purity (CG) of finished product |
97% |
|
Average Stripping ratio over LOM |
0.8:1 |
|
Average carbon recovery |
88.30% |
I will not be using this PEA within my valuation of the company as it is too soon to tell how likely the company will go through with this plan. Regardless, some of the information is important to take into account, for example, the $1,231 assumed price of graphite.
NextSource Material’s Valuation
NextSource has no free cash flow, so it is impossible to value the company on a DCF-basis like Newmont and Nucor.
I decided to project the potential sales of the company based on management’s production guidance and assign a 3x sales multiple. Below you can find my valuation.
Valuation Conducted by author using own calculations
*As part of my valuation, I have not made any claims that the expansion/phase II of the project will be approved or be in commission. Valuation for the NextSource materials indicates that the company is extremely undervalued.
Walking you through my valuation, I have assumed that the company produces 17,000 tonnes of graphite each year over the first two years. I then assume the company produces 45,000 over the useful life of the mine (28 years). After summing the total tonnes of graphite the company could produce over that time period, I get to a total of 1.26M of graphite. In the company’s PEA for its expansion of the mine, NextSource assumed a $1,231 average spot price per tonne of graphite. So, 1.26M*$1,231=1.593B of potential sales. I then put a 3x multiple onto that (extremely conservative) and obtain a fair value for the company of $4,448B. After dividing this by all of the shares outstanding I get a fair share price of $37.53. I am confident this stock is a 10-bagger.
NextSource Materials Balance Sheet
Because NextSource is a pre-revenue company that has yet to operate, it is hard to fault the company for having a lackluster balance sheet. Below are some of its metrics.
Seeking Alpha Financials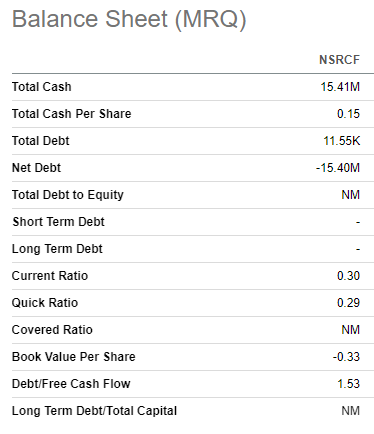
The company has a total $15.41M of cash, very little debt, and has a low current/quick ratio due to option warrants it owes.
NSRCF Annual Report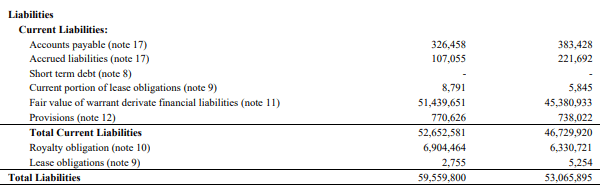
As you can see, the company has $51.439M in warrants it owes. Despite this, I don’t see any particular issue with the company’s financials given its current financial standing.
Conclusion
While there are many ways to play the impending commodity supercyle, Nucor, Newmont, and NextSource Materials are my three favorites. Among the three, Nucor and Newmont are larger, more steady names and NextSource is higher risk/reward. No matter what your risk tolerance, I advocate investors get interested in these companies due to their cheap valuations at current prices and my outlook: that commodity prices (particularly metals) will continue rising in price and demand will be sustained. I assert a ‘strong buy’ on all three companies.
Be the first to comment