

adaask/iStock via Getty Images
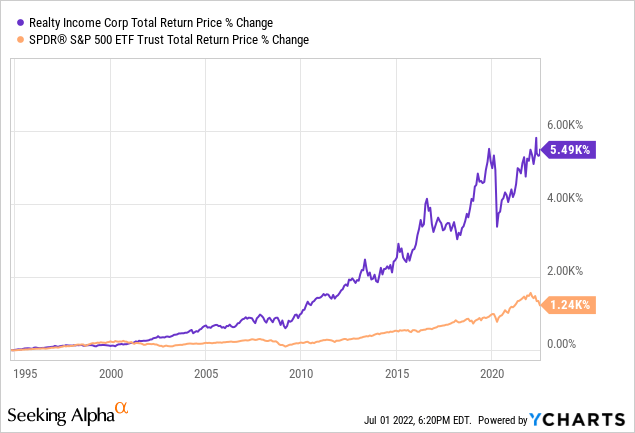
With a trademarked name like “The Monthly Dividend Company” Realty Income (NYSE:O) projects an image of consistent, reliable passive income that enables investors to sleep well at night. With an A- credit rating from S&P and an A3 credit rating from Moody’s, over 53 years of impressive operating performance, 27 consecutive years of rising dividends, 98 consecutive quarterly dividend increases, nearly 1,100 clients across 11,288 properties and 70 industries, and a track record of delivering market-crushing returns, we are not going to disagree with nor attempt to tarnish that image. The results speak for themselves:
That said, despite its stellar reputation, we do not believe that O is the best buy in the triple net lease space today. While there are several triple net lease REITs that we prefer to O at the moment, one which we will discuss today is Spirit Realty Capital (NYSE:SRC). In this article, we will share three reasons why we believe that investors would be better served by investing in SRC than O right now.
#1. SRC Stock Is Vastly Cheaper Than O Stock
First and foremost, SRC is significantly cheaper than O. No matter what metric you look at – dividend yield, EV/EBITDA, P/NAV, P/FFO, or P/AFFO – SRC is clearly cheaper than O is:
| SRC | O | |
| Dividend Yield | 6.9% | 4.3% |
| EV/EBITDA | 13.27x | 18.70x |
| P/NAV | 0.84x | 1.20x |
| P/FFO | 10.33x | 17.03x |
| P/AFFO | 10.65x | 17.40x |
These metrics are not even remotely close to each other. SRC is priced like it is a junk-rated, externally-managed REIT that is on the verge of cutting its dividend and/or severely diluting its shareholders due to conflicts of interest, while O is priced like the premier, gold-standard triple net lease REIT that it is. However, as we will show you in the next two points, SRC is actually a pretty great triple net lease REIT in its own rights and not nearly as inferior to O as its valuation seems to suggest here.
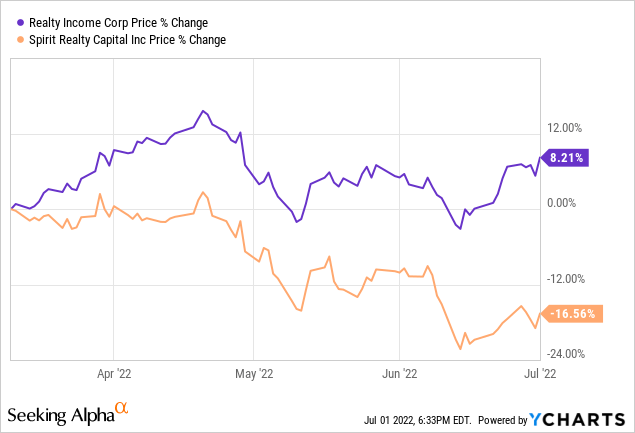
In particular, we will be comparing these REITs through the prism of their ability to withstand and continue growing through a recession given that this is what seems to be the growing consensus of the market at the moment and a sizable portion of the valuation gap between O and SRC has come in recent months as frets over a recession have heated up:
#2. SRC Has Arguably As Good Of A Portfolio & Balance Sheet As O’s
O has one of the top credit ratings in REITdom, plenty of liquidity, relatively low leverage, and a well-laddered debt maturity ladder. When you take into consideration its incredible diversification across its nearly 11,300 properties and 43% rental revenue from investment grade tenants, it is hard to beat the safety and stability provided by O.
That said, SRC does pretty well for itself too with a well-diversified portfolio of well over 2,000 properties. First of all, management prides itself on its proprietary methodology for underwriting its leases that it believes will yield superior risk-adjusted performance over time:
SRC Underwriting (Investor Presentation)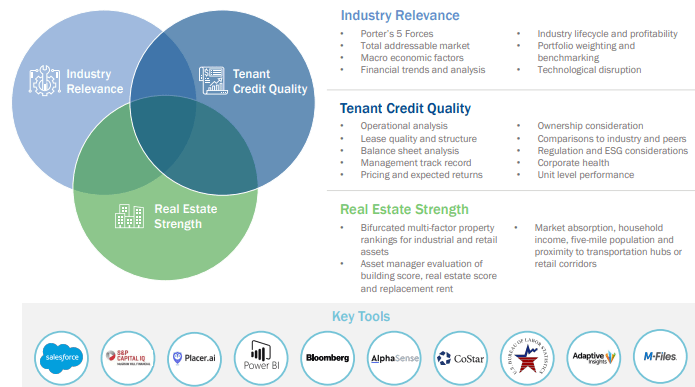
On top of that, as a fairly young triple net lease REIT, SRC’s portfolio is increasingly being filled with lengthy leases as 31% of its total real estate investments have been made since 2019. A whopping 44.1% of these acquisitions have been in the industrial space as well, implying that SRC is going after more in-favor assets as opposed to the more out-of-favor and potentially riskier retail properties that O fills its portfolio with.
SRC also saw impressive results through the COVID-19 headwinds with only 0.06% in lost rent during that period and unreimbursed property costs of 1.4%. Furthermore, the REIT maintained occupancy of above 99% throughout COVID-19, which is remarkably high. SRC’s credit rating – while certainly not as impressive as O’s – is still quite solid at BBB.
Last, but not least, SRC’s portfolio breakdown measures up pretty well against O’s, with better tenant diversification despite having far fewer properties, meaningfully better industrial exposure and less retail exposure that is complemented by some very defensive data center and medical property assets, longer weighted average lease terms, better occupancy, and superior same store sales growth. The only area in which it falls short of O is the number of investment grade tenants. However, its superior numbers elsewhere help to offset this deficiency and – while time will tell – its proprietary underwriting methodology could help make up for this gap as well.
| Metric | O | SRC |
| Top 10 Tenant ABR Concentration | 29.1% | 21.3% |
| Top 20 Tenant ABR Concentration | 42.8% | 35% |
| Industrial Exposure | 14.4% | 19.8% |
| Retail Exposure | 83% | 70% |
| IG Rated Tenants | 43% | 22.2% |
| Weighted Average Lease Term | 8.9 Yrs | 10.4 Yrs |
| Occupancy | 98.5% | 99.8% |
| Forward Same Store Sales Growth | 1.0% | 2.1% |
| ABR From Texas, Ohio, Georgia & Florida | 24.2% | 33% |
| ABR From California & Illinois | 11.4% | 7.7% |
Note: Bold indicates the more favorable metric
On top of that, its balance sheet holds its own quite well too:
| Metric | O | SRC |
| Weighted Average Debt Maturity | 6.4 | 6.7 |
| Unsecured Debt/Total Debt | 93.0% | 99.8% |
| Adjusted Debt/Adjusted EBITAre | 5.3x | 5.2x |
| Fixed Charge Coverage | 5.6x | 5.8x |
| Weighted Average Interest Rate | 3.12% | 2.92% |
| Dividend AFFO Payout Ratio | 76.0% | 71.9% |
Note: Bold indicates the more favorable metric
While it is true that O has vastly superior scale and track record – not to mention a superior investment grade tenant profile – which combine to earn it a superior credit rating, a compelling case can be made that SRC’s portfolio and balance sheet are just as good at the fundamental level. Over time as they build a track record, SRC could very well see its credit rating catch O’s without having to improve its portfolio or balance sheet metrics much at all.
#3. Both Have Solid Growth Prospects
With SRC offering a much better value proposition, a 260 basis points superior yield, a lower payout ratio, and arguably just as sound of a portfolio and balance sheet (or at least close to it), you would think that O would have vastly superior growth potential, right? Wrong.
First of all, SRC enjoys a superior forward organic same store revenue growth rate of 2.1% compared to 1.0% for O which bodes well for its long-term relative growth rate. On top of that, its leases have longer weighted average durations and SRC has meaningfully fewer leases expiring over the next several years which should insulate it better against downside from a potential recession.
Both REITs are expected to generate high single digit AFFO/share growth this year, though O is expected to slightly edge out SRC with an 8.6% expected growth rate compared to SRC’s expected 7.2% growth rate at the midpoint of guidance. However, O’s growth rate could be higher than normal this year due to it enjoying the benefits of the massive VREIT acquisition. We expect moving forward that SRC will likely have an easier time generating needle moving growth as O grapples with the law of large numbers as it tries to balance growth acquisitions with prudent underwriting.
Investor Takeaway
As the famous Warren Buffett-ism goes:
Price is what you pay, value is what you get.
With a share of O, you get a slice of a very valuable and well-managed real estate portfolio. However, you pay top dollar for it. With SRC, meanwhile, you also get a high quality portfolio that is well on its way to attaining premier status, but in this case the cost of ownership is a compelling bargain. As a result, we believe investors would be prudent to purchase SRC after its recent unwarranted pullback instead of continuing to allocate capital to O, which – despite rising interest rates – is not selling at a particular bargain.
SRC promises vastly superior passive income and much greater multiple expansion potential with only slightly more risk (and potentially no extra depending on what you emphasize in a portfolio and balance sheet). The growth outlook is slightly better for O due to its recent large acquisition, but over the long-term we expect SRC’s growth rate to be comparable if not superior as well.
Be the first to comment