

sefa ozel
The Office REIT sector has a bad hangover from the COVID pandemic, in the form of the WFH (work from home) trend. During the lockdown, people and companies discovered that the technological tools now available allow employees to work productively from home. Many of those workers are reluctant to give up that convenience, particularly those who live in areas where commutes are longest. As a result, demand for office space has weakened, resulting in a supply glut for the foreseeable future. As Hoya Capital states,
We expect a 15-20% decline in office space per employee by the end of 2030 as many corporate tenants in low-utilization markets significantly reduce their footprint.
The glut of office space has created a flight to quality, benefitting Class A properties, as companies downsize footprint and use their bargaining power to extract concessions and upgrades from landlords. Meanwhile, Sunbelt and suburban markets are showing gains in occupancy, particularly those with net population growth and relatively short average commute times. The lack of a commute is far and away the top benefit of working from home, according to WFH Research.
Hoya Capital Income Builder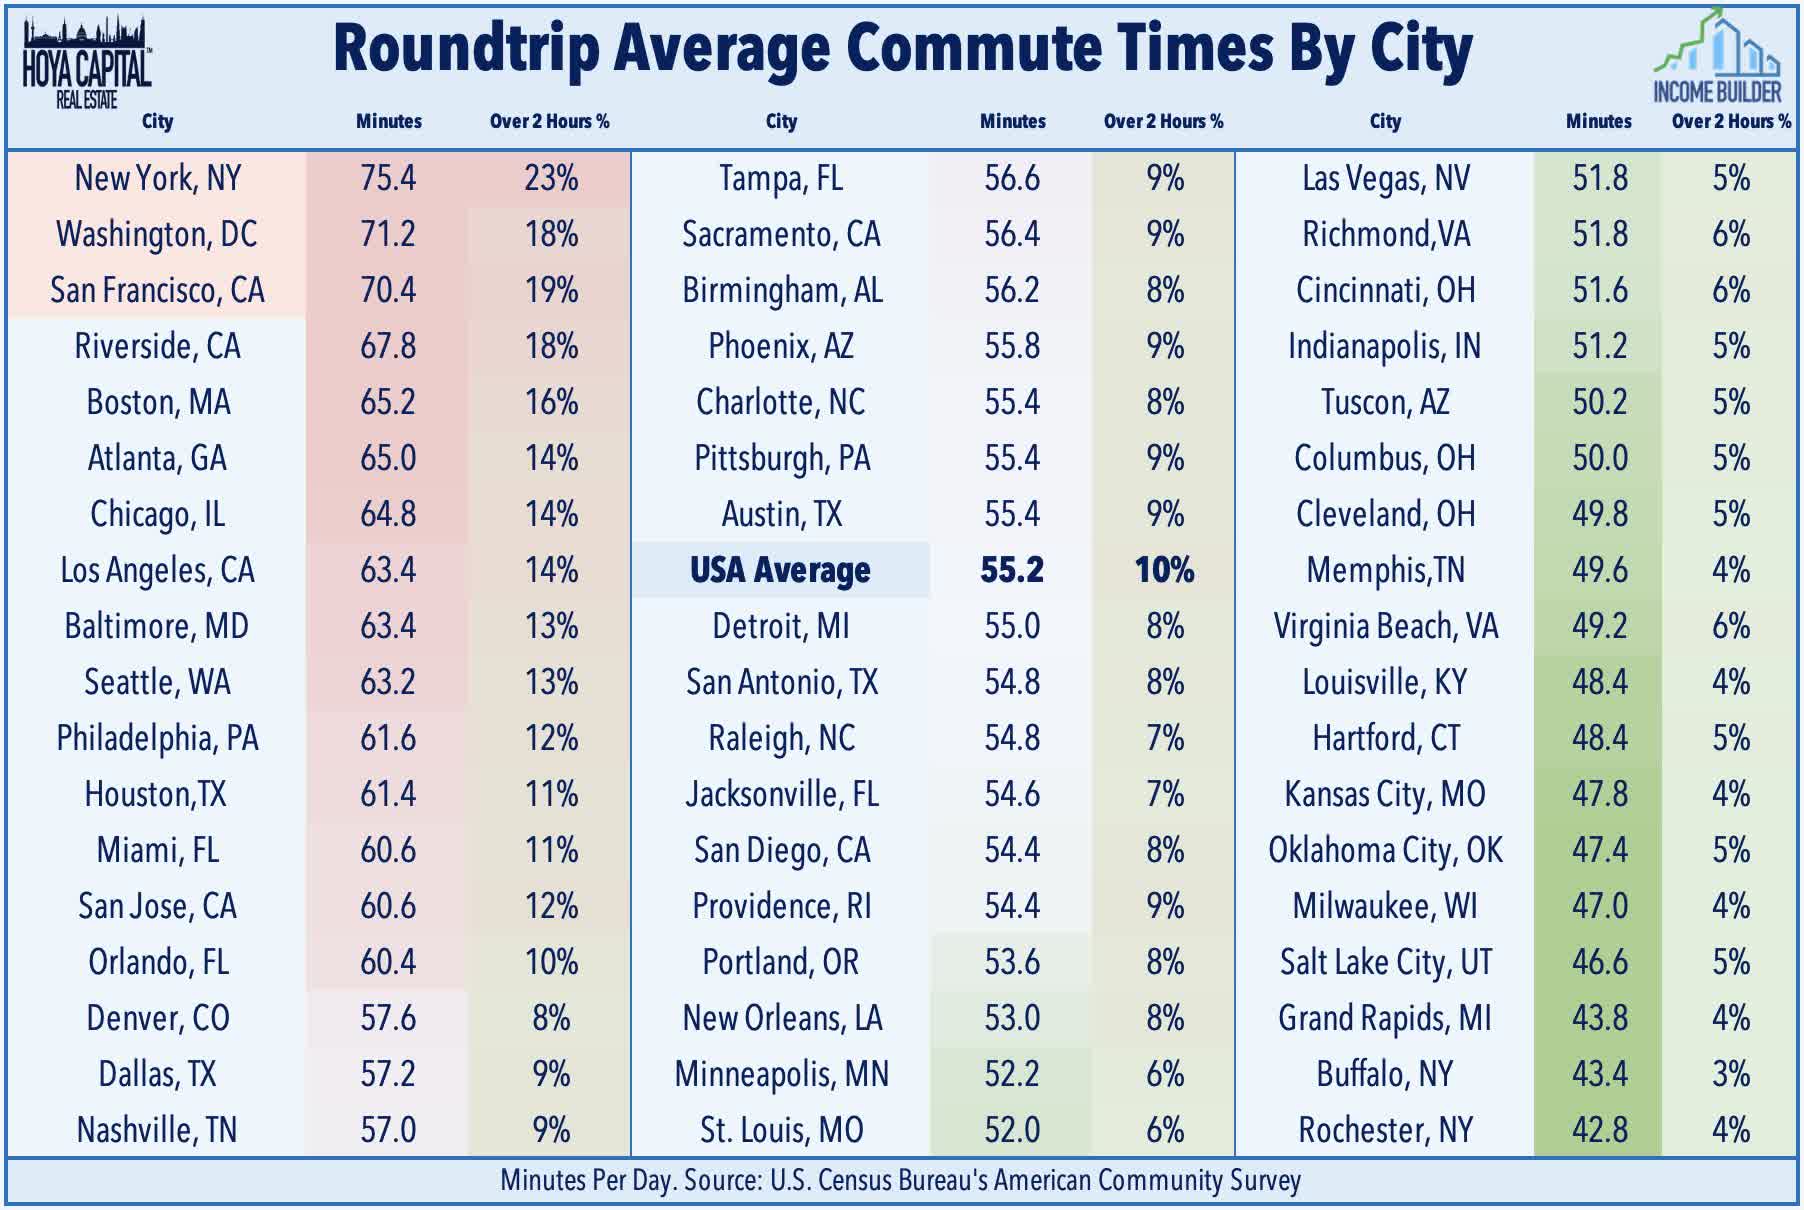
According to Hoya,
Sunbelt and secondary markets . . . have seen far higher utilization rates throughout the pandemic with Austin, Houston, and Dallas recovering to around 60% while rates are closer to 75% in . . . Raleigh, Charlotte, Atlanta, and Phoenix.
Hoya Capital Income Builder
There are signs that Office REITs may be oversold.
- Office REITs currently trade at an average discount of 25-35% to NAV (Net Asset Value).
- Guidance hikes outpaced reductions 6 to 1 in Q3.
- Lab space is still in high demand, benefitting REITs with this type of asset.
- Leasing spreads are still positive, at 4.6% on average, which is double their 2021 nadir of 2.3%.
Hoya Capital Income Builder
For value investors interested in initiating or increasing exposure to Office REITs, this article spotlights three companies with strong balance sheets, fat and safe yields, low prices, and decent growth prospects.
Highwoods Properties (HIW)
Highwoods Properties, Inc.
Headquartered in Raleigh, North Carolina, and founded in 1978, Highwoods owns and manages over 27 million square feet of office buildings in high-dollar business districts, primarily in the Southeastern U.S., including Raleigh, Atlanta, Nashville, Charlotte, Orlando, Pittsburgh, Richmond, and Tampa. Occupancy as of Q3 is 91.4%. The average HIW building is 20 years old.
HIW derives 85% of its NOI (net operating income) from the top 10 real estate markets, as identified by the Urban Land Institute.
Highwoods investor presentation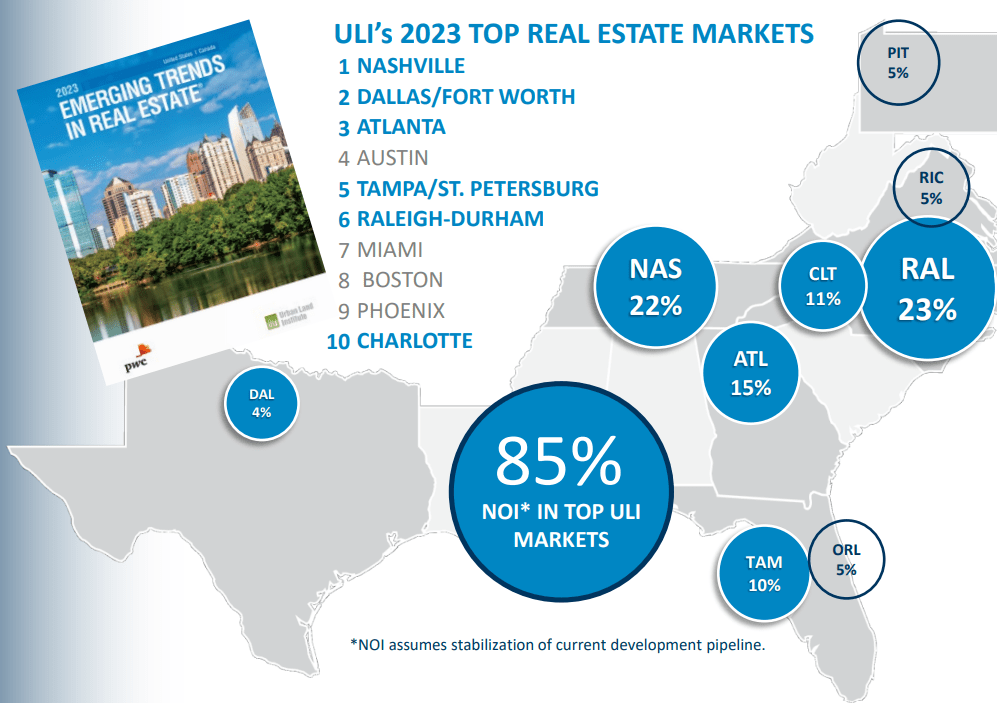
Thanks to its fortuitous positioning, HIW net effective rents have recovered to their pre-pandemic peak.
Highwoods investor presentation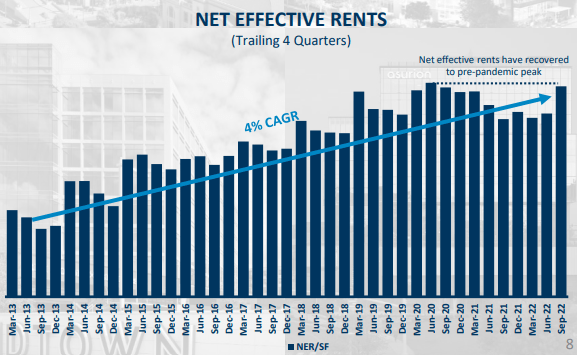
HIW sold about $500 million worth of property in 2020, but has become a net acquirer over the past two years. The company also has $917 million worth of development in progress, totaling 1.6 msf (million square feet).
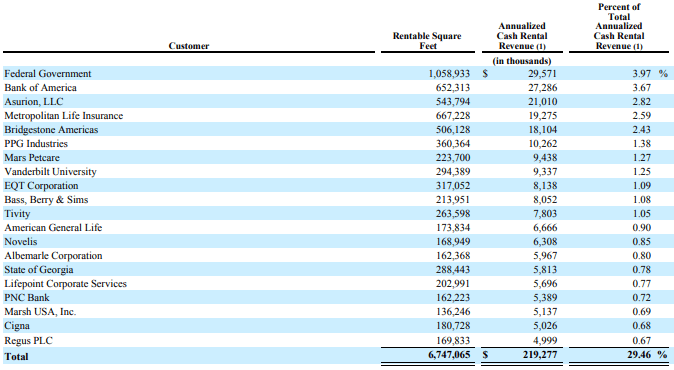
Highwoods investor presentation The company’s top 20 tenants account for less than 30% of ABR (annual base rent), and the top tenant (the federal government) accounts for about 4%. Highwoods Properties 10-K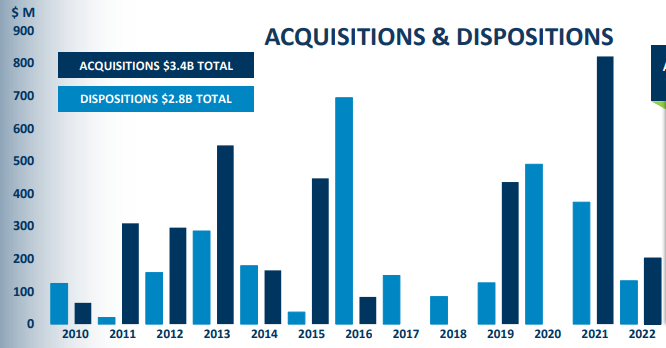
Results for Q3 2022 showed:
- FFO per share of $1.04, up 8.3% YoY (year over year).
- Revenues of $207 million, up 5.9% YoY.
- An increase of just 0.8% in the share count over the past 12 months, indicating that HIW is financing its new development without diluting shareholder value.
- Cash from operations of $320 million for the first 9 months of this year, up 3.4% YoY.
HIW Growth
Remarkably, despite the pandemic, HIW has steadily grown FFO and FFO/share at high single digit rates for the past 3 years. Both are now at their highest levels ever.
| Metric | 2019 | 2020 | 2021 | 2022* | 3-year CAGR |
| FFO (millions) | $355 | $382 | $413 | $440 | — |
| FFO Growth % | — | 7.6 | 8.1 | 6.5 | 7.4% |
| FFO per share | $3.33 | $3.58 | $3.86 | $4.01 | — |
| FFO per share growth % | — | 7.5 | 7.8 | 3.9 | 6.4% |
| TCFO (millions) | $366 | $358 | $415 | $427 | — |
| TCFO Growth % | — | (-2.2) | 15.9 | 2.9 |
*Projected, based on Q3 2022 results
HIW Balance sheet
Highwoods’ investment-grade balance sheet is solid across the board, with slightly better liquidity and lower debt than the average Office REIT.
| Company | Liquidity Ratio | Debt Ratio | Debt/EBITDA | Bond Rating |
| HIW | 1.79 | 37% | 6.1 | BBB |
Source: Hoya Capital Income Builder, TD Ameritrade, and author calculations
The company’s debt carries a weighted average interest rate of 3.7%, with absolutely no maturities until 2025, thereafter building to a peak of $500 million in 2029.
Highwoods investor presentation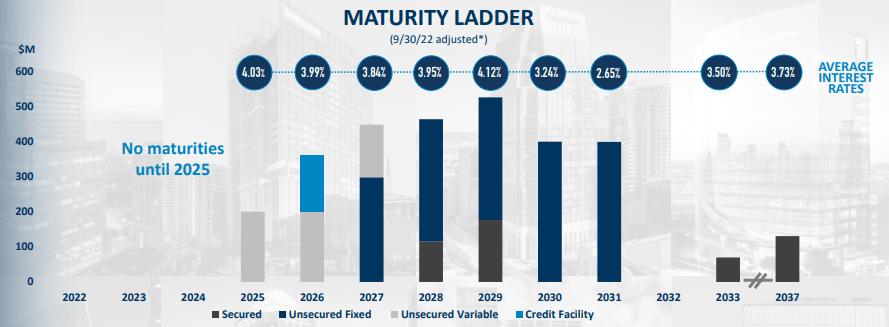
HIW Dividends
HIW has maintained or increased its dividend for 19 consecutive years, even raising their dividend during the pandemic. The yield is an inflation-neutralizing 7.19%, and the Dividend Score is well above average.
| Company | Div. Yield | 3-yr Div. Growth | Div. Score | Payout | Div. Safety |
| HIW | 7.19% | 1.7% | 7.57% | 50% | B+ |
Source: Hoya Capital Income Builder, TD Ameritrade, Seeking Alpha Premium
Dividend Score projects the Yield three years from now, on shares bought today, assuming the Dividend Growth rate remains unchanged.
HIW Valuation
HIW is selling for a low 6.8x FFO ’22, and an even bigger discount to NAV than the average Office REIT.
| Company | Div. Score | Price/FFO ’22 | Premium to NAV |
| HIW | 7.57% | 6.8 | (-31.4)% |
Source: Hoya Capital Income Builder, TD Ameritrade, and author calculations
Bottom line: HIW
Highwoods offers value investors a very safe 7.57% yield, a solid balance sheet, and stable Sunbelt revenue and cash flows unencumbered by debt maturities, all at a bargain basement price.
Cousins Properties (CUZ)
Cousins Properties
Founded in 1958 and headquartered in Atlanta, Cousins Properties owns and leases trophy-quality office space in high-dollar areas of 6 growing Sunbelt markets: Atlanta, Austin, Charlotte, Tampa, Phoenix, and Dallas. The average CUZ building is 18 years old, and 34% of the portfolio is less than 5 years old.
Cousins investor presentation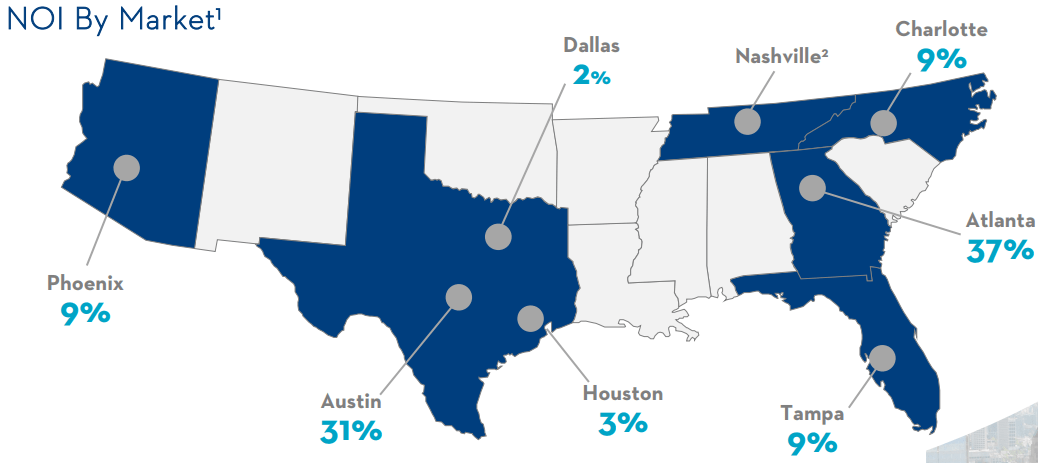
The portfolio adds up to 18.8 msf, which is currently 90.2% leased, with a development pipeline of 1.5 msf, and a land bank that will support an additional 4.6 msf.
As President and CEO Colin Connolly summed it up on the Q4 2022 earnings call:
We strive to be the preeminent Sunbelt office company… We have been executing on our Sunbelt strategy for over 10 years… The U.S. population continues to migrate to the Sunbelt in search of that lower cost and pro-business environment.
Due to the quality of their assets, Cousins is able to command better-than-average rents in each of their 6 main markets.
Cousins investor presentation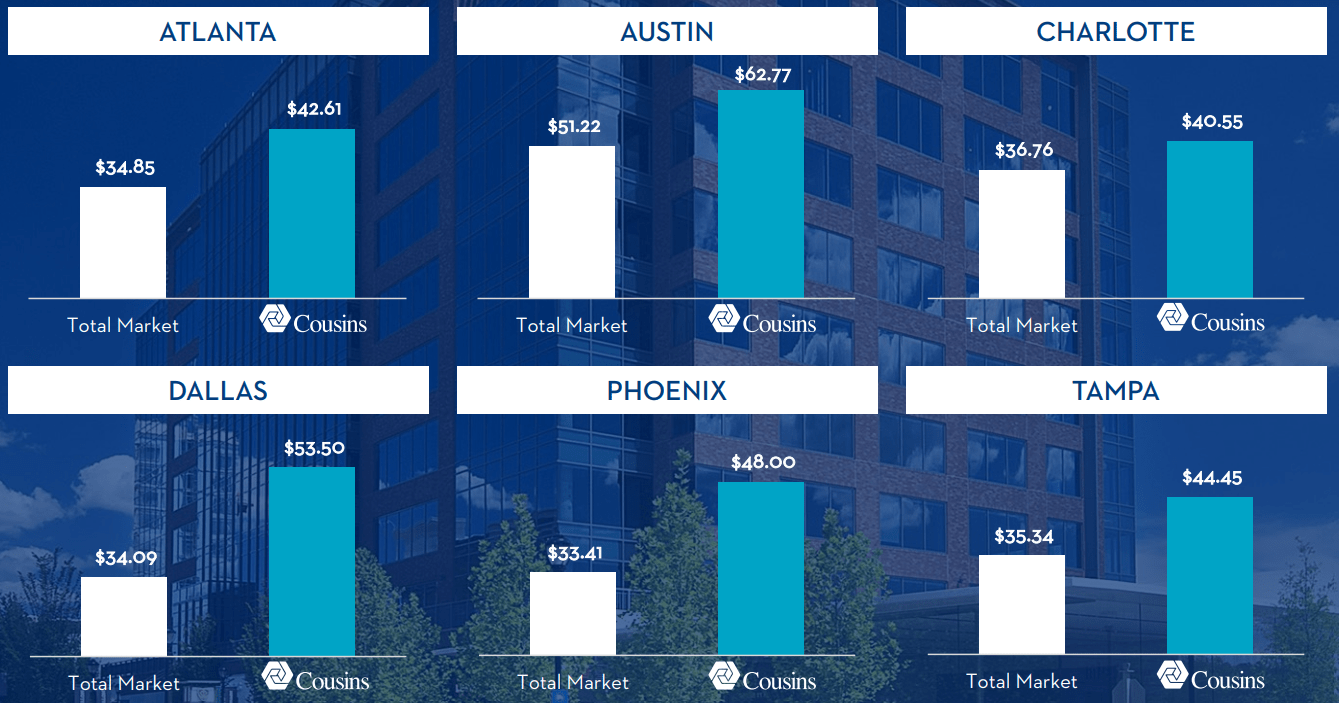
The 6 markets in which Cousins has 96% of its assets all ranked in the top 10 hottest markets for 2022, and the top 10 for projected population growth over the next 5 years, according to Zillow:
Cousins investor presentation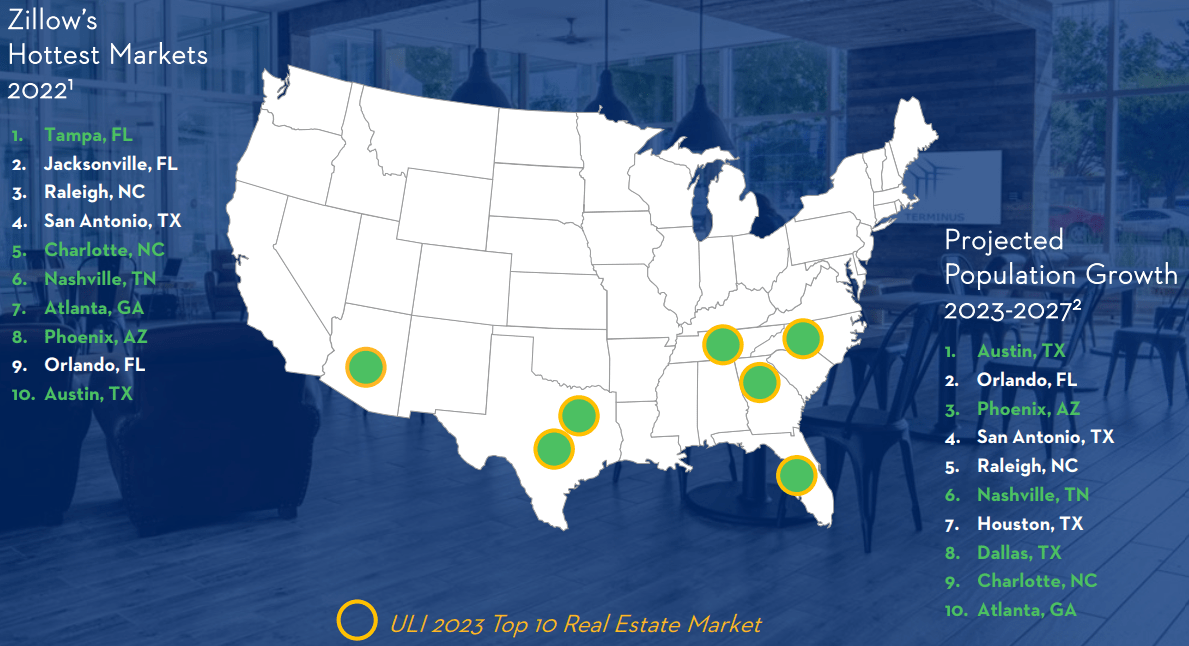
Of all Office REITs, Cousins faces the lowest percentage of lease expirations over the next 3 years.
Cousins investor presentation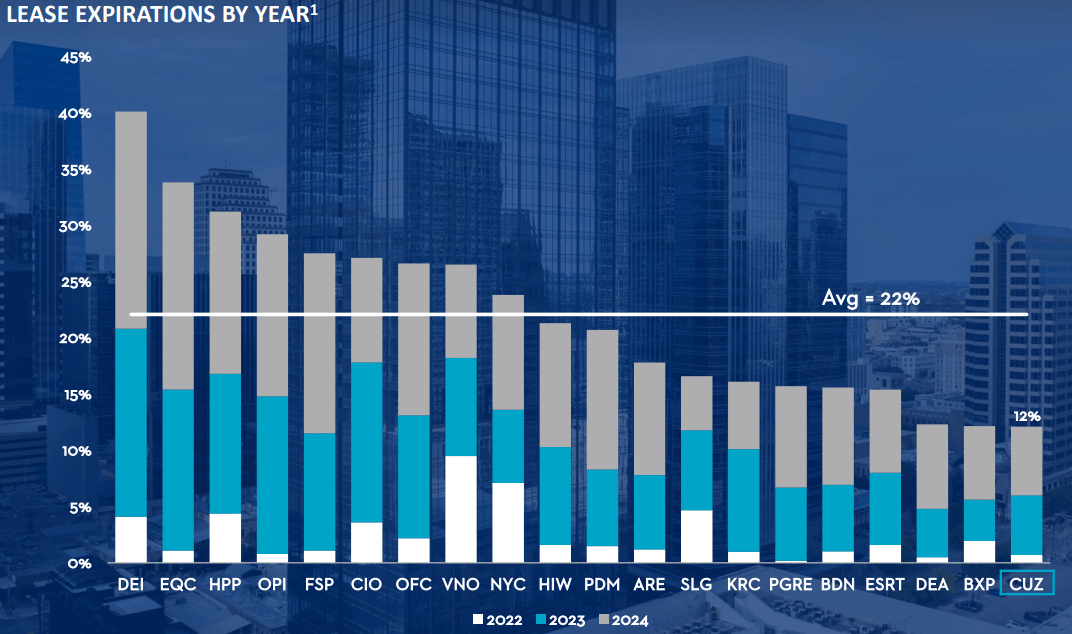
Results for Q3 show:
- Revenue of $195 million, up 3.4% YoY.
- Share count up just 1.8% YoY.
- Net income per share of $0.53, up 47%, thanks in part to profits from the sale of Cousins’ share in unconsolidated joint ventures.
- NOI of $129 million, up 4.2% YoY.
- Same-property NOI of $107 million, up 1.8% YoY.
- FFO per share of $0.69, same as Q3 2021, and up just 0.7% through the first 9 months of this year.
CUZ Growth
Cousins’ growth has come to a virtual standstill over the past two years, but the 3-year averages are all positive, because of the brisk rate at which this company was growing prior to the pandemic.
| Metric | 2019 | 2020 | 2021 | 2022* | 3-year CAGR |
| FFO (millions) | $329 | $413 | $409 | $411 | — |
| FFO Growth % | — | 25.5 | (-1.0) | 0.5 | 7.7% |
| FFO per share | $2.53 | $2.78 | $2.75 | $2.71 | — |
| FFO per share growth % | — | 9.9 | (-1.1) | (-1.5) | 2.3% |
| TCFO (millions) | $303 | $351 | $389 | $363 | — |
| TCFO Growth % | — | 15.8 | 10.8 | (-6.7) | 6.2% |
*Projected, based on Q3 2022 results
CUZ Balance sheet
Cousins maintains a superb, all-weather balance sheet with outstanding liquidity and low debt.
| Company | Liquidity Ratio | Debt Ratio | Debt/EBITDA | Bond Rating |
| CUZ | 2.65 | 27% | 4.9 | — |
Source: Hoya Capital Income Builder, TD Ameritrade, and author calculations
The company’s near-term debt maturities are far below the Office REIT average, as shown below.
Cousins investor presentation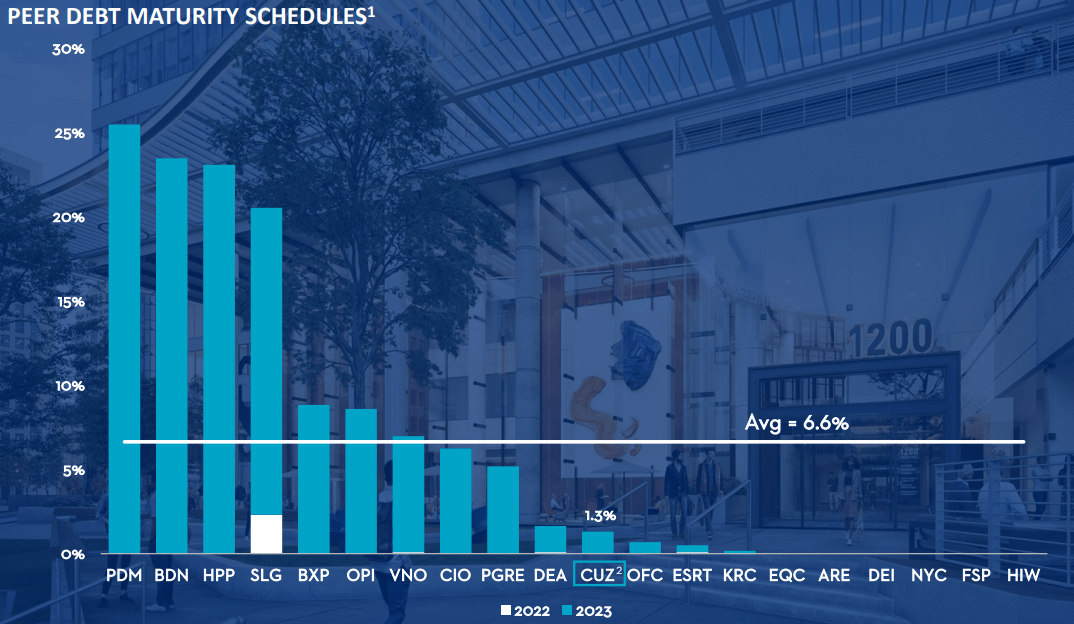
Here are the details on the company’s $2.3 billion debt:
Cousins 10-Q for Q3 2022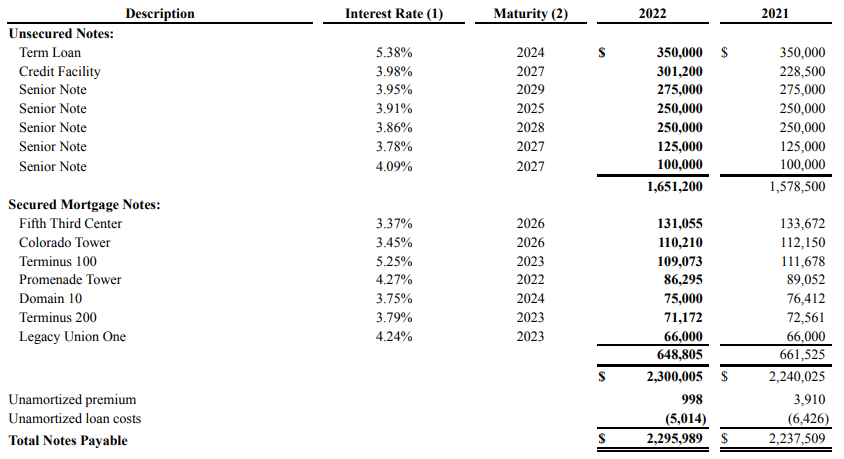
CUZ Dividends
Cousins’ yield of 5.17% and Dividend Score of 5.70% are well above the REIT average, and Seeking Alpha Premium rates the dividend an ultra-safe A.
| Company | Div. Yield | 3-yr Div. Growth | Div. Score | Payout | Div. Safety |
| CUZ | 5.17% | 3.3% | 5.70% | 50% | A |
Source: Hoya Capital Income Builder, TD Ameritrade, Seeking Alpha Premium
CUZ Valuation
Cousins is selling below both the REIT and the Office averages at 9.1x FFO ’22
| Company | Div. Score | Price/FFO ’22 | Premium to NAV |
| CUZ | 5.70% | 9.1 | (-20.1)% |
Source: Hoya Capital Income Builder, TD Ameritrade, and author calculations
Bottom line: CUZ
Cousins offers an ultra-safe 5%+ yield that is well above average, with a superb balance sheet and stable Sunbelt revenue and cash flows relatively unencumbered by debt payments, all at an attractive price.
Kilroy Realty (KRC)
Founded by John B. Kilroy in 1947 and headquartered in Los Angeles, Kilroy Realty became a REIT in 1997. The company owns 120 Class A office properties totaling over 16 msf, enjoying 90.8% occupancy. Dispositions have slightly outpaced acquisitions in 2020 and 2021, but the company has over $1 billion in development projects underway, most of it Life Science space.
The vast majority of KRC assets are on the West Coast, but the company recently established a toehold in Austin, Texas.
Kilroy September conference presentation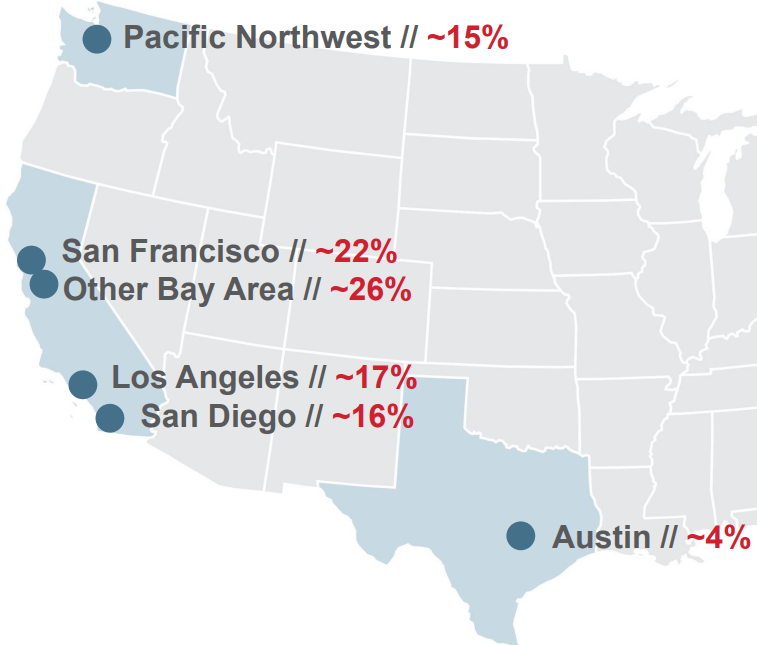
The average age of Kilroy office buildings is just 11 years, far below the Office REIT average of 34 years.
Kilroy investor presentation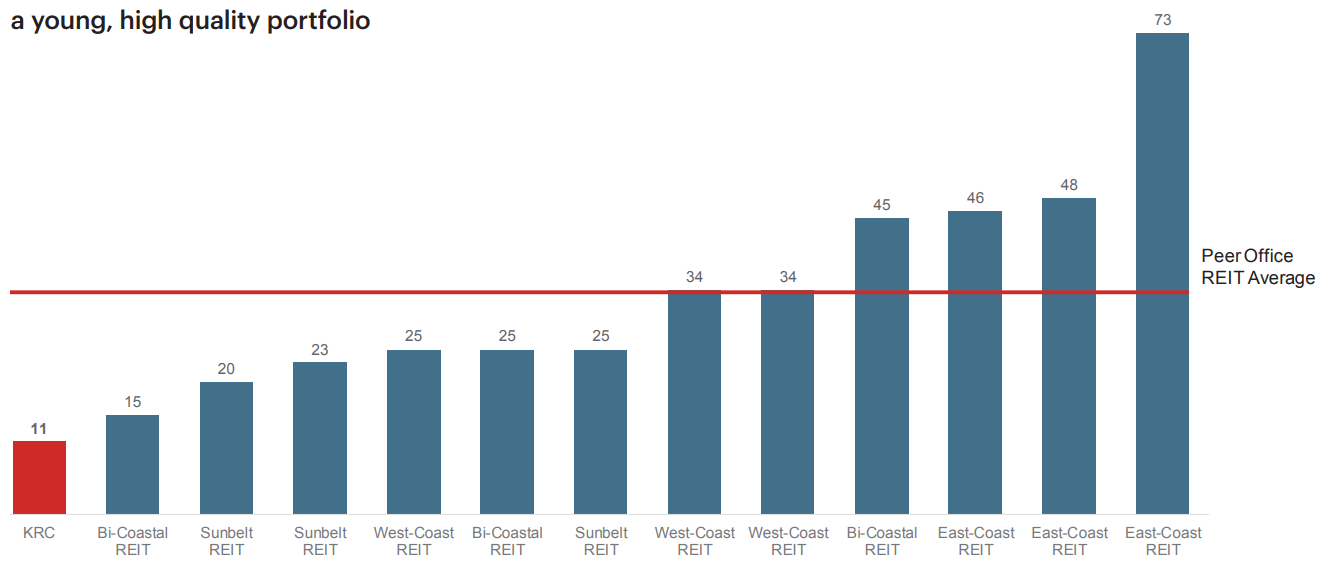
As a result, capex is only 17% of NOI, versus the REIT average of over 20%.
Kilroy investor presentation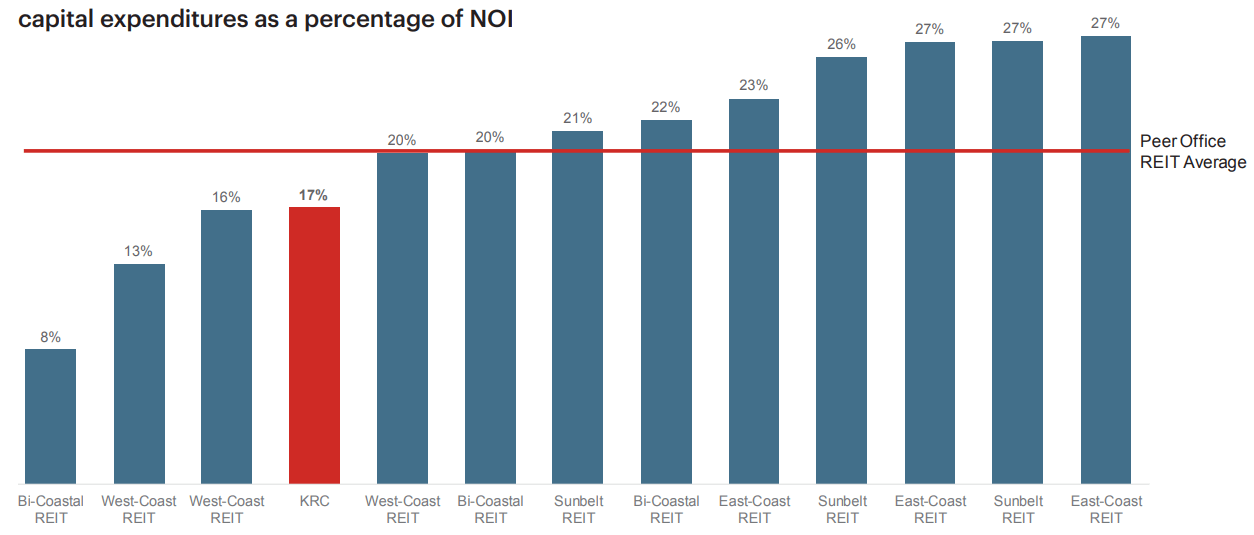
Fully 31% of KRC tenants have investment-grade balance sheets. The top 10 tenants account for only 38% of KRC’s total ABR, with the top tenant (probably Apple Inc. (AAPL)) contributing 5.1%.
Kilroy September conference presentation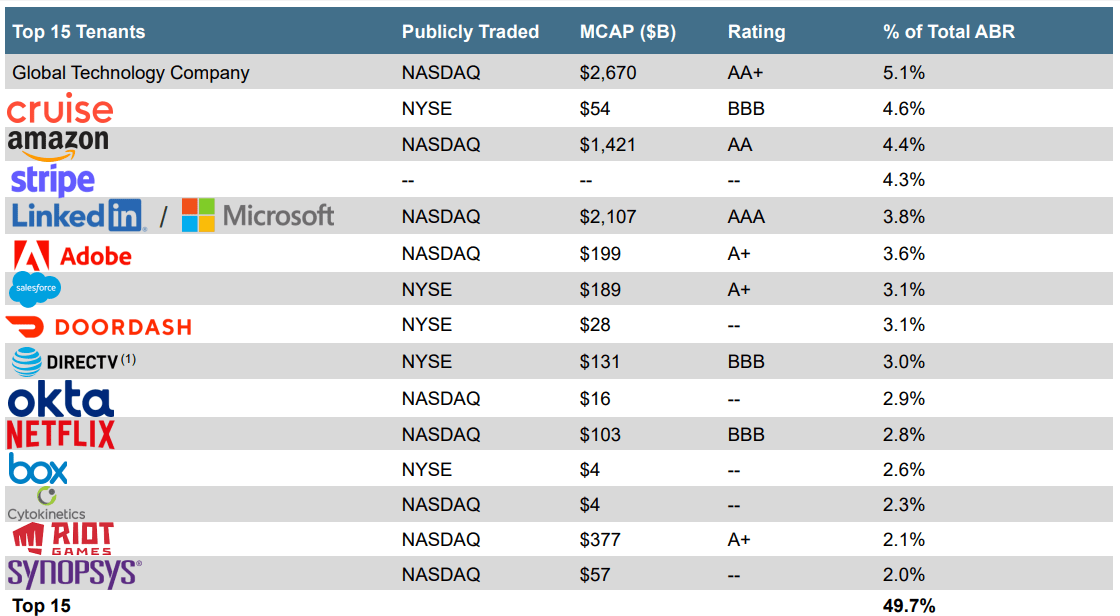
In-place rents are about 12% below market, providing a runway for revenue growth as leases expire. For life science tenants, that figure is closer to 18%.
Kilroy derives 75% of its NOI from office properties, 20% from Life Sciences facilities, and 5% from residential and retail establishments.
Kilroy investor presentation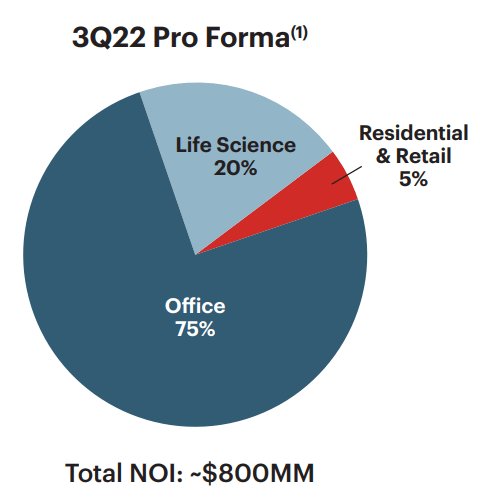
The robust ongoing demand for Life Sciences office and lab space benefits KRC, which has expanded its investment in these types of facilities by over $850 million in the past 7 years.
Total occupancy for KRC’s stabilized office portfolio is 91.3%, with the greatest struggles in the Los Angeles and San Diego markets.
KRC 10-Q for Q3 2022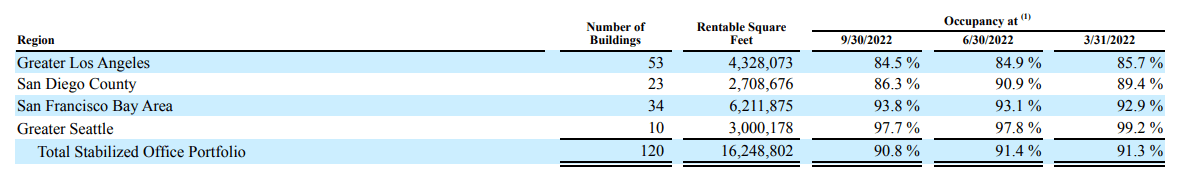
Quarterly results for KRC show:
- Revenues of $276 million, up 18.8% YoY.
- Net income of $86.7 million, up 62%, thanks largely to gains from property sales.
- Total share count up just 0.2% YoY.
- Cash from operations through the first 9 months of this year $484 million, up 18.8% YoY.
- NOI of $195 million, up 17.6% YoY.
- FFO of $140 million, up 20.4% YoY.
KRC Growth
Kilroy is enjoying a banner year, with FROG-like growth in revenue and cash flow, pulling the 3-year averages into double digits.
| Metric | 2019 | 2020 | 2021 | 2022* | 3-year CAGR |
| FFO (millions) | $418 | $433 | $462 | $556 | — |
| FFO Growth % | — | 3.6 | 6.7 | 20.3 | 10.0% |
| FFO per share | $3.91 | $3.71 | $3.89 | $4.65 | — |
| FFO per share growth % | — | (-5.1) | 4.9 | 19.5 | 6.0% |
| TCFO (millions) | $459 | $456 | $516 | $645 | — |
| TCFO Growth % | — | (-0.7) | 13.2 | 25.0 | 12.0% |
*Projected, based on Q3 2022 results
KRC Balance sheet
Kilroy’s balance sheet shows outstanding liquidity and low Debt/EBITDA, with a solid 36% debt ratio.
| Company | Liquidity Ratio | Debt Ratio | Debt/EBITDA | Bond Rating |
| KRC | 2.05 | 36% | 5.8 | BBB |
Source: Hoya Capital Income Builder, TD Ameritrade, and author calculations
Debt maturities for 2023 are extremely low, amounting to just 1.4% of the company’s $4.1 billion debt, and 63% of the debt not due until after 2027. The weighted average interest rate is 3.7%.
KRC 10-Q for Q3 2022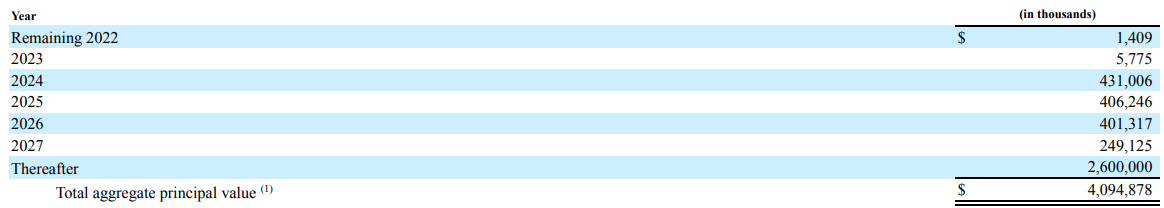
KRC Dividends
Over the past 7 years, KRC has increased its dividend by an average of 6.4% per annum, even raising its dividend during the pandemic. The well above-average yield sports an ultra-safe rating of A from Seeking Alpha Premium.
| Company | Div. Yield | 3-yr Div. Growth | Div. Score | Payout | Div. Safety |
| KRC | 5.63% | 4.7% | 6.47% | 50% | A |
Source: Hoya Capital Income Builder, TD Ameritrade, Seeking Alpha Premium
Valuation
Despite its solid growth figures, KRC sells at just 8.2x FFO ’22 and a 30% discount to NAV.
| Company | Div. Score | Price/FFO ’22 | Premium to NAV |
| KRC | 6.47% | 8.2 | (-30.3)% |
Source: Hoya Capital Income Builder, TD Ameritrade, and author calculations
Bottom line: KRC
Kilroy offers an ultra-safe yield that is well above the REIT average, with a solid balance sheet and sturdy growth metrics that stand to gain from the flight to quality and the robust demand for Life Sciences space, all at a sale-rack price.
Be the first to comment