

CreativaImages
The sector exchange-traded fund (“ETF”) performance chart reveals the severity of the market rout this year and that it could be worse.
Year-to-Date Performance of Sector ETFs (Price Action Lab Blog – Norgate Data)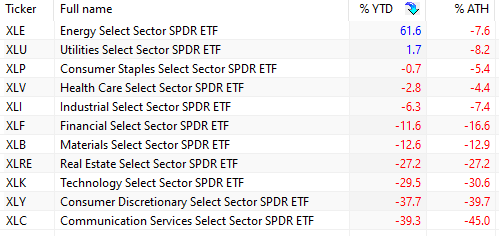
The communication services ETF (XLC) is down 39.3% year-to-date The Consumer discretionary ETF (XLY) is down 37.7% year-to-date, while the technology ETF (XLK) is down 29.5%. These losses bring back memories of the dot-com period and a bear market that lasted nearly three years.
The energy (XLE) and utilities (XLU) sectors have provided a small cushion to prevent market index collapse. However, violent shifts in energy policy could also impact the performance of these two sectors and cause a reversal.
Below is a cumulative distribution chart of the year-to-date return of Russell 1000 constituents.
Cumulative Distribution of YTD Returns of Russell 1000 Constituents – as of 12/28/2022 (Price Action Lab Blog – Norgate Data)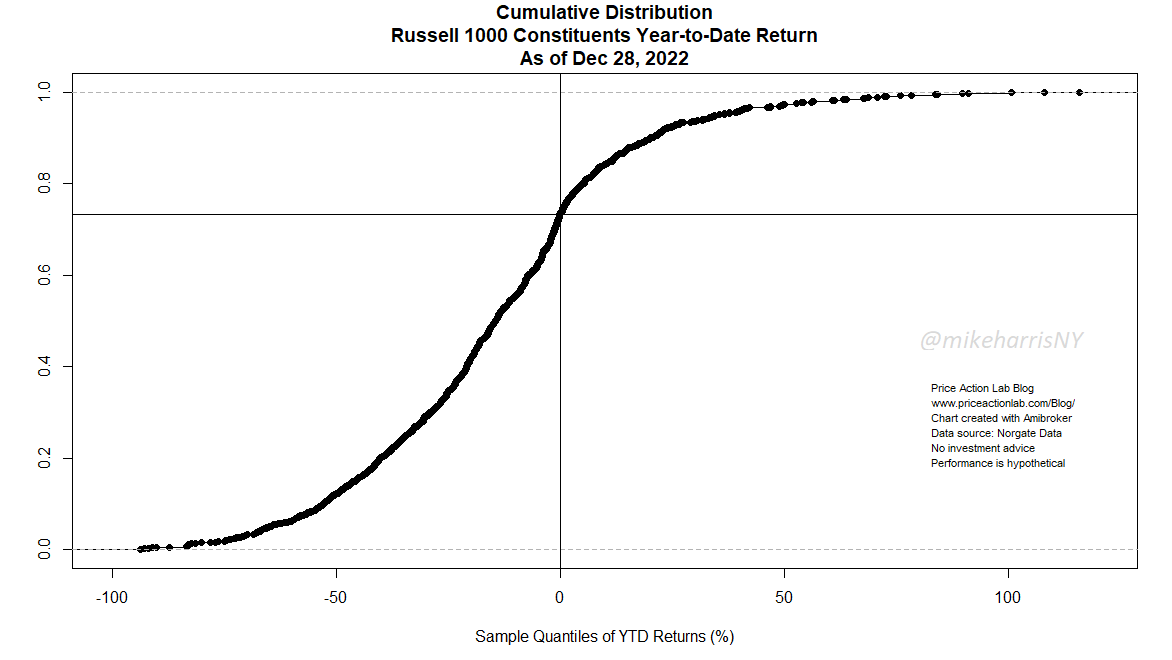
The horizontal axis is the stocks’ year-to-date return and the vertical axis shows the fraction of stocks that have lower year-to-date returns.
The horizontal and vertical lines intersect at the point on the distribution curve where the fraction of stocks with negative year-to-date returns is maximum and equal to 0.732, or 73.2%. In other words, 736 of the 1006 stocks in the Russell 1000 index are down year-to-date.
Also, note that 122 stocks, or 12.1%, are down more than 50% year-to-date.
As expected by the sector performance, the overwhelming majority of the top 20 stocks ranked by highest year-to-date return are in the energy sector.
Top 20 Russell 1000 Stocks Ranked by Highest Year-to-Date Return (Price Action Lab Blog – Norgate Data)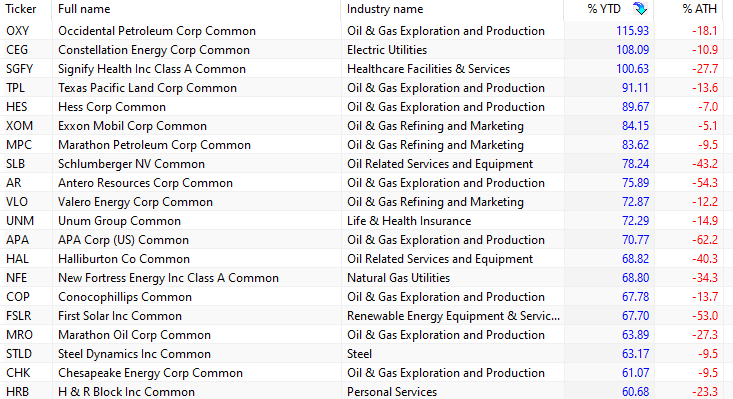
These are some of the stocks that could become the target of policies next year, and we may see a reversal in performance. “Buy the stocks that have outperformed and sell the stocks that have underperformed” may not be a good guide for next year. The right strategy depends on many factors, some of which are new and hard to analyze their impact.
What is the probability that the market will have two back-to-back down years?
Below is a yearly chart of the Dow Jones Industrials Index (DJI) from 1909.
Yearly Chart and Returns of Dow Jones Industrial Average (Price Action Lab Blog – Norgate Data)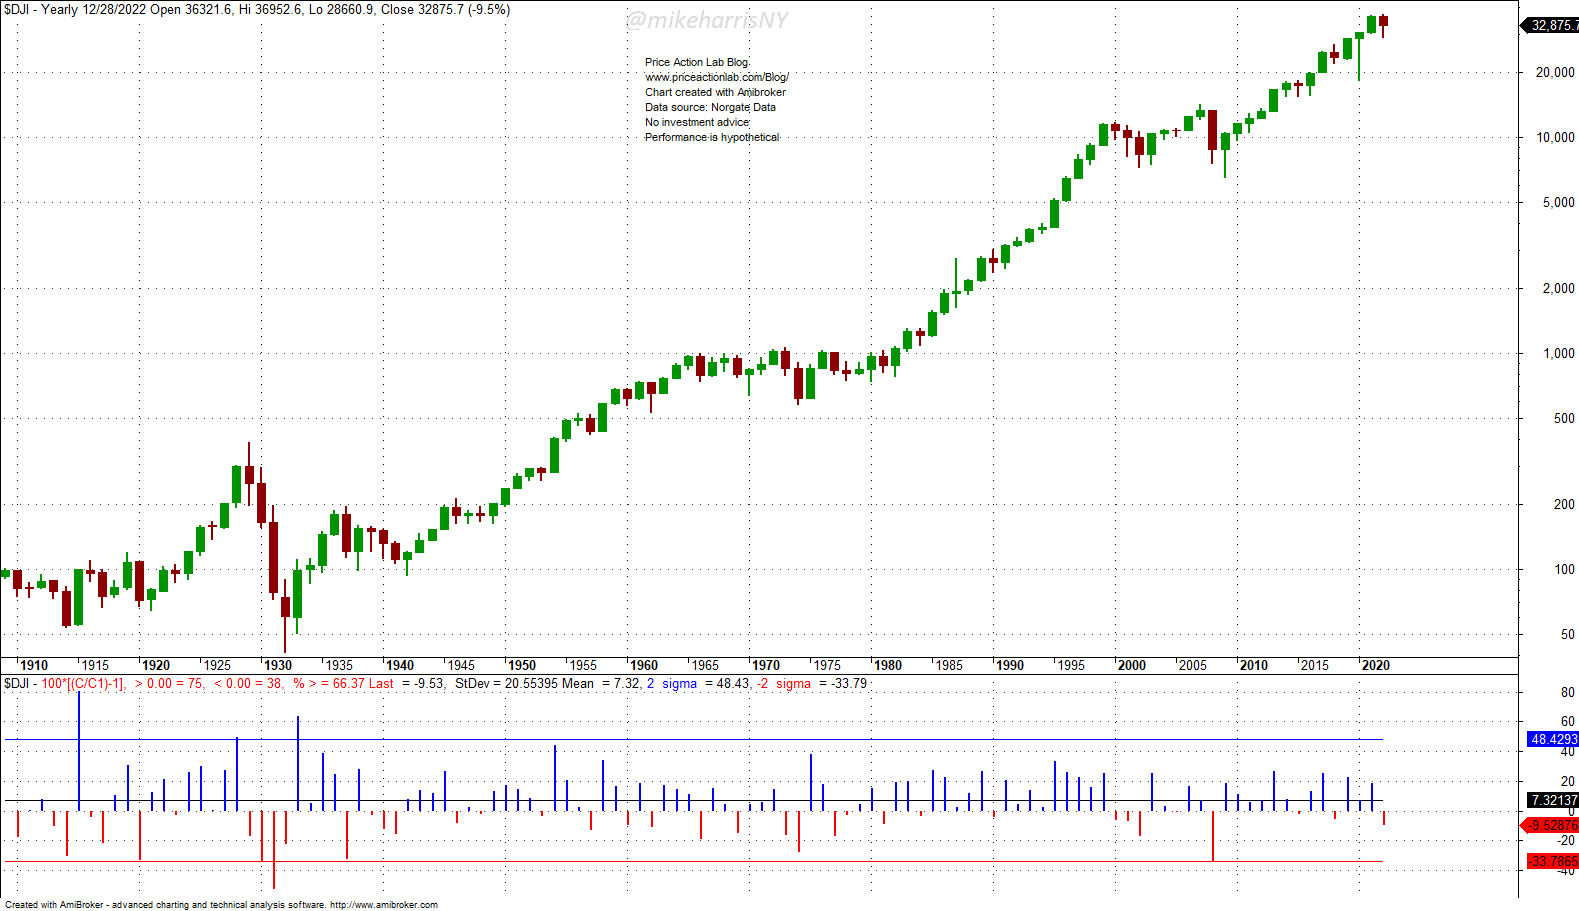
Since 1909 and on a yearly basis, the index has risen 66.37% of the time, or 75 up years and 38 down years, for a total of 113 years. In addition, the index has had 11 back-to-back down years.
A common error is to divide 11 by 113, which yields 0.097, and claim the probability of back-to-back down years is 9.7%.
The correct estimate of the probability is based on a host of assumptions about normality and sufficient samples. For more details about the formula used and calculations, see the reference at the end of the article. In a nutshell, the correct calculation is based on conditional probability and yields 28.9%.
In other words, the probability of back-to-back down years is close to 30%, and not below 10%, as the wrong calculation yields.
Conclusion
This year has posed many challenges to equity investors and especially those in the tech sector. Investors in energy stocks have benefited but there is a danger the profits may evaporate next year in case of normalization of conditions.
While 73.2% of Russell 1000 stocks are in the red year-to-date and 12% of the stocks are down more than 50%, investors are looking forward to a rebound, and are assigning a low probability to back-to-back negative years in the stocks market. However, the probability is not low, but around 30% given data since 1909. All in all, the data point to the need for careful diversification and risk management in 2023. No one can predict the market direction with high confidence. The only variables investors can adjust are those related to diversification and risk management.
Reference: Probability Of A Down Year In Stock Market After A Down Year.
Be the first to comment