

syahrir maulana/iStock via Getty Images Created by the author

Welcome (finally!) to the ninth annual review of DivGro, my portfolio of dividend growth stocks!
I’ve been swamped at work with little time to write articles, but things are letting up a bit and I’m happy to have some free time to catch up on article writing!
I created DivGro in January 2013 to create the proverbial dividend-generating machine. DivGro has grown beyond my wildest dreams and now generates dividend income of $3,277 per month, on average. That’s a tidy income stream, which I plan to reinvest until, and perhaps into, retirement.
In my annual reviews, I look at DivGro’s performance as measured by dividend income, dividend increases, annualized returns, and rate of return. I also look at some highlights of the past year and share my outlook for the coming year.
Introduction
The stock market performed very well in 2021. The S&P 500 gained 26.9% for the year, while the Dow Jones Industrial Average (DJIA) and the Nasdaq Composite gained 18.7% and 21.4%, respectively. It is only the sixth time that the S&P 500 outperformed the Dow and the Nasdaq in a year! In fact, the S&P 500 managed a record close on 68 occasions, or nearly 30% of all trading days in 2021!
Yahoo! Finance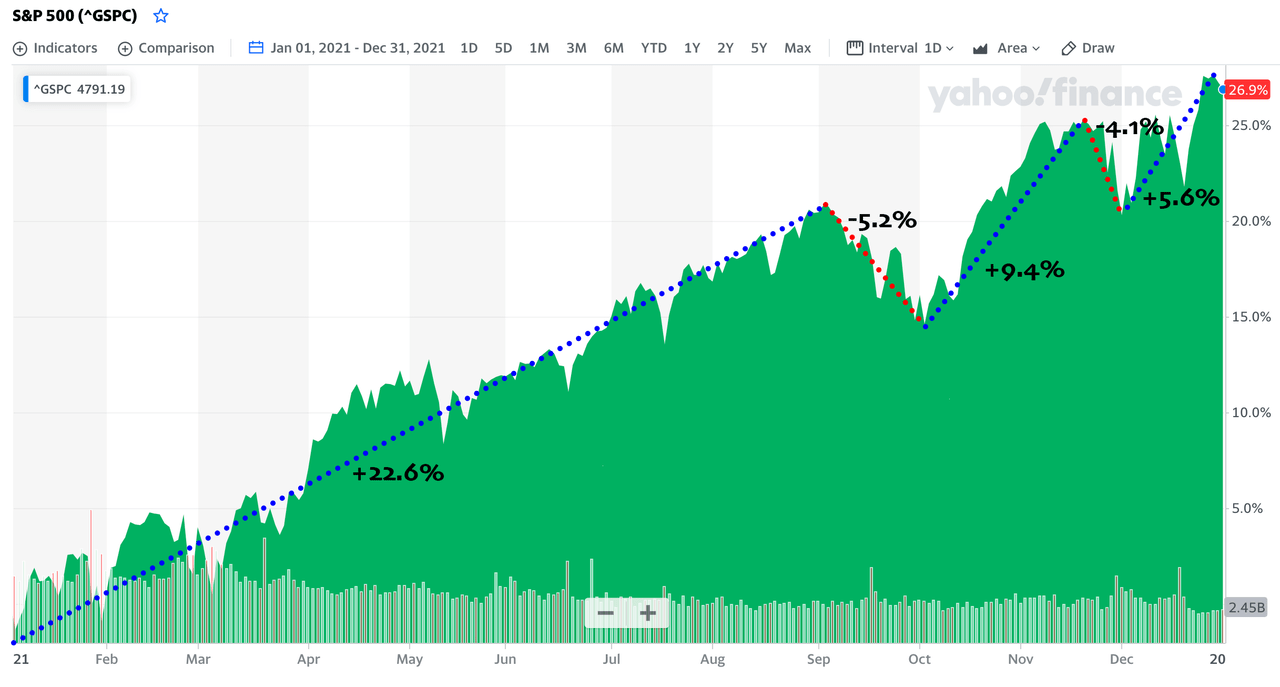
In 2021, I set out to average an initial yield on cost of 3.20% for new buys. A quick calculation indicates that I averaged 3.51%, easily achieving that goal. In 2022, I’m aiming to average an initial yield on cost of 3.60% for new buys.
Last year, I managed to increase DivGro’s projected annual dividend income (PADI) from $32,768 to $39,327. My portfolio should continue to produce significant amounts of income annually and in perpetuity. I’m hoping to reinvest all dividends for the foreseeable future and until (or even into) retirement.
This is a great position to be in and I’m thankful for the decision I made nine years ago to switch to dividend growth investing.
Let’s take a look at DivGro’s performance in 2021.
Performance
Dividend Income
The main goal of DivGro is to generate a reliable and growing dividend income stream.
In 2021, DivGro generated dividends totaling $37,716, an increase of about 26% over the 2020 total of $30,021.
Created by author from personal spreadsheet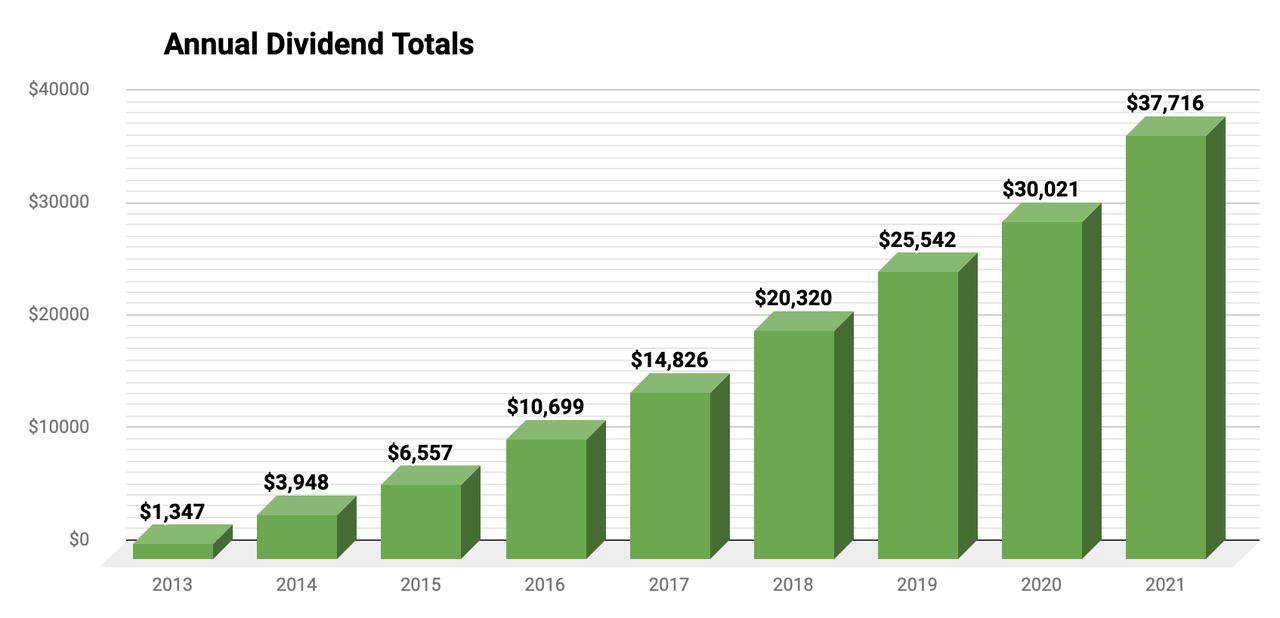
PADI increased by 20% to $39,327, meaning I can expect to earn monthly dividend income averaging at least $3,277 in perpetuity. (PADI one year ago was $32,768).
Created by author from personal spreadsheet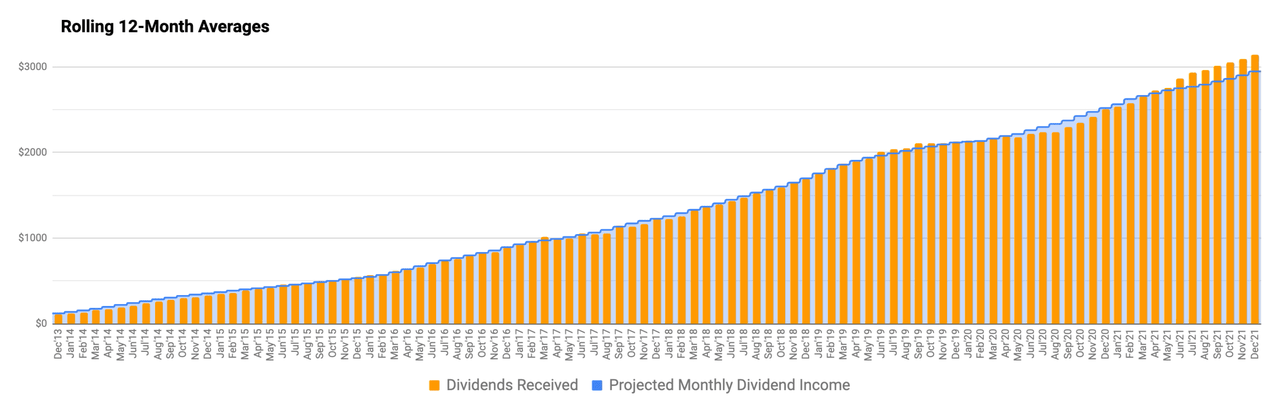
Of course, DivGro’s PADI should increase over time because I invest in dividend growth stocks and I reinvest all dividends. I’m hoping to increase PADI to $45,000 in 2022, which, if realized, would represent an increase of 20% over my 2021 goal of $37,500.
Dividend Increases
In dividend growth investing, regular dividend increases are just as important as dividend income. I use selection criteria that favor high-quality dividend growth stocks with safe dividends. In 2021, the following DivGro stocks paid or announced higher dividends:
| 1-YearIncrease |
Company |
Ticker |
Increase | Annual Div |
New YoC |
| Outsized(≥ 20%) |
Lowe’s Companies, Inc |
(LOW) |
33.33% |
3.20 |
3.46% |
|
Oracle Corporation |
(ORCL) |
33.33% |
1.28 |
2.27% |
|
|
Eaton Vance Tax-Advantaged Global Dividend Opportunities Fund |
(ETO) |
25.75% |
2.15 |
9.74% |
|
|
Aflac Incorporated |
(AFL) |
21.21% |
1.60 |
4.01% |
|
| Large(≥ 10%but< 20%) |
T. Rowe Price Group, Inc |
(TROW) |
20.00% |
4.32 |
5.82% |
|
Anthem, Inc |
(ANTM) |
18.95% |
4.52 |
1.57% |
|
|
Visa Inc |
(V) |
17.19% |
1.50 |
0.73% |
|
|
UnitedHealth Group Incorporated |
(UNH) |
16.00% |
5.80 |
2.40% |
|
|
Snap-on Incorporated |
(SNA) |
15.45% |
5.68 |
3.66% |
|
|
FedEx Corporation |
(FDX) |
15.38% |
3.00 |
2.00% |
|
|
Broadcom Inc |
(AVGO) |
13.89% |
16.40 |
6.05% |
|
|
BlackRock, Inc |
(BLK) |
13.77% |
16.52 |
4.18% |
|
|
Philip Morris International Inc |
(PM) |
13.04% |
5.00 |
5.82% |
|
|
Costco Wholesale Corporation |
(COST) |
12.86% |
3.16 |
1.16% |
|
|
Texas Instruments Incorporated |
(TXN) |
12.75% |
4.60 |
4.98% |
|
|
D.R. Horton, Inc |
(DHI) |
12.50% |
0.90 |
0.94% |
|
|
Eaton Vance Tax-Advantaged Dividend Income Fund |
(EVT) |
12.14% |
1.95 |
7.14% |
|
|
Air Products and Chemicals, Inc |
(APD) |
11.94% |
6.00 |
3.80% |
|
|
Automatic Data Processing, Inc |
(ADP) |
11.83% |
4.16 |
2.70% |
|
|
Mastercard Incorporated |
(MA) |
11.36% |
1.96 |
0.60% |
|
|
JPMorgan Chase & Co |
(JPM) |
11.11% |
4.00 |
2.87% |
|
|
NIKE, Inc |
(NKE) |
10.91% |
1.22 |
1.49% |
|
|
Microsoft Corporation |
(MSFT) |
10.71% |
2.48 |
5.32% |
|
|
Stryker Corporation |
(SYK) |
10.32% |
2.78 |
1.33% |
|
|
Union Pacific Corporation |
(UNP) |
✧10.31%✧ |
4.72 |
3.18% |
|
|
Accenture plc |
(ACN) |
10.23% |
3.88 |
2.21% |
|
|
Amgen Inc |
(AMGN) |
10.23% |
7.76 |
3.58% |
|
|
Bristol Myers Squibb Company |
(BMY) |
10.20% |
2.16 |
3.73% |
|
|
The Procter & Gamble Company |
(PG) |
10.00% |
3.48 |
2.68% |
|
|
Intercontinental Exchange, Inc |
(ICE) |
10.00% |
1.32 |
1.41% |
|
|
NextEra Energy, Inc |
(NEE) |
10.00% |
1.54 |
3.78% |
|
|
The Home Depot, Inc |
(HD) |
10.00% |
6.60 |
3.26% |
|
| Medium(≥ 5%but< 10%) |
American States Water Company |
(AWR) |
8.96% |
1.46 |
1.91% |
|
Starbucks Corporation |
(SBUX) |
8.89% |
1.96 |
3.09% |
|
|
Atmos Energy Corporation |
(ATO) |
8.80% |
2.72 |
3.04% |
|
|
Comcast Corporation |
(CMCSA) |
8.70% |
1.00 |
2.71% |
|
|
Medtronic plc |
(MDT) |
8.62% |
2.52 |
2.75% |
|
|
Canadian National Railway Company |
(CNI) |
✧8.52%✧ |
1.92 |
2.41% |
|
|
AbbVie Inc |
(ABBV) |
8.46% |
5.64 |
9.31% |
|
|
Northrop Grumman Corporation |
(NOC) |
8.28% |
6.28 |
1.92% |
|
|
General Dynamics Corporation |
(GD) |
8.18% |
4.76 |
3.94% |
|
|
Lockheed Martin Corporation |
(LMT) |
7.69% |
11.20 |
3.61% |
|
|
Cummins Inc |
(CMI) |
7.41% |
5.80 |
4.90% |
|
|
Raytheon Technologies Corporation |
(RTX) |
7.37% |
2.04 |
3.27% |
|
|
Apple Inc |
(AAPL) |
7.32% |
0.88 |
3.84% |
|
|
DTE Energy Company |
(DTE) |
7.27% |
3.54 |
3.14% |
|
|
Illinois Tool Works Inc |
(ITW) |
7.02% |
4.88 |
3.25% |
|
|
McDonald’s Corporation |
(MCD) |
6.98% |
5.52 |
3.71% |
|
|
Xcel Energy Inc |
(XEL) |
6.40% |
1.83 |
3.36% |
|
|
Merck & Co., Inc |
(MRK) |
6.15% |
2.76 |
3.59% |
|
|
Hormel Foods Corporation |
(HRL) |
6.12% |
1.04 |
2.52% |
|
|
American Tower Corporation |
(AMT) |
6.11% |
5.56 |
2.09% |
|
|
Honeywell International Inc |
(HON) |
5.38% |
3.92 |
2.71% |
|
|
Intel Corporation |
(INTC) |
5.30% |
1.39 |
6.58% |
|
|
PepsiCo, Inc |
(PEP) |
5.13% |
4.30 |
3.40% |
|
| Small(≥ 2.5%but< 5%) |
Johnson & Johnson |
(JNJ) |
4.95% |
4.24 |
2.92% |
|
Altria Group, Inc |
(MO) |
4.65% |
3.60 |
7.80% |
|
|
QUALCOMM Incorporated |
(QCOM) |
4.62% |
2.72 |
2.60% |
|
|
The Bank of Nova Scotia |
(BNS) |
✧4.11%✧ |
2.92 |
4.92% |
|
|
Public Service Enterprise Group |
(PEG) |
4.08% |
2.04 |
3.40% |
|
|
Royal Bank of Canada |
(RY) |
✧3.92%✧ |
3.41 |
3.82% |
|
|
Chevron Corporation |
(CVX) |
3.88% |
5.36 |
5.72% |
|
|
Franklin Resources, Inc |
(BEN) |
3.57% |
1.16 |
3.87% |
|
|
Digital Realty Trust, Inc |
(DLR) |
3.57% |
4.64 |
4.17% |
|
|
The Travelers Companies, Inc |
(TRV) |
3.53% |
3.52 |
3.04% |
|
|
Tyson Foods, Inc |
(TSN) |
3.37% |
1.84 |
2.34% |
|
|
The Toronto-Dominion Bank |
(TD) |
✧3.14%✧ |
2.56 |
4.52% |
|
|
Archer-Daniels-Midland Company |
(ADM) |
2.78% |
1.48 |
3.49% |
|
|
Cisco Systems, Inc |
(CSCO) |
2.78% |
1.48 |
3.31% |
|
|
Taiwan Semiconductor Manufacturing Company Limited |
(TSM) |
✧2.62%✧ |
1.98 |
closed |
|
|
Chubb Limited |
(CB) |
2.56% |
3.20 |
2.62% |
|
|
Pfizer Inc |
(PFE) |
2.56% |
1.60 |
4.38% |
|
| Tiny(< 2.5%) |
The Coca-Cola Company |
(KO) |
2.44% |
1.68 |
4.07% |
|
Main Street Capital |
(MAIN) |
2.44% |
2.52 |
13.21% |
|
|
Pinnacle West Capital Corporation |
(PNW) |
2.41% |
3.40 |
4.32% |
|
|
Verizon Communications Inc |
(VZ) |
1.99% |
2.56 |
4.97% |
|
|
National Retail Properties, Inc |
(NNN) |
1.92% |
2.12 |
5.30% |
|
|
United Parcel Service, Inc |
(UPS) |
0.99% |
4.08 |
3.33% |
|
|
3M Company |
(MMM) |
0.68% |
5.92 |
3.32% |
|
|
International Business Machines Corporation |
(IBM) |
0.61% |
6.56 |
4.74% |
|
|
Realty Income Corporation |
(O) |
✧0.21%✧ |
2.96 |
5.45% |
|
|
W. P. Carey Inc |
(WPC) |
✧0.19%✧ |
4.22 |
6.25% |
✧multiple increases
The table includes the new yield on cost (YoC) for positions still in my portfolio.
I like to see dividend increases of 7% or higher and I’m happy to note that 47 positions had dividend increases of at least 7% in 2021. The arithmetic average of the 82 increases above is 8.66%, up from last year’s 7.04% from 74 increases. Note that I’ve closed one of these positions.
Annualized Returns
As mentioned earlier, the S&P 500 returned 26.9% in 2021, while the Dow and Nasdaq returned 18.7% and 21.4%, respectively. DivGro underperformed the S&P 500 with returns of 21.22% (excluding dividends) and 24.38% (including dividends).
I’m not thrilled with having underperformed the S&P 500 in 2021, but returns above 20% are fantastic!
As a dividend growth investor, my goal is to generate a reliable and growing dividend stream. On that front, DivGro’s dividend yield of 3.16% in 2021 easily beat the 1.33% dividend yield of the S&P 500:
Multpl.com
Most of my existing positions show positive gains for 2021:
Created by author from personal spreadsheet
Topping the list is Alphabet (GOOG), Public Storage (PSA), and Lowe’s (LOW), all with returns exceeding 60%. At the bottom of the list, we find Pinnacle West Capital (PNW), Medtronic (MDT), and Verizon Communications (VZ), all with negative returns of at least 10%.
Here is a chart showing the lifetime returns of all positions in my portfolio (including dividends, where applicable):
Portfolio-Insight.com
Microsoft (MSFT) and Apple (AAPL) are, by far, DivGro’s most profitable positions with total returns exceeding 700% and 600%, respectively, as of 1 April 2022.
In 2021, DivGro added 15 Home Runs, which are stocks in my portfolio that achieve total returns topping 100%. Here are the home runs with returns as of 31 December 2021:
- Home run #28: NextEra Energy (NEE) – up 141% (39% annualized)
- Home run #29: BlackRock, Inc (BLK) – up 143% (46% annualized)
- Home run #30: T. Rowe Price Group, Inc (TROW) -up 193% (32% annualized)
- Home run #31: Texas Instruments Incorporated (TXN) – up 119% (30% annualized)
- Home run #32: Alphabet Inc (GOOG) – up 209% (45% annualized)
- Home run #33: The Walt Disney Company (DIS) –closed for 88% gain (15% annualized)
- Home run #34: Lowe’s Companies, Inc (LOW) – up 189% (49% annualized)
- Home run #35: FedEx Corporation (FDX) – up 77% (33% annualized)
- Home run #36: NIKE, Inc (NKE) – up 106% (42% annualized)
- Home run #37: Starbucks Corporation (SBUX) – up 94% (25% annualized)
- Home run #38: Accenture plc (ACN) – up 140% (51% annualized)
- Home run #39: Broadcom Inc (AVGO) – up 158% (58% annualized)
- Home run #40: The Home Depot (HD) – up 113% (44% annualized)
- Home run #41: Costco Wholesale Corporation (COST) – up 115% (45% annualized)
- Home run #42: CVS Health Corporation (CVS) – up 107% (38% annualized)
Once a stock achieves home run status, it retains that status even if the stock price drops and the total returns dip below the 100% mark. Also, if I buy additional shares of a home run stock at a higher cost basis, the calculated total returns could drop below 100%.
Here are DivGro’s top-performers sorted by annualized returns, as of 31 December 2021:
- Apple Inc (AAPL) – up 691% (120% annualized)
- Microsoft Corporation (MSFT) – up 648% (104% annualized)
- Netflix, Inc (NFLX) – up 299% (64% annualized)
- Broadcom Inc (AVGO) – up 158 (58% annualized)
- QUALCOMM Incorporated (QCOM) – up 79% (52% annualized)
- Accenture plc (ACN) – up 140% (51% annualized)
- Amazon.com (AMZN) – up 234% (50% annualized)
- Lowe’s Companies, Inc (LOW) – up 189% (49% annualized)
- BlackRock, Inc (BLK) – up 143% (46% annualized)
- Costco Wholesale Corporation (COST) – up 115% (45% annualized)
Rate of Return
DivGro’s IRR (internal rate of return) provides the best measure of overall portfolio performance, as IRR takes into account the timing and size of deposits since inception. On 31 December 2021, DivGro’s IRR was 17.5%, up from the 16.2% reported in 2020.
Other Statistics
At the end of 2021, DivGro’s average YoC was 3.97%, up from the 3.70% reported last year. Over time, as stocks I own stocks pay higher dividends, DivGro’s average YoC should increase.
Portfolio-Insight.com
DivGro’s payback increased from 18.4% at the end of 2020 to 26.4% at the end of 2021. Payback is the proportion of capital returned as dividends. I consider it to be a reasonable measure of portfolio maturity.
Portfolio-Insight.com
Main Street Capital (MAIN) tops the chart, mainly because the company pays a generous dividend and it is the stock I’ve owned the longest in my DivGro portfolio.
2021 Highlights
Here are some highlights of 2021:
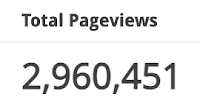
Pageviews
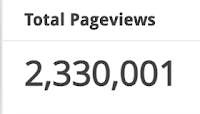
DivGro’s pageviews climbed to 2.96 million on 29 December 2021, an increase of 630,000 over the 2.33 million page views I had on 31 December 2020. That’s an average of 1,731 page views per day in 2021.
 Created by author |
29 December 2021 average since inception:709 page views |
 Created by author |
31 December 2020 average since inception: 1,013page views |
Popular Posts
In 2021, I posted 206 articles on DivGro. This included 92 premium articles published at Seeking Alpha. Here are some of the most successful articles in 2021, based on page views: Top 2021 DivGro Article:• 18 Oct’21: The Top 10 Dividend Growth Opportunities (3,375 pageviews)
Top 2021 Seeking Alpha Article:• 9 Sep’21: The Dividend Aristocrats Ranked By Quality Scores (88,757 pageviews)
Personal Highlights
In my annual reviews, I also like to share some personal highlights.
Soul won the Academy Award for Best Animated Feature, the 11th Pixar film to receive that honor! The film also won the Academy Award for Best Original Score, awarded to composers Trent Reznor, Atticus Ross, and Jon Batiste.
We released Luca on 18 June 2021 on Disney+, as COVID-19 continued to impact the Box Office in 2021. Nevertheless, I’m happy to say that Luca was nominated for an Academy Award for Best Animated Feature despite not being released widely in theaters in the USA.
In 2022, Pixar will be releasing two Animated Feature Films, Turning Red and Lightyear. It is remarkable that most of the production of Luca, Turning Red, and Lightyear have been done from home!
In October, we became grandparents for the second time, this time of a little girl! We truly are blessed!
2022 Outlook
I’ve set some challenging goals for 2022, including collecting dividends and options income totaling $55,200. I’m hoping to put this income to work in DivGro in 2022, favoring investments with yields averaging at least 3.6%. This doesn’t mean I won’t buy stocks if they yield less than 3.6%. But to afford lower-yielding positions, I’d need to balance them with higher-than-3.6% counterparts.
A special word of thanks to all my readers, especially to those that comment regularly and continue to encourage me! This community is amazing and I really love being part of it!
Thanks for reading and all the best with your investments in 2022!
Be the first to comment