

Nasdaq 100, Fed, Jackson Hole, Non-Farm Payrolls Report – Week Ahead
- Nasdaq 100 climbed into record highs, with 16000 nearing ahead
- Tech stocks continued building onto gains from Fed’s Jackson Hole
- US non-farm payrolls report in focus, will a soft print boost Nasdaq?
Nasdaq 100 Resumes Dominant Uptrend Post Jackson Hole
The Nasdaq 100 extended its dominant uptrend since 2020 as the new trading week got underway, inching closer towards 16000. Tech stocks added onto gains obtained from the conclusion of last week’s Fed Jackson Hole Economic Policy Symposium. There, Fed Chair Jerome Powell disappointed investors who were looking for more hawkish signals. The Nasdaq 100, S&P 500 and Dow Jones futures rallied into the close.
Mr Powell’s speech could have been interpreted as relatively dovish in the context of the labor market. At the end of the day, the central bank has a dual mandate. While inflation is running above target and is expected to be transitory, Powell noted that a ‘significant further progress’ on employment has not been quite met yet.
While the markets may be slowly accepting the reality of balance sheet tapering being just around the corner, the odds of a rate hike still remains a ways off. On the chart below, the Nasdaq 100 can be seen rising as December 2022 Fed rate hike bets weakened after Jackson Hole. As such, growth-oriented shares likely capitalized on the central bank’s still-patient tone on monetary policy.
This is also placing much weight on this week’s non-farm payrolls report. A solid round of data could revive faster-than-expected tapering expectations. Is that asking for too much? According to the Citi Economic Surprise Index, US data is tending to underperform relative to economists’ expectations. This suggests analysts are overestimating the health and vigor of the nation’s potential. This may open the door to a softer jobs report, underscoring Powell’s tone on the labor market, keeping hawkish Fed bets at bay.
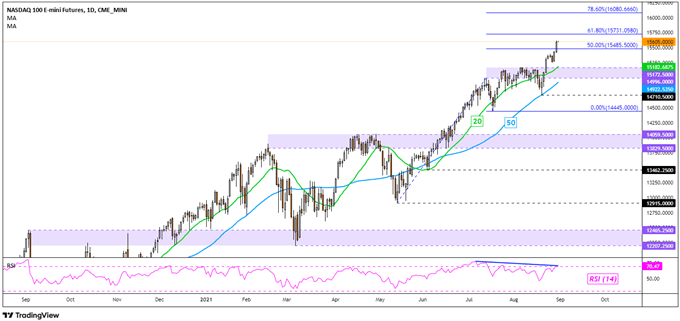
Nasdaq 100 Technical Analysis
The record push in the Nasdaq 100 has brought it above the midpoint of the Fibonacci extension at 15485.50. Immediate resistance seems to be the 61.8% extension point at 15731. Above that price is the 78.6% level at 16080.66. In the event of a turn lower, keep a close eye on the former 14996 – 15172 resistance zone. It may come into play as new support. A further breakdown under the 20- and 50-period Simple Moving Averages risks opening the door to a material turn lower. The July low at 14445 could then act as critical support.
— Written by Daniel Dubrovsky, Strategist for DailyFX.com
To contact Daniel, use the comments section below or @ddubrovskyFX on Twitter
Be the first to comment