

R&A Studio
This article was originally published on Dividend Kings on Wednesday, January 4th, 2023.
—————————————————————————————
2022 was a very bad year for stocks. How bad?
Daily Shot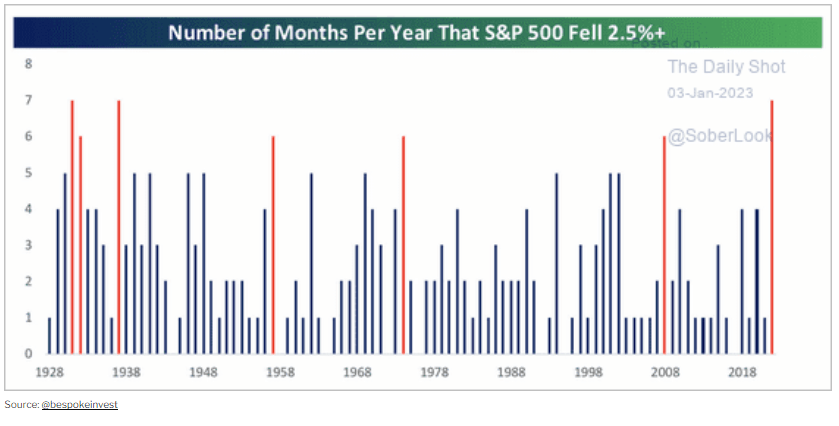
We had the most 2.5+% monthly declines since 1938. Add to this the fact that we had the worst bond bear market in history, and it was a rather bleak year for most investors.
Why Stocks Are Likely To Fall Further Before This Bear Market Ends
| Earnings Decline In 2023 | 2023 S&P Earnings | X 25-Year Average PE Of 16.8 | Decline From Current Level |
| 0% | $218.46 | $3,676.68 | 3.9% |
| 5% | $207.54 | $3,492.85 | 8.7% |
| 10% | $196.61 | $3,309.01 | 13.5% |
| 13% (average and median recession since WWII) | $190.06 | $3,198.71 | 16.4% |
| 15% | $185.69 | $3,125.18 | 18.3% |
| 20% | $174.77 | $2,941.35 | 23.1% |
(Source: DK S&P Valuation Tool, Bloomberg Blue-Chip Consensus)
The 2022 bear market was pure valuation contraction. PEs fell from 21.5X at the start of last year.
But now, a recession is likely to begin within two to three months. While it’s expected to be a short and mild recession, possibly the mildest in history, the blue-chip consensus expects a weak year for earnings.
The best case is earnings are flat, and the most pessimist forecast is they will fall 20%.
That is why the blue-chip consensus expects the S&P to fall to 3,000 to 3,400 before we finally bottom, most likely in Q1 of 2023.
The good news? Once the market prices in the recession, the bottom is in and then a new bull market will be born.
Ben Carlson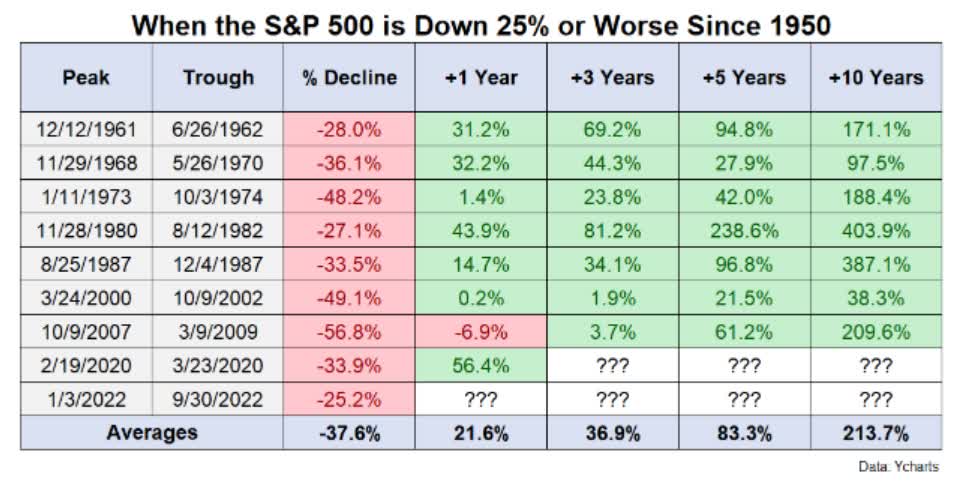
Bull markets tend to have the strongest returns upfront, including face-ripping rallies of 10+% in a single week and sometimes 20% in a single month.
And most importantly, 5+ years later, stocks average a near double and, after a decade, are up over 3X.
Of course, to earn those great returns, you must first survive the bear market’s end.
And that’s where the power of low-volatility high-yield blue-chips comes in.
How Low-Volatility High-Yield Blue-Chips Can Keep You Safe And Sane During The Likely Correction To Come
Let me be clear that volatility has nothing to do with fundamental risk. The risk of permanently losing money in a company is purely a function of fundamentals, specifically cash flow and bankruptcy risk.
Investors can be hurt by such volatility only if he is forced, by either financial or psychological pressures, to sell at untoward times.” – Warren Buffett
Similarly, dividend safety has no connection to volatility, at least not directly.
So why are people so worried about volatility?
It’s because of emotional reasons baked into our DNA. Psychology studies have found something called “loss aversion,” which means that it hurts twice as much to lose a dollar as it is pleasurable to make a dollar.
If stocks are down 20%, no one denies that certain blue-chips are on sale. But during such bear markets, doomsday prophets who make their living peddling terror will make outlandish claims like “the market is going to fall 50%, 60%, or even 90%.”
J Boorman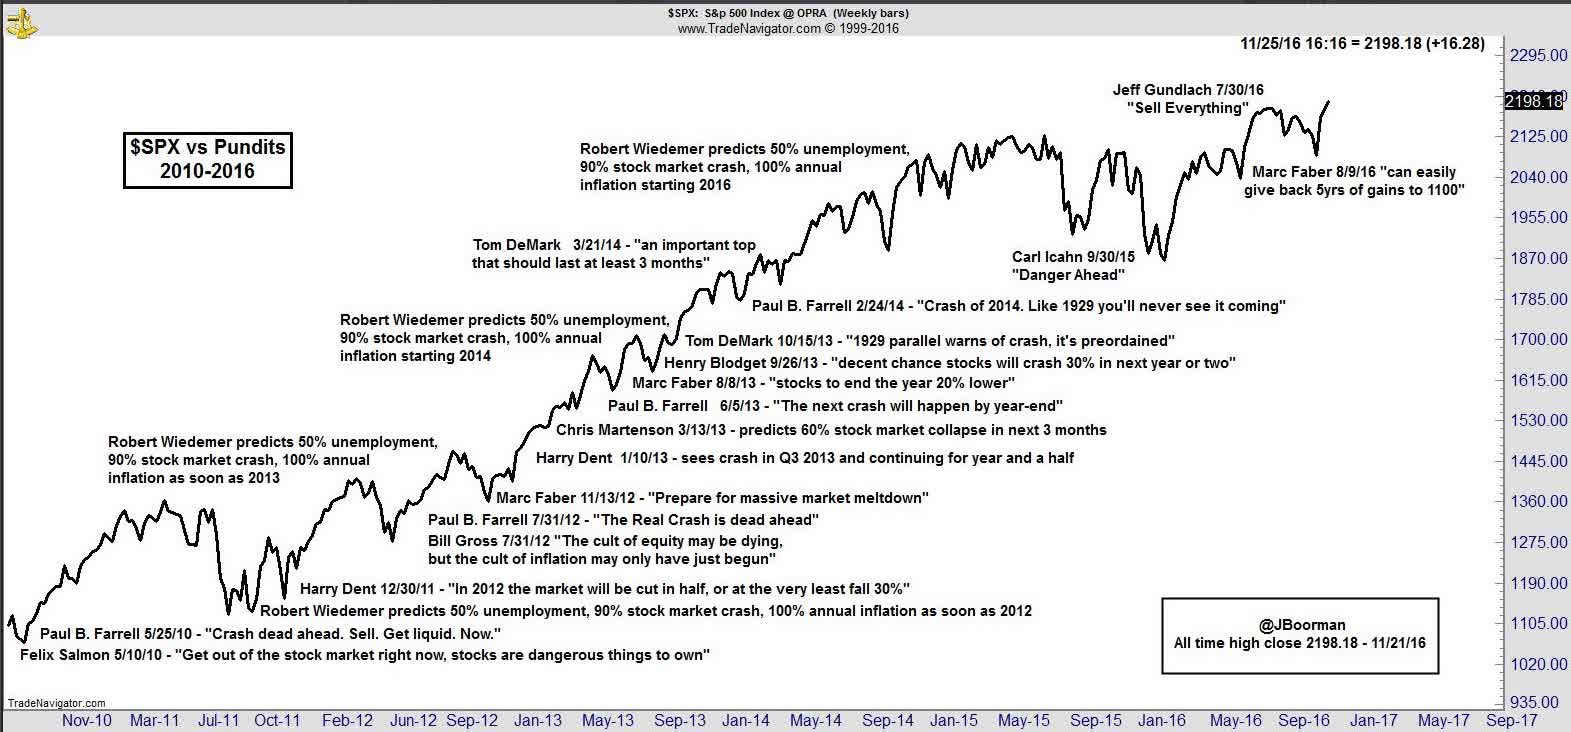
If stocks are down 20%, you think they might fall 50%? That’s another 38% decline.
If stocks are down 20% and you think they might fall 60%, that’s another 50% decline.
Never mind that blue-chips can only get so cheap, and that it would require something truly catastrophic in the economy to cause stocks to fall this much.
When the market slides 9% in a single month, as it did three times in 2022, the outlandish fear-mongering of the doomsday prophet sound plausible.
But this is where low volatility blue-chips can save your sanity and money.
How To Find The Best Low Volatility High-Yield Blue-Chips In 1 Minute
Let me show you how to screen the Dividend Kings Zen Research Terminal, which runs off the DK 500 Master List, to find the highest-yielding blue-chips on Wall Street easily.
The Dividend Kings 500 Master List includes some of the world’s best companies, including:
- every dividend champion (25+ year dividend growth streaks, including foreign aristocrats)
- every dividend aristocrat
- every dividend king (50+ year dividend growth streaks)
- every Ultra SWAN (as close to perfect quality companies as exist)
- the 20% highest quality REITs according to iREIT
- 40 of the world’s best growth blue-chips
| Step | Screening Criteria | Companies Remaining | % Of Master List |
| 1 | Low Volatility Watchlist (20% or less annual volatility) | 51 | 10.20% |
| 2 | Reasonable Buy Or Better | 19 | 3.80% |
| 3 | 8+% long-term return potential (A Good Return For Defensive Blue-Chips) | 16 | 3.20% |
| 4 | 3+% high-yield | 12 | 2.40% |
| 5 | 10+ quality rating (blue-chip quality or better) | 11 | 2.20% |
| 6 | Non-Speculative | 9 | 1.80% |
| Total Time | 1 Minute |
In one minute, we found nine amazing low volatility high-yield blue-chips. Stocks that are perfect for surviving and thriving during a potential 20% market downturn in the next few weeks.
The Best 9 High-Yield Low Volatility Blue-Chips For The First Half Of 2023 (Likely Scariest Part of The Bear Market)
I’ve linked to articles for further information about each company.
(Source: Dividend Kings Zen Research Terminal)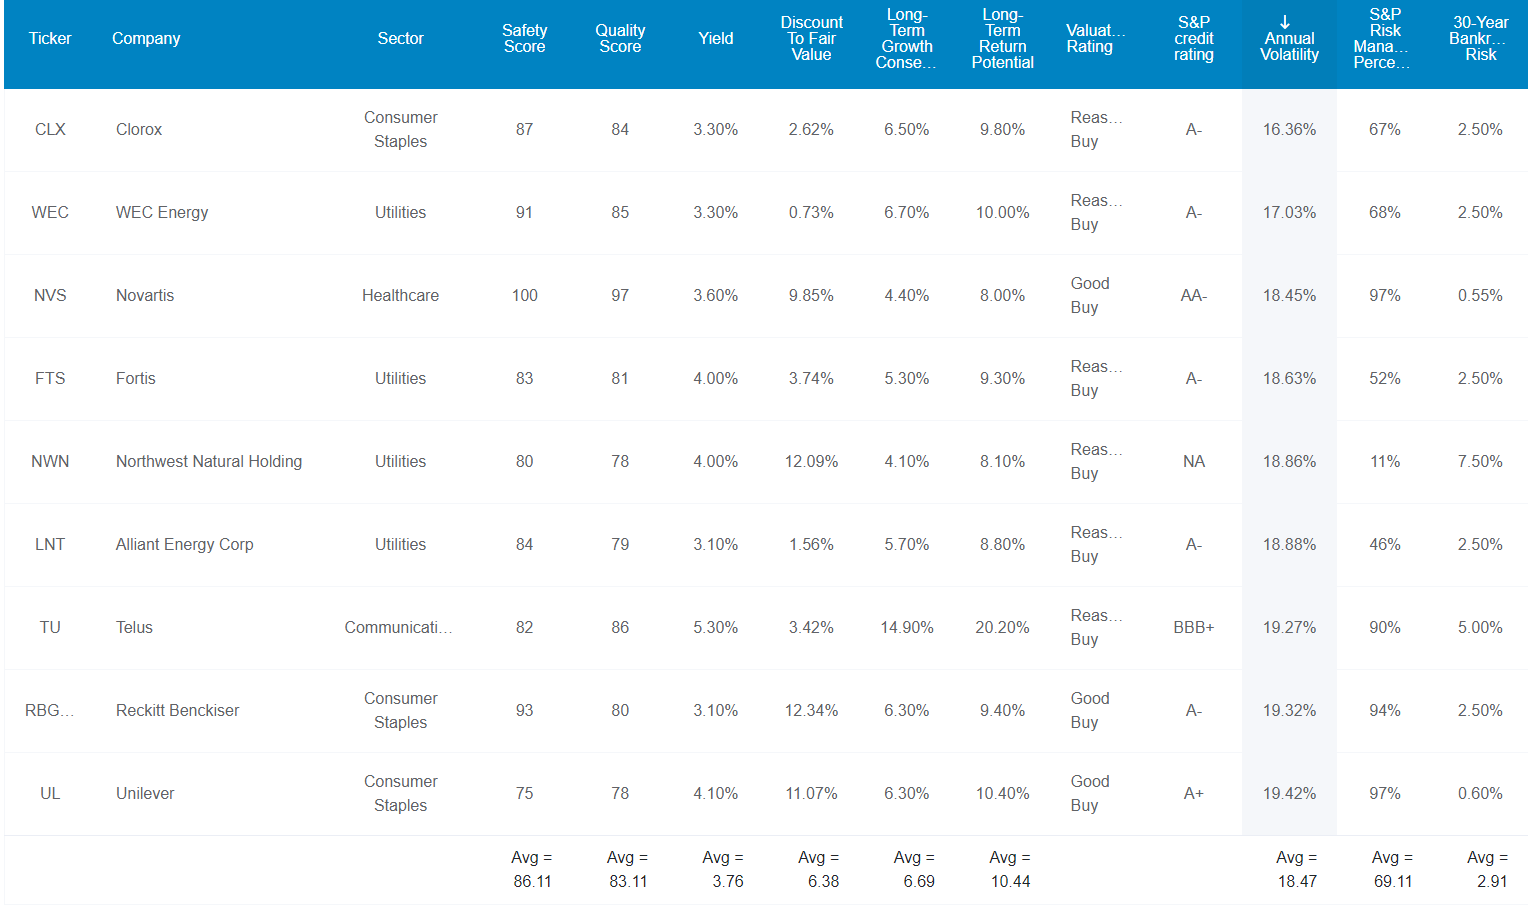
Here they are in order of lowest volatility.
Tax Implications
TU and FTS are Canadian companies, and there is a 15% dividend tax withholding for US investors in taxable accounts.
- none in retirement accounts
- tax credit is available for US investors in taxable accounts
Novartis is a Swiss company, and per a tax treaty with the US, American investors are entitled to a 15% withholding.
- but unless your broker fills out the paperwork, it will be a 35% withholding
- own all non-Canadian foreign stocks in taxable accounts to be eligible for the tax credit
Owning non-Canadian foreign stocks in retirement accounts will mean the withholding is permanent.
UL is a UK company and there is no dividend tax withholding for UK companies (just UK REITs).
Why These Are Some Of The Best Super SWANs For A Crashing Market
First of all, because we screened only low-volatility stocks the average volatility is incredible, at 18.5%.
- average standalone company 28%
- average dividend aristocrat 24%
In a few minutes, combining nine low-volatility blue-chips in four sectors results in 11% annual volatility, 33% less than the S&P 500.
But first, let me show you why you can trust these blue-chips in a recession.
(Source: DK Zen Research Terminal)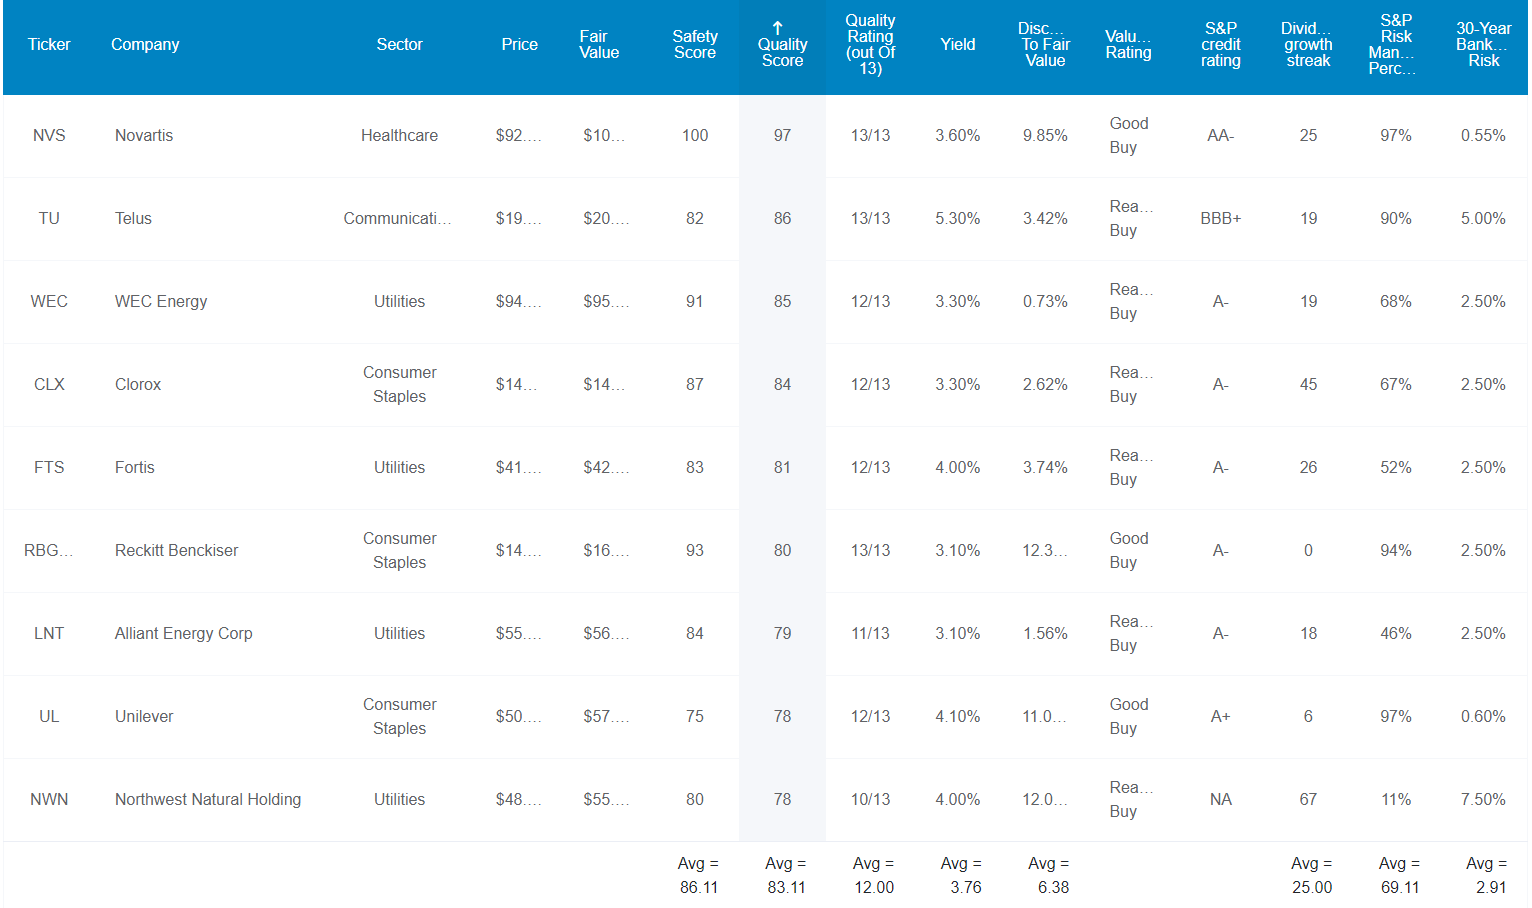
These aren’t just blue-chips; they are 12/13 Super SWAN quality blue-chips, on par with the dividend aristocrats. Here’s why.
Their average safety score of 86% indicates very safe dividends. How safe?
- average recession dividend cut risk approximately 0.5%
- average severe recession (Pandemic or Great Recession level) 1.7%
In other words, even if the economy crashes, the risk of these Super SWANs cutting their dividends is approximately 1 in 59.
For further proof of safety, consider their average dividend growth streak which is 25 years.
- the Ben Graham standard of excellence is 25 years
- they are an effective dividend aristocrat portfolio
S&P estimates their average 30-year bankruptcy risk at 2.91%, an A-stable credit rating portfolio.
S&P also estimates its total long-term risk management at the 69th percentile.
Long-Term Risk Management You Can Trust In Even The Worst Economies
DK uses S&P Global’s global long-term risk-management ratings for our risk rating.
- S&P has spent over 20 years perfecting their risk model
- which is based on over 30 major risk categories, over 130 subcategories, and 1,000 individual metrics
- 50% of metrics are industry specific
- this risk rating has been included in every credit rating for decades
The DK risk rating is based on the global percentile of how a company’s risk management compares to 8,000 S&P-rated companies covering 90% of the world’s market cap.
These Super SWANs score 69th Percentile On Global Long-Term Risk Management
S&P’s risk management scores factor in things like:
- supply chain management
- crisis management
- cyber-security
- privacy protection
- efficiency
- R&D efficiency
- innovation management
- labor relations
- talent retention
- worker training/skills improvement
- occupational health & safety
- customer relationship management
- business ethics
- climate strategy adaptation
- sustainable agricultural practices
- corporate governance
- brand management
| Classification | S&P LT Risk-Management Global Percentile |
Risk-Management Interpretation |
Risk-Management Rating |
| BTI, ILMN, SIEGY, SPGI, WM, CI, CSCO, WMB, SAP, CL | 100 | Exceptional (Top 80 companies in the world) | Very Low Risk |
| Strong ESG Stocks | 86 |
Very Good |
Very Low Risk |
| Foreign Dividend Stocks | 77 |
Good, Bordering On Very Good |
Low Risk |
| Ultra SWANs | 74 | Good | Low Risk |
| High-Yield Low Volatility Super SWANs | 69 | Above-Average (Bordering On Good) | Low Risk |
| Dividend Aristocrats | 67 | Above-Average (Bordering On Good) | Low Risk |
| Low Volatility Stocks | 65 | Above-Average | Low Risk |
| Master List average | 61 | Above-Average | Low Risk |
| Dividend Kings | 60 | Above-Average | Low Risk |
| Hyper-Growth stocks | 59 | Average, Bordering On Above-Average | Medium Risk |
| Dividend Champions | 55 | Average | Medium Risk |
| Monthly Dividend Stocks | 41 | Average | Medium Risk |
(Source: DK Research Terminal)
In other words, according to S&P, these nine companies are among the top 2,480 companies on earth at managing every kind of risk they face. If something can go wrong, they have the proven ability to adapt and overcome it.
Now that you know why you might want to own these Super SWANs, here’s why they are potentially worth buying today.
Wonderful Companies At Fair Prices
DK Zen Research Terminal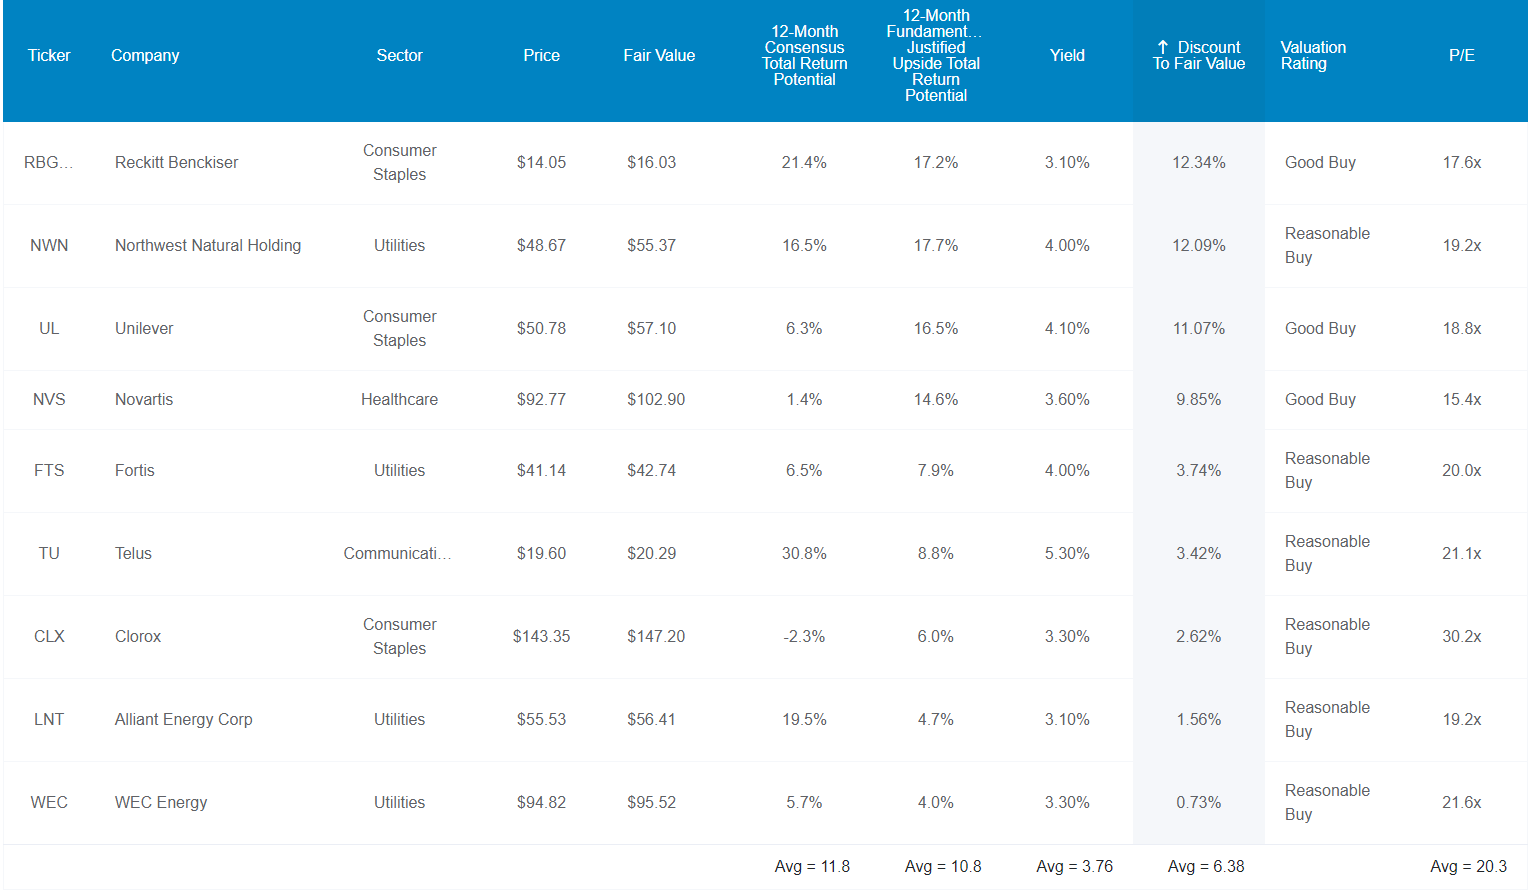
Because these are low volatility Super SWANs, they haven’t crashed during this bear market. That’s why they are just 6% undervalued, but that’s still better than the S&P, which is trading at 16.8X forward earnings and exactly at fair value.
Analysts expect these Super SWANs to deliver 12% total returns in a year, pretty close to what they expect from the S&P. Their fundamentally justified upside to fair value in the next year is 11%.
But let me show you why these nine low-volatility Super SWANs could be just what you’re looking for ahead of a potential 10% to 20% market decline.
Low Volatility Doesn’t Have To Mean Weak Returns
DK Zen Research Terminal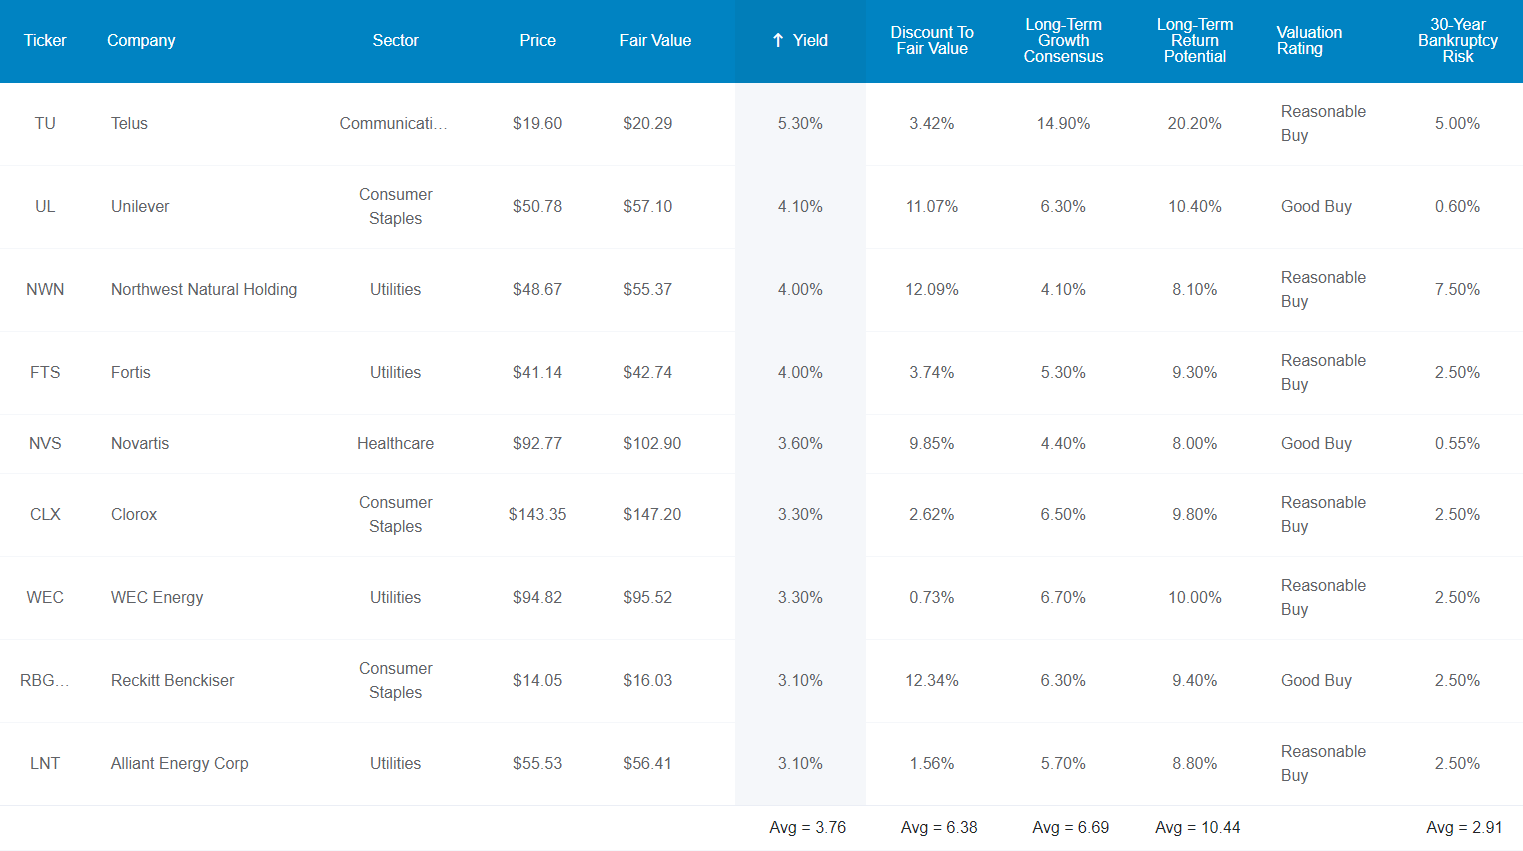
These low volatility Super SWANs offer an attractive 3.8% yield and are growing at almost 7%. That means a 10.4% long-term return potential.
Long-Term Consensus Return Potential
| Investment Strategy | Yield | LT Consensus Growth | LT Consensus Total Return Potential | Long-Term Risk-Adjusted Expected Return |
| High-Yield Low Volatility Super SWANs | 3.8% | 6.7% | 10.5% | 7.3% |
| Schwab US Dividend Equity ETF | 3.4% | 7.6% | 11.0% | 7.7% |
| 60/40 Retirement Portfolio | 2.1% | 5.1% | 7.2% | 5.0% |
| Vanguard Dividend Appreciation ETF | 1.9% | 10.2% | 12.1% | 8.5% |
| Dividend Aristocrats | 1.9% | 8.5% | 10.4% | 7.3% |
| S&P 500 | 1.8% | 8.5% | 10.3% | 7.2% |
| Nasdaq | 0.8% | 10.9% | 11.7% | 8.2% |
(Sources: DK Research Terminal, FactSet, Morningstar, Ycharts)
What’s so exciting about 10% to 11% long-term returns? Nothing at all, and that’s the point.
The S&P is expected to keep delivering its historical 10% returns but with 33% higher volatility and less than half the yield of these Super SWAN aristocrats.
Why should you have to sacrifice good long-term returns for low volatility? You don’t with these stocks.
Why shouldn’t you get paid almost 4% from some of the safest dividend blue-chips while earning those good low-volatility returns? With these stocks, you can.
OK, that all sounds great, but what evidence do we have that a bunch of utilities, telecoms, consumer staples, and healthcare blue-chips can actually deliver 10% to 11% annual returns over time?
Historical Returns Since 1996
The future doesn’t repeat, but it often rhymes. – Mark Twain
Remember, “past performance is no guarantee of future results.”
But studies show that blue chips with relatively stable fundamentals offer predictable returns based on yield, growth and valuation mean reversion over time.
Bank of America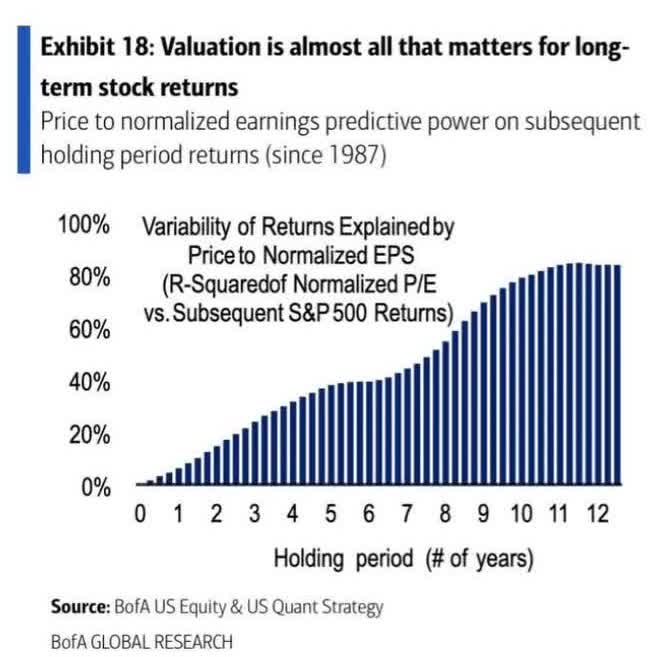
26 years is a time period when 94% of returns are a result of fundamentals, not luck.
(Source: Portfolio Visualizer Premium)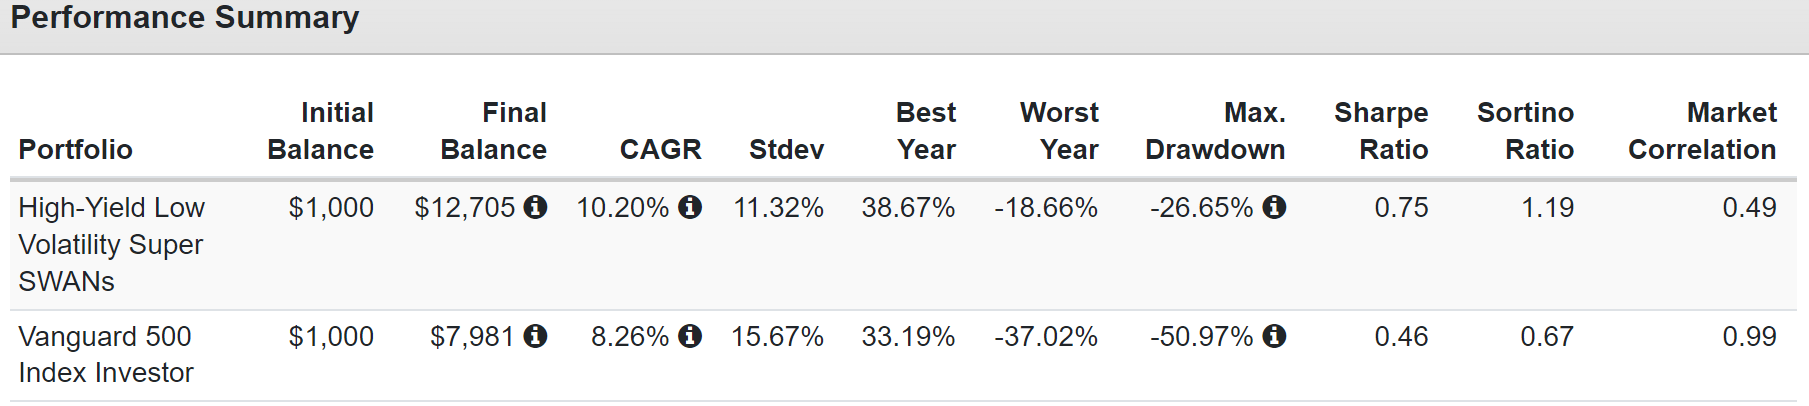
Behold the power of combining low-volatility Super SWANs into an ultra-low-volatility portfolio. 33% lower annual volatility than the S&P with just nine stocks.
And a peak decline that’s half as bad as during the Great Recession. For context, the 60/40 fell 44% during the GFC.
(Source: Portfolio Visualizer Premium)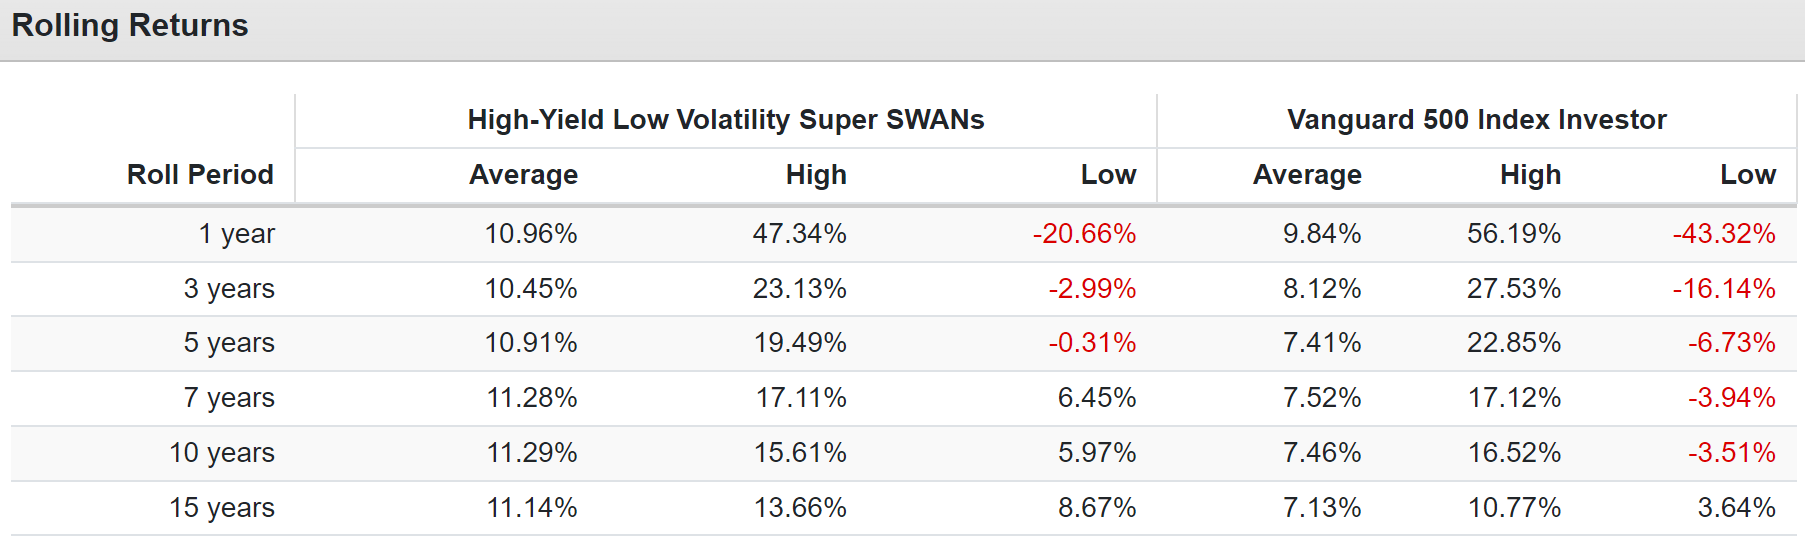
That’s why the negative volatility-adjusted returns (Sortino ratio) are twice as high as the S&P. Consistently 10% to 11% rolling returns, and with a lot less volatility than the S&P?
How is this possible? How can a bunch of utilities and consumer staples beat the might tech heavy S&P? Don’t these kinds of companies not keep up in bull markets?
- they captured 55% of the market’s upside
- but just 30% of the market’s downside
That’s why low volatility is a proven alpha factor, as is dividend growth, and quality. These nine blue-chips represent three proven alpha factors, and they delivered the goods during the last quarter century.
But here’s the best part of high-yield dividend growth investing.
Income Growth That Rich Retirements Are Made Of
Dividends In USD ((Source: Portfolio Visualizer Premium))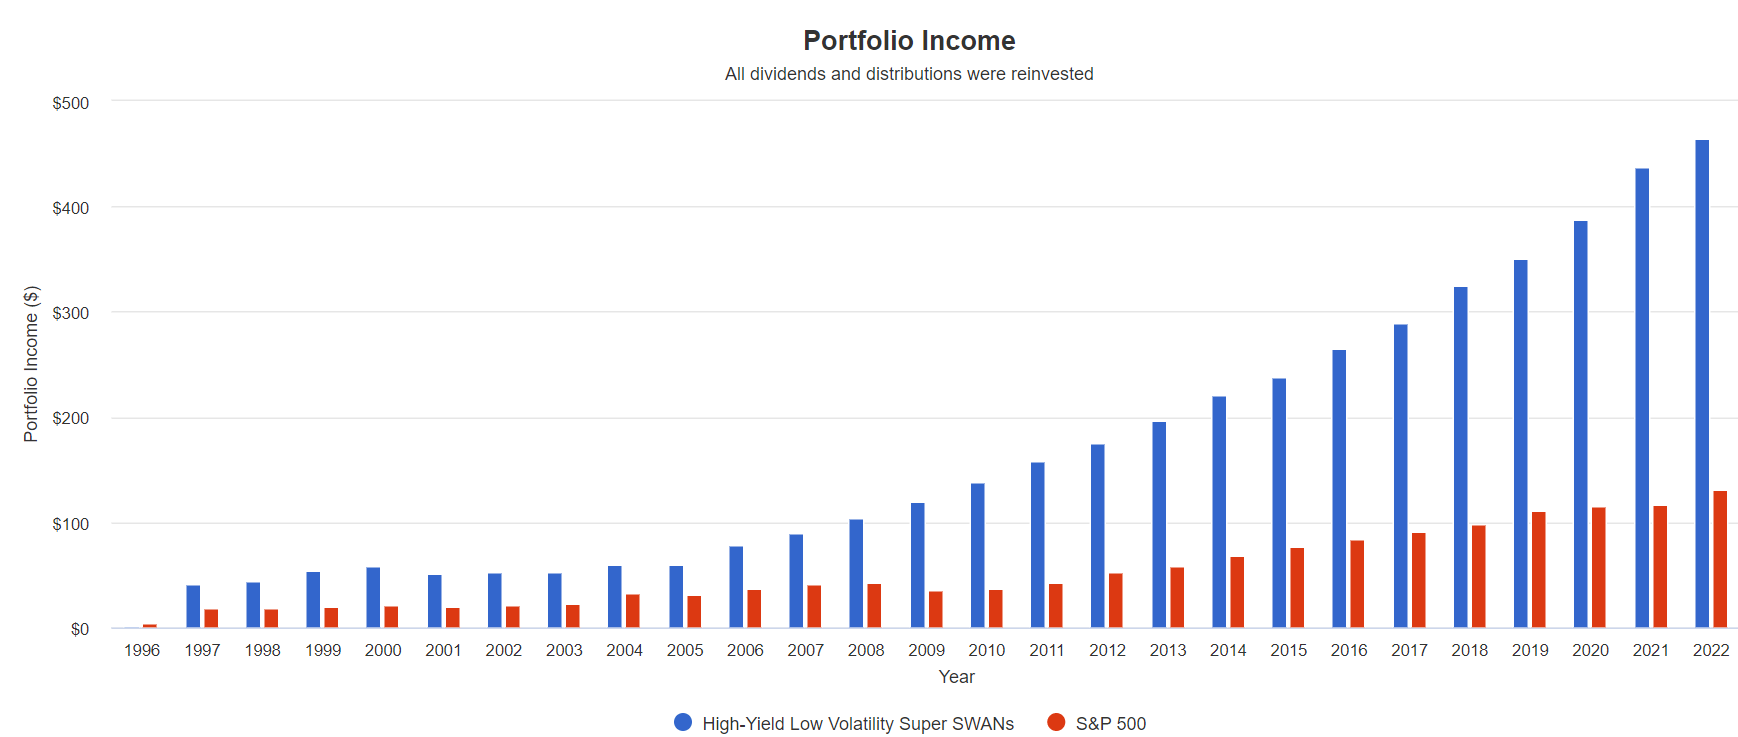
Now that’s what I call a high-yield income growth portfolio.
Cumulative Dividends Since 1997 Per $1,000 Investment
| Metric | S&P | Low Volatility High-Yield Super SWANs |
| Total Dividends | $1,573 | $4,508 |
| Total Inflation-Adjusted Dividends | $841.18 | $2,410.70 |
| Annualized Income Growth Rate | 7.2% | 10.2% |
| Total Income/Initial Investment % | 1.57 | 4.51 |
| Inflation-Adjusted Income/Initial Investment % | 0.84 | 2.41 |
| More Inflation-Adjusted Income Than S&P 500 | NA | 2.87 |
| Starting Yield | 2.0% | 4.1% |
| Today’s Annual Dividend Return On Your Starting Investment (Yield On Cost) | 11.3% | 46.5% |
| 2022 Inflation-Adjusted Annual Dividend Return On Your Starting Investment (Inflation-Adjusted Yield On Cost) | 6.0% | 24.9% |
(Source: Portfolio Visualizer Premium)
From a similar yield as you can buy today, these Super SWANs delivered higher returns than the S&P and 3X more inflation-adjusted income.
They grew their dividends 50% as fast, and today their inflation-adjusted yield on cost is 4X greater, an impressive and life-changing 25%.
OK, that’s amazing, but didn’t you promise 14 high-yield blue-chips perfect for a market crash? Indeed I did.
How To Turn These Low Volatility Super SWANs Into An Ultra Low Volatility Retirement Portfolio
Portfolio Visualizer Premium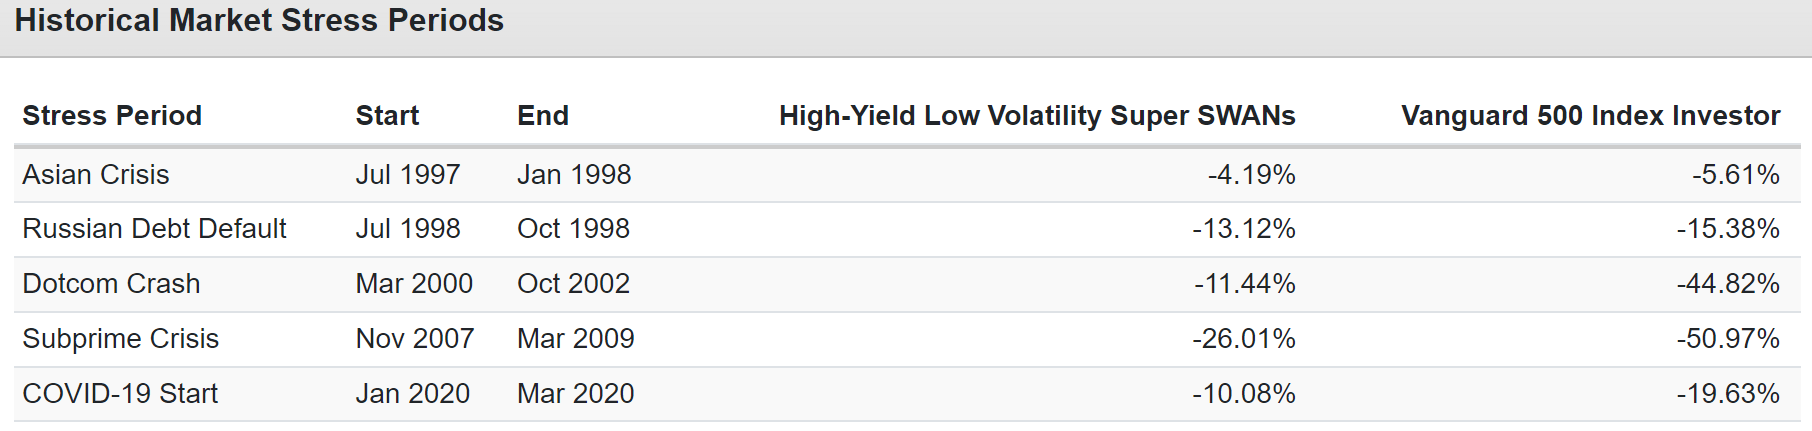
These low volatility Super SWANs did their job in every single major market stress point of the last quarter century.
Portfolio Visualizer Premium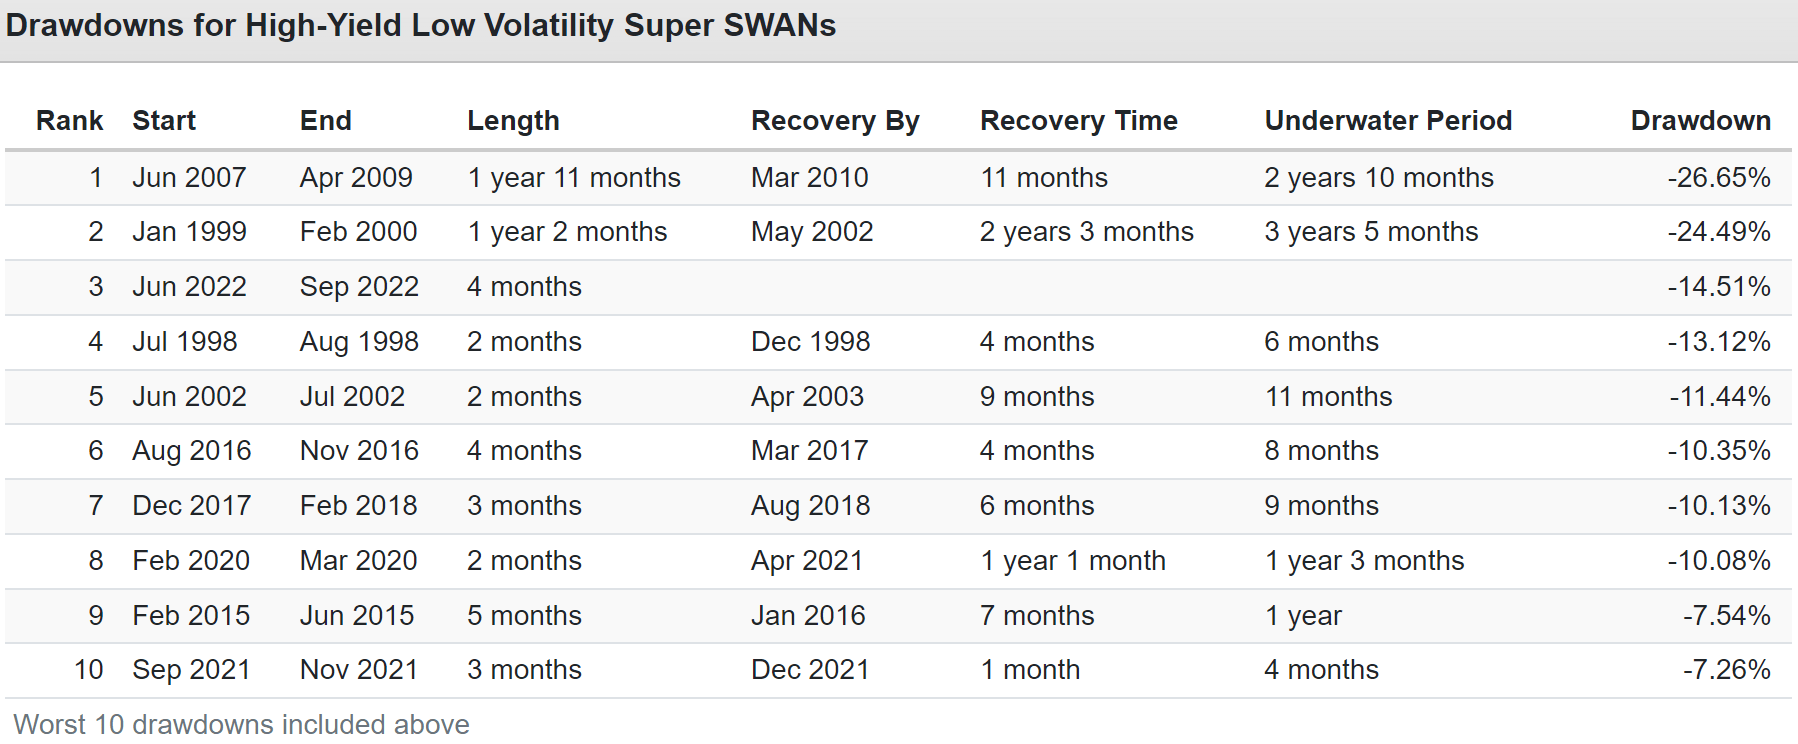
They’ve suffered just two bear markets over the last 26 years, while the S&P has suffered six.
In the tech crash? They fell half as much as the S&P.
In the Great Recession? They fell half as much.
In the Pandemic? Half as much.
In the 2022 bear market? Half as much.
Basically, you can expect these low volatility Super SWANs, all on their own, to fall just half as much as the market during even the most extreme recessions and crashes.
But what if you wanted to crank the low volatility to 11? What if even 50% lower declines than the market aren’t enough to let you sleep well at night? What if annual volatility of just 11% is too much for you to bear?
Welcome To ZEUS: The King Of Sleep Well At Night Portfolios
Based on research from Nick Maggiulli, Chief Data Scientist for Ritholtz Wealth Management, I’ve spent over a year, and more than 100 model portfolios confirming this portfolio strategy is optimal for super-low declines during recessions and offers. I’ve stress tested them in over 1 million Monte Carlo simulations over the next 75 years to confirm this strategy is one that anyone can trust with their life-savings.
- 2X to 3X the yield of a 60/40
- far better returns than the 60/40 (7% to 15% per year)
- 30% to 82% lower declines than the S&P 500
- 33% to 40% less annual volatility than the S&P
In other words, ZEUS lets you ride over even the worst market potholes in a Rolls Royce portfolio on the way to a rich retirement.
What manner of sorcery can provide all that? It’s not magic, it’s just math.
- ZEUS = Zen Extraordinary Ultra Sleep Well At Night portfolio
The key to ZEUS is historically optimal asset allocation and historically optimal hedging and the world’s best blue-chips.
- 33% ETFs
- 33% hedges (cash, bonds, managed futures, hedge funds, alternative assets)
- 33% individual blue-chips
This is a 67% stock/33% hedges portfolio, which 50 years of market data, per Nick Maggiulli, is optimal for maximizing returns while minimizing bear market volatility.
In this case, if you want the lowest volatility, you can create the ZEUS Ultra Low Volatility High-Yield portfolio.
ETF Bucket: 33%
- 11.1% SCHD (gold standard high-yield ETF)
- 11.1% VHT (gold standard healthcare ETF)
- 11.1% IYK (gold standard consumer staples ETF)
Remember how healthcare and consumer staples are the only sectors that historically go up in a recession? Well, we’re taking advantage of that here.
Hedging Bucket: 33%
- 16.67% EDV (gold standard long duration US treasuries)
- 16.67% DBMF (the vanguard of managed futures hedge funds)
Why is this such a magical combination?
DBMF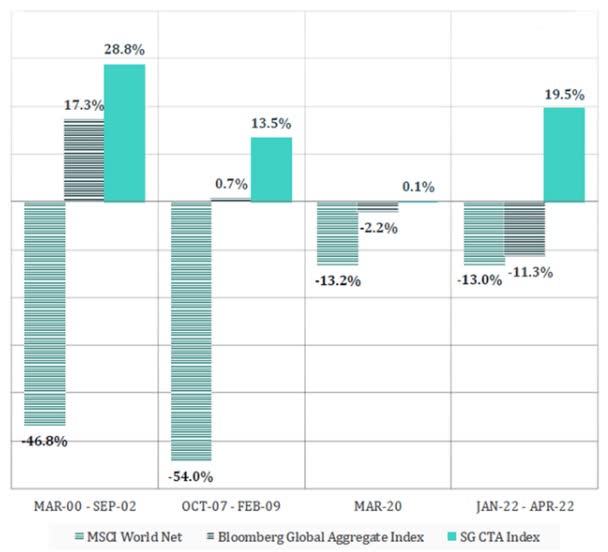
Because bonds are the historically best hedge in recessions, usually rising the most during bear markets. Long bonds work best, sometimes soaring as much as 75% when the market is crashing hardest (Great Recession).
Bonds have gone up 92% of the time when stocks fall since WWII. The other 8% of the time? Bonds and stocks fall together. But do you know what has no correlation to stocks or bonds? Managed futures!
When Stocks And Bonds Fail, Managed Futures Don’t
| Bear Market | Managed Futures | Bonds | 50/50 Bonds Managed Futures | S&P |
| 2022 Stagflation | 17% | -13% | 2% | -28% |
| Pandemic Crash | 0% | -0.5% | 0% | -34% |
| 2018 | 6% | 2% | 4% | -21% |
| 2011 | -7% | 5% | -1% | -22% |
| Great Recession | 14% | 7% | 11% | -58% |
| Tech Crash | 29% | 9% | 19% | -50% |
| 1998 Bear Market | NA | 1% | 1% | -22% |
| 1990 Recession | 21% | 1% | 11% | -20% |
| 1987 Flash Crash | 57% | -3% | 27% | -30% |
| 1980 to 1983 Stagflation Period | 195% | NA | 195% | 51% |
| Average | 37% | 1% | 19% | -23% |
(Sources: Portfolio Visualizer Premium, Charlie Bilello)
Since 1980, 11 bear markets. Managed futures + bonds have always gone up or been flat. The historically optimal hedging strategy. With long bonds, average bear market gains are even better, but I couldn’t get the data back that far.
When the combo fails, it returns on par with cash. When they succeed, they are the mirror image of the market’s decline. How does such a strategy that generates about 6% long-term returns sound? To me, it sounds better than cash.
Blue-Chip Bucket 33%
- 3.7% CLX
- 3.7% WEC
- 3.7% NVS
- 3.7% FTS
- 3.7% NWN
- 3.7% LNT
- 3.7% TU
- 3.7% RBGLY
- 3.7% UL
So what does ZEUS Low Volatility offer?
ZEUS Low Volatility Vs. 60/40
| Metric | 60/40 | ZEUS Low Volatility | X Better Than 60/40 |
| Yield | 2.1% | 4.2% | 2.00 |
| Growth Consensus | 5.1% | 4.8% | 0.94 |
| LT Consensus Total Return Potential | 7.2% | 9.0% | 1.25 |
| Risk-Adjusted Expected Return | 5.0% | 6.3% | 1.25 |
| Safe Withdrawal Rate (Risk And Inflation-Adjusted Expected Returns) | 2.8% | 4.0% | 1.45 |
| Conservative Time To Double (Years) | 26.0 | 17.9 | 1.45 |
(Source: DK Research Terminal, FactSet)
How about twice the yield of a 60/40, with 25% better long-term returns and 33% less volatility? How about market-like 9% returns but with half the annual volatility of the S&P 500?
Safe yield today, potentially superior returns tomorrow, and volatility so low you’ll laugh at bear markets.
Inflation-Adjusted Consensus Total Return Potential: $510,000 Average Retired Couple’s Savings Age 65
| Time Frame (Years) | 4.8% CAGR Inflation-Adjusted 60/40 | 6.6% Inflation-Adjusted ZEUS Low Volatility | Difference Between ZEUS Low Volatility Consensus and 60/40 Consensus |
| 5 | $644,728.09 | $702,030.85 | $57,302.77 |
| 10 | $815,047.66 | $966,367.29 | $151,319.64 |
| 15 | $1,030,361.01 | $1,330,234.62 | $299,873.61 |
| 20 | $1,302,554.28 | $1,831,109.31 | $528,555.03 |
| 25 | $1,646,653.58 | $2,520,578.88 | $873,925.30 |
| 30 retirement time frame | $2,081,654.53 | $3,469,655.19 | $1,388,000.66 |
| 35 | $2,631,570.86 | $4,776,088.22 | $2,144,517.36 |
| 40 | $3,326,760.08 | $6,574,433.91 | $3,247,673.82 |
| 45 | $4,205,599.33 | $9,049,912.65 | $4,844,313.31 |
| 50 | $5,316,603.94 | $12,457,486.08 | $7,140,882.15 |
| 55 | $6,721,105.64 | $17,148,116.85 | $10,427,011.20 |
| 60 investing lifetime | $8,496,638.38 | $23,604,915.90 | $15,108,277.52 |
| 100 multi-generational wealth, charity time frame | $55,424,073.36 | $304,292,077.41 | $248,868,004.05 |
(Source: DK Research Terminal, FactSet)
Over a 30-year retirement, ZEUS low volatility offers the averaged retired couple $1.4 million in extra inflation-adjusted income and wealth.
| Time Frame (Years) |
Ratio ZEUS Low Volatility Portfolio Vs. 60/40 Consensus |
| 5 | 1.1 |
| 10 | 1.2 |
| 15 | 1.3 |
| 20 | 1.4 |
| 25 | 1.5 |
| 30 | 1.7 |
| 35 | 1.8 |
| 40 | 2.0 |
| 45 | 2.2 |
| 50 | 2.3 |
| 55 | 2.6 |
| 60 | 2.8 |
| 100 | 5.49 |
(Source: DK Research Terminal, FactSet)
How do twice the yield today and 70% better returns over the next 30 years sound? And with volatility like this.
Historical Returns Since December 2007 (Start Of The Great Recession)
(Source: Portfolio Visualizer Premium)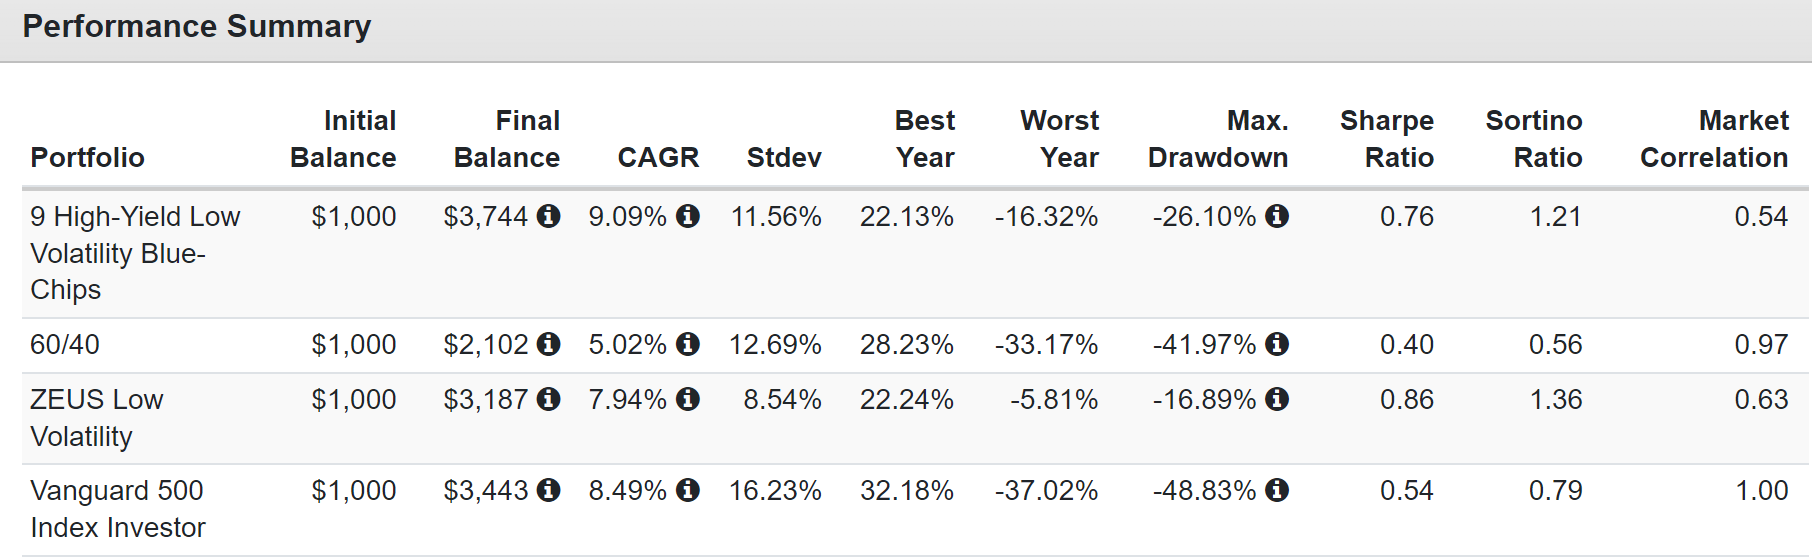
Half the annual volatility of the S&P each year and less than 1/3rd the decline in the 2nd worst crash in US history.
- captured 44% of the market’s upside
- and just 28% of its downside
(Source: Portfolio Visualizer Premium)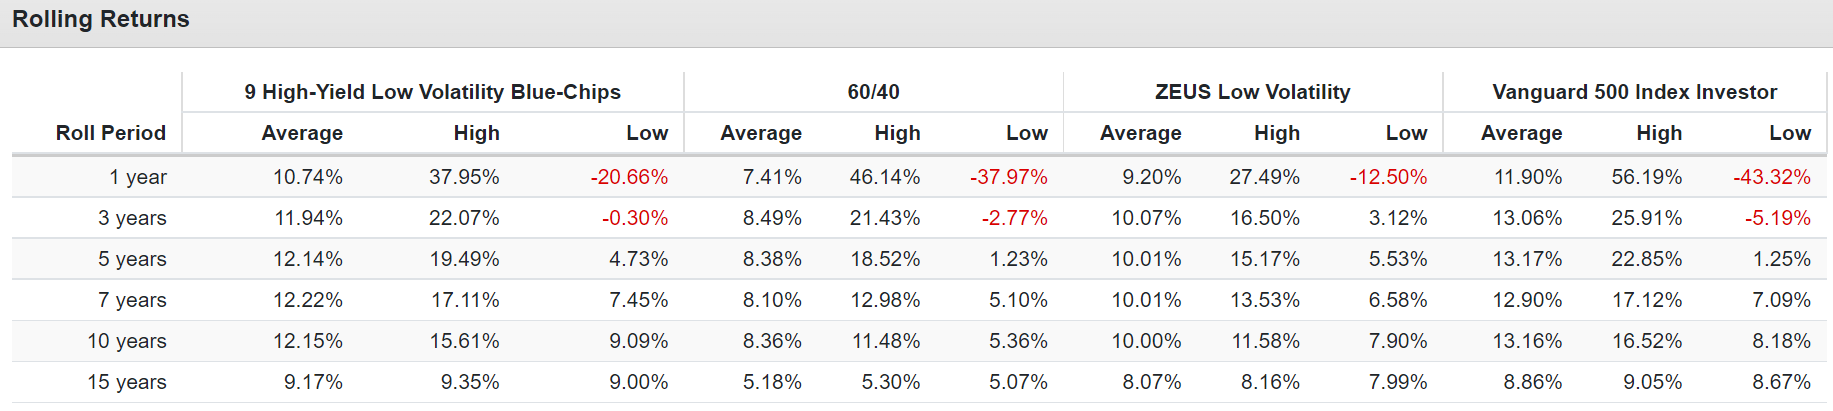
8% to 10% rolling returns compared to 9% expected in the future.
60/40 beating returns and negative-volatility-adjusted returns are better than the low volatility blue-chips on their own.
(Source: Portfolio Visualizer Premium)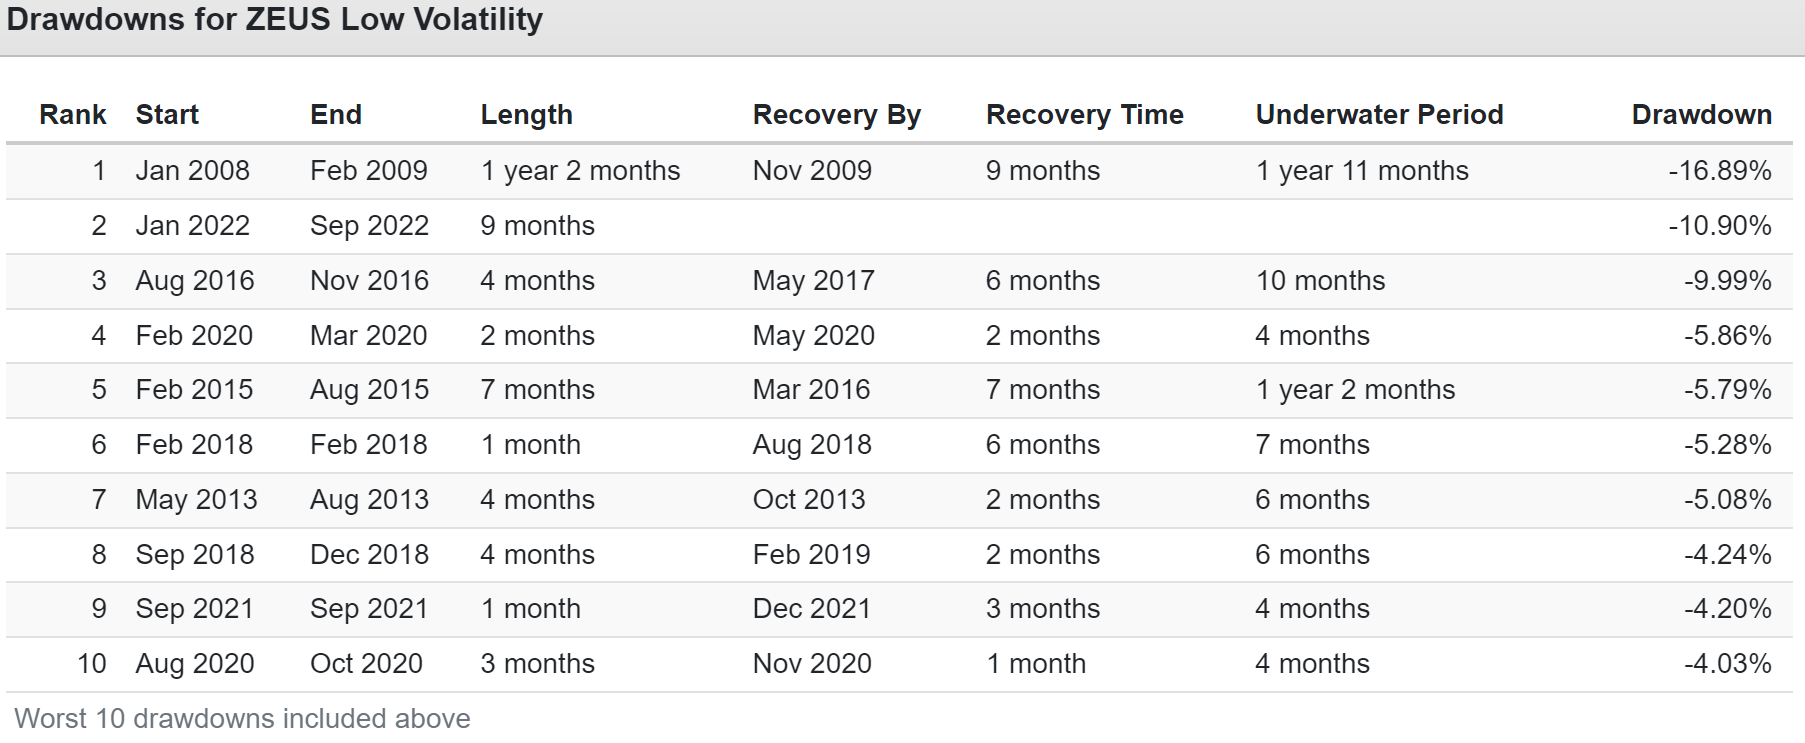
The S&P has had four bear markets in 15 years and a 60/40 two. ZEUS low vol has had none. Not even the 2nd worst market crash in history was able to cause a bear market in this low-volatility portfolio.
ZEUS Low Volatility During The Great Recession
(Source: Portfolio Visualizer Premium)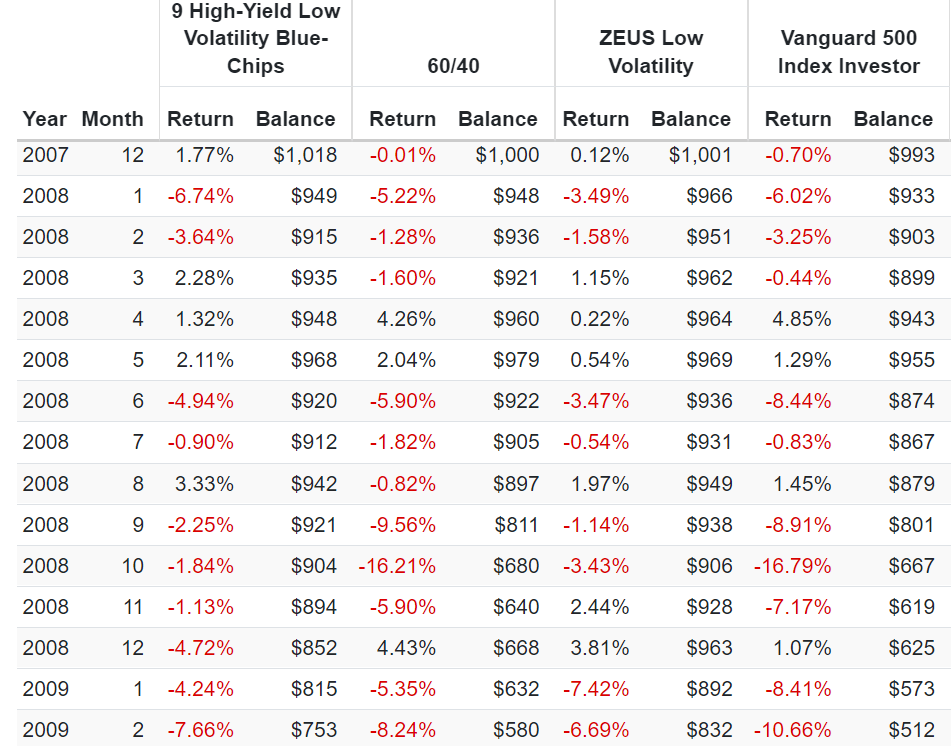
The peak intra-day decline for the S&P during the GFC was -58% and -44% for the 60/40. ZEUS low vol fell a peak of 17%, including falling just 3% during October 2008, when the S&P fell 17% and the 60/40 16%.
ZEUS Low Volatility During The 2011 Bear Market
(Source: Portfolio Visualizer Premium)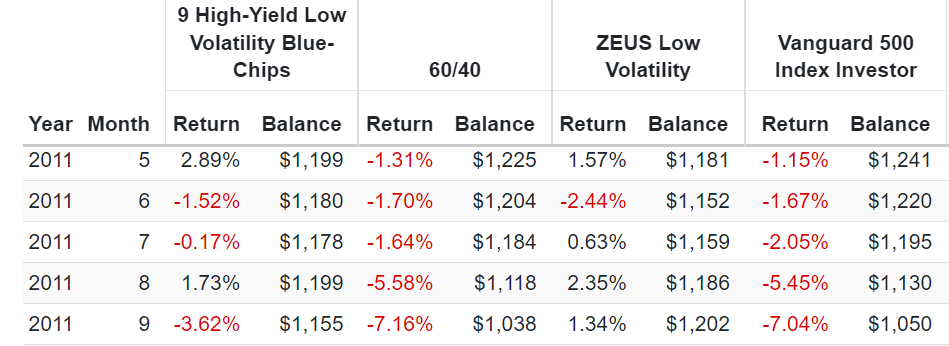
The market’s peak decline in the 2011 bear market was -22%, and a 60/40 fell 16%. ZEUS? Up 3%, so like riding over a market pothole in a hovercraft.
ZEUS Low Volatility During The 2018 Bear Market
(Source: Portfolio Visualizer Premium)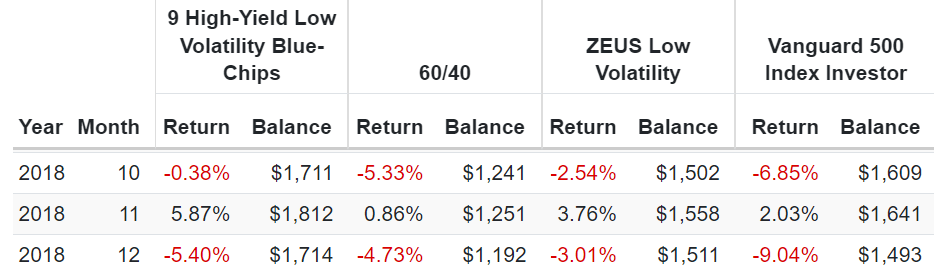
During the 2018 bear market, the S&P hit a peak intraday low of -21% and the 60/40 -9%. ZEUS fell 2% and fell 3% when the market fell 9% in December.
ZEUS Low Volatility During The Pandemic
(Source: Portfolio Visualizer Premium)
How does a 6% decline in the Pandemic sound? Half that of a 60/40?
ZEUS Low Volatility During The 2022 Bear Market
(Source: Portfolio Visualizer Premium)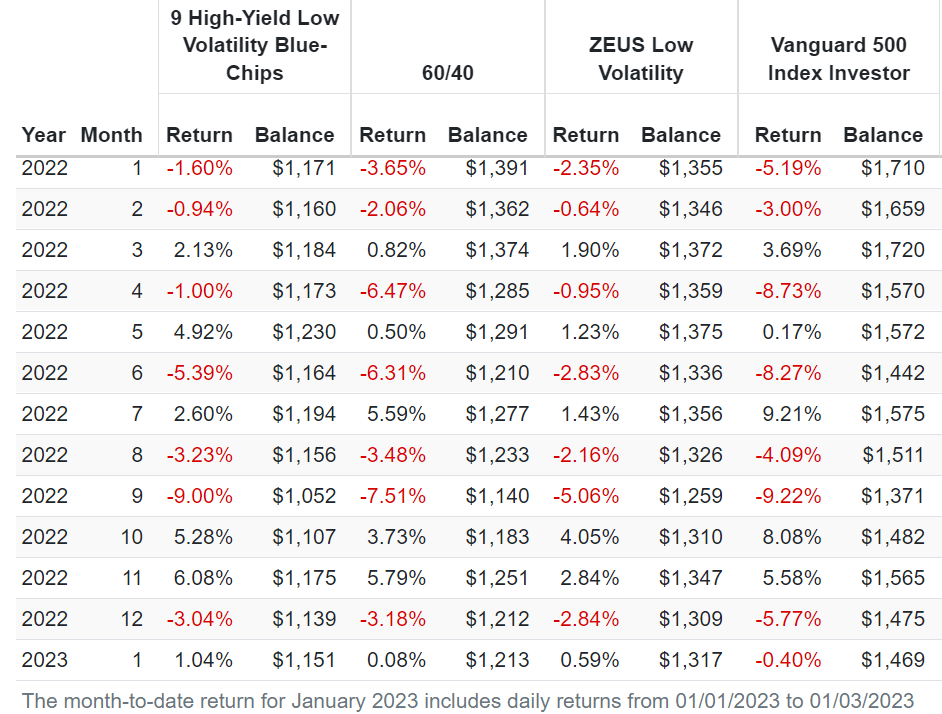
The peak declines in the 2022 bear market so far?
- Nasdaq -35%
- S&P -28%
- 60/40 -21%
- ZEUS low volatility -9%
Do you see a pattern here?
ZEUS Low Volatility Bear Market Peak Declines
| Bear Market | ZEUS Low Volatility | 60/40 | S&P |
| 2022 Stagflation | -9% | -21% | -28% |
| Pandemic Crash | -6% | -13% | -34% |
| 2018 | -2% | -9% | -21% |
| 2011 | 3% | -16% | -22% |
| Great Recession | -17% | -44% | -58% |
| Average | -6% | -21% | -33% |
| Average Decline vs. Benchmark | NA | 30% | 19% |
(Source: Portfolio Visualizer Premium)
How does an average bear market peak decline of 6% strike you? Not even a correction while the market is down 33%, and a 60/40 is in a bear market.
70% smaller declines than a 60/40 and 81% smaller than the S&P? All with 2.5X the yield of the S&P and similar long-term return potential.
OK, so ZEUS’s historical returns are incredible. But what about the future?
Stress Testing The Future
Every registered investment advisor, including Ritholtz Wealth Management, uses some version of Monte Carlo simulations when doing retirement planning.” – Ben Carlson
- long-term Monte Carlo simulation use statistics and past historical returns, and volatility data to run thousands of simulations about what’s likely to happen in the future
- as long as the future isn’t more extreme than the last 15 years, this is the best way to estimate the probability of likely return ranges, volatility, and the probability of achieving your investment goals.
The last 15 years have seen:
- the 2 worst Recessions since the Great Depression
- the 2nd worst market crash in history
- the fastest bear market in history
- the strongest 12-month rally-month history (70%)
- inflation ranging from -3% to 9%
- 10-year treasury bond yields ranging from 0.5% to 6%
- Fed funds rate from 0% to 4.25%
Unless you think the future will be more extreme than this, a 10,000 75-year Monte Carlo simulation is statistically the best way to forecast the likely future.
- a 75-year time horizon provides more extreme ranges of potential outcomes
- the ultimate stress test for a “forever portfolio.”
- If your portfolio does well in a 75-year Monte Carlo simulation, it will likely do even better over shorter time frames
Why?
Is a 50% market crash more likely to happen in the next 10 years? Or the next 75 years?
- The longer the time frame, the more likely we’ll see extreme market conditions
(Source: Portfolio Visualizer Premium)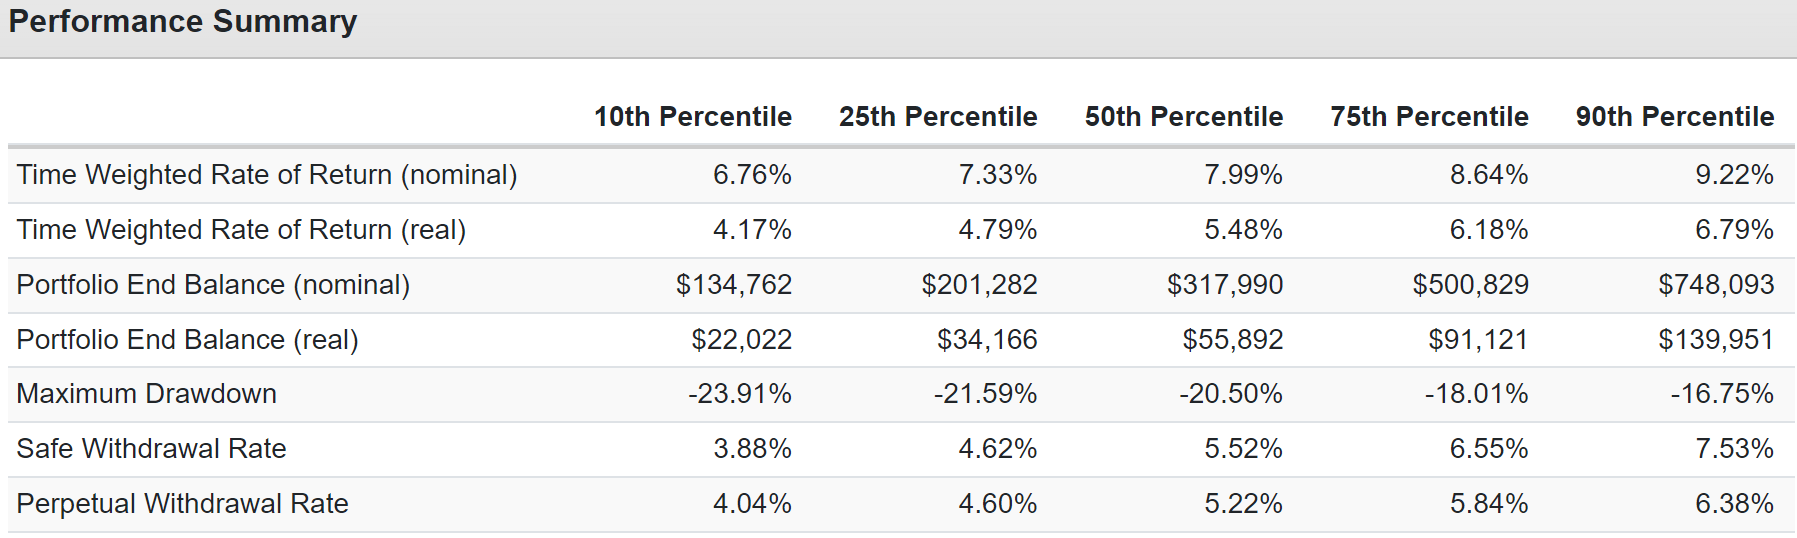
ZEUS low volatility offers a 90% statistical probability of:
- 6.7+% long-term returns vs. 9.0% consensus and 7.2% 60/40
- 4.2+% long-term inflation-adjusted returns vs 6.6% consensus and 4.8% 60/40
- 4+% perpetual safe withdrawal rate vs. 4% consensus and 2.8% 60/40 consensus
(Source: Portfolio Visualizer Premium)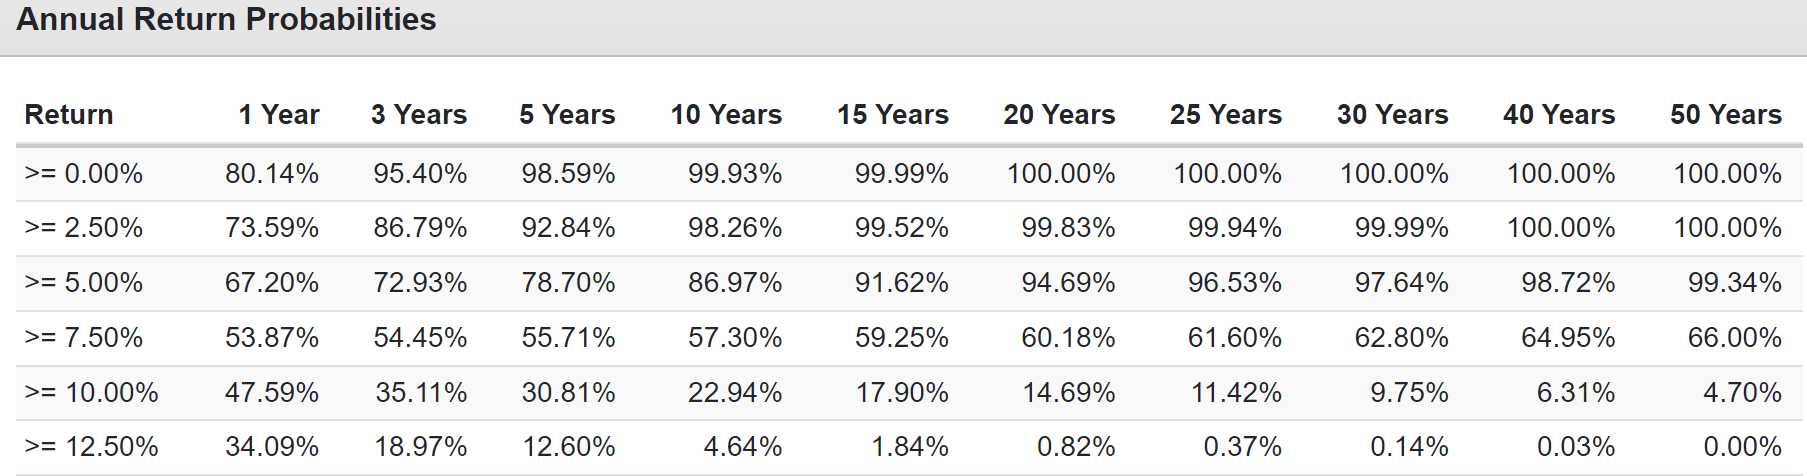
Remember that the average investor has underperformed a 60/40 for the last 20 and 10 years, even with a raging bull market at their backs.
Suppose we define success as beating a 60/40, with a 7.2% historical and consensus future return. In that case, ZEUS low volatility has a more than 66% statistical chance of success over the next 50 years.
And what about bear markets where ZEUS low volatility shines brightest?
(Source: Portfolio Visualizer Premium)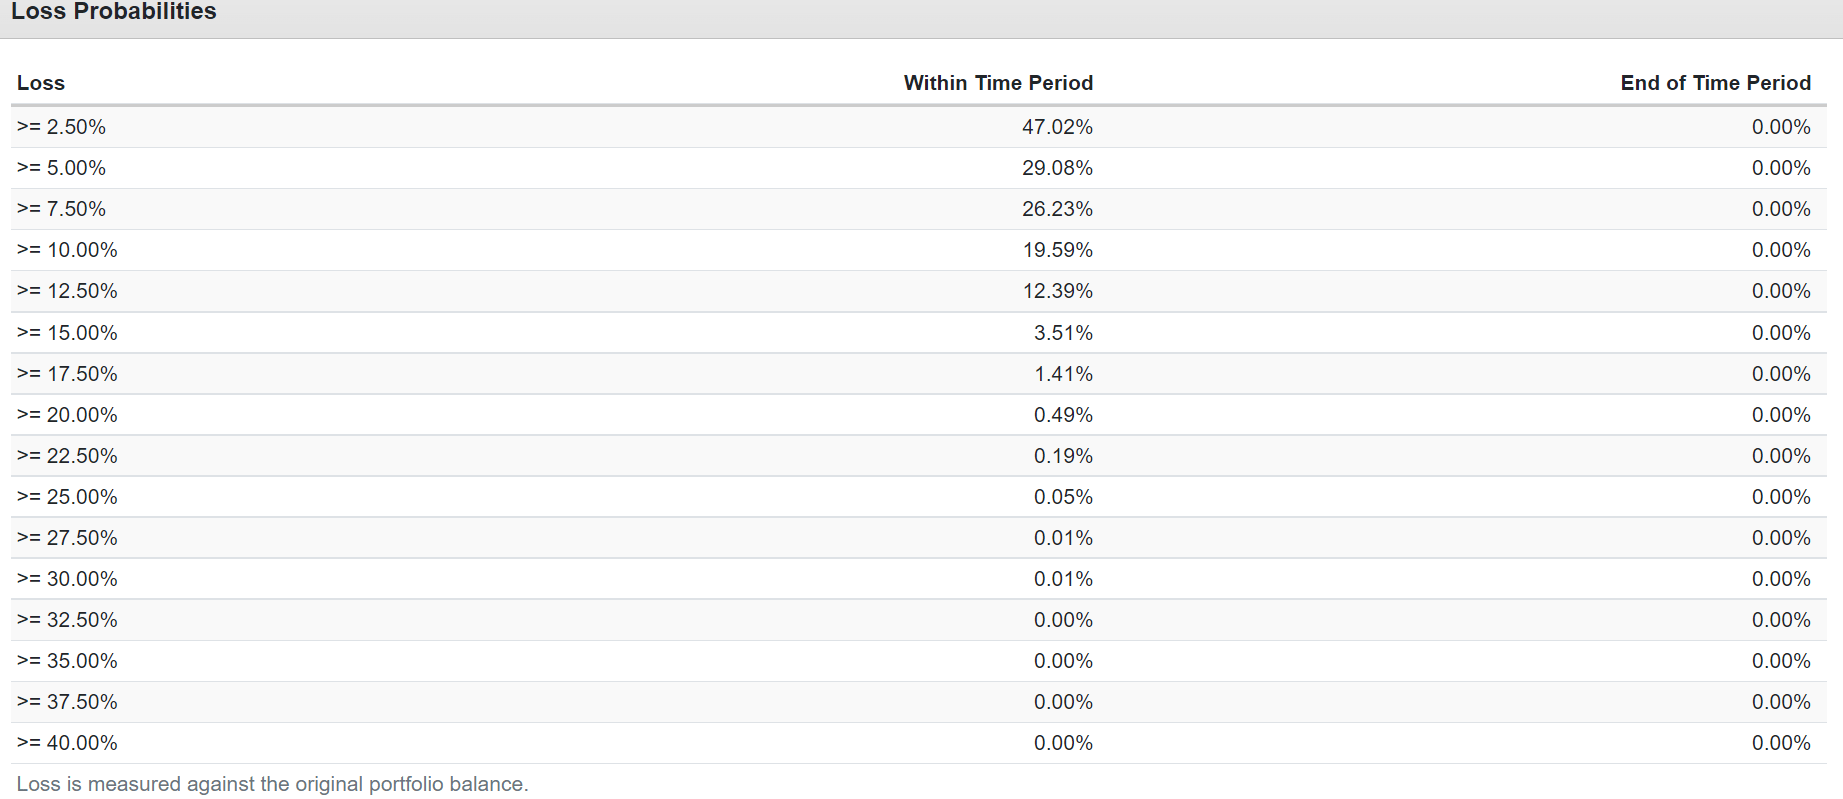
The probability of ZEUS low volatility falling 32.5% or more is statistically zero over the next 75 years.
- 60/40 fell 44% in the great recession
- and 62% during the Great Depression’s 87% plunge in US stocks
What does this really mean?
ZEUS Low Volatility Bear Market Probabilities Over The Next 75 years
| Bear Market Severity | Statistical Probability Over 75 Years | 1 In X Probability | Expected Every X Years |
S&P More Likely To Suffer X% Decline In Any Given Year |
| 20+% | 0.49% | 204 | 15,306 | 2,551 |
| 25+% | 0.05% | 2000 | 150,000 | |
| 30+% | 0.01% | 10000 | 750,000 | |
| 35+% | 0.00% | Never | Never | |
| 40+% | 0.00% | Never | Never | Infinite |
(Source: Portfolio Visualizer Premium)
In any given year, ZEUS low volatility is 2,551 times less likely than the S&P to suffer a bear market and infinitely less likely to suffer a 40+% crash.
In fact, the probability of a 20+% bear market in the next 75 years is less than 1 in 200. You should expect a bear market in this portfolio approximately once every 15,306 years.
If this portfolio ever suffers a 40+% crash, it means the world has ended, and we’re all too dead to care.
Bottom Line: These 14 High-Yield Blue-Chips Are Perfect For A Potential Crash In The Next Few Months
Stocks will likely fall 10% to 20% in the coming months. Many investors are going to make costly mistakes, like panic selling, likely days or weeks from the final bottom.
They’ll lock in their losses just before a brand new bull market begins. Then they’ll sit in cash and watch the face-ripping rally pass them buy.
Why have I been showing investors like you how to build low-volatility ZEUS portfolios for a year? Because most investors can’t stand volatility and turn to market timing.
JPMorgan Asset Management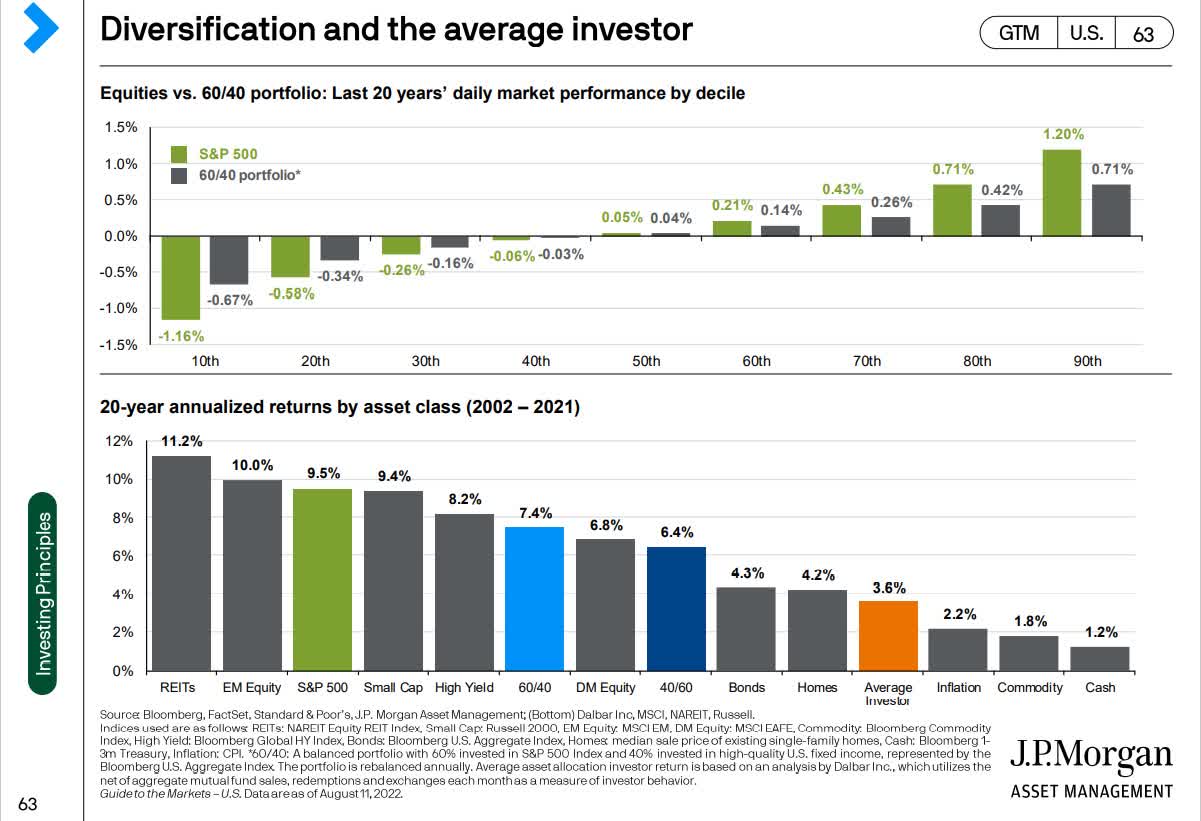
Over the last 20 years, market timing cost investors like you 2/3rd of their returns.
JPMorgan Asset Management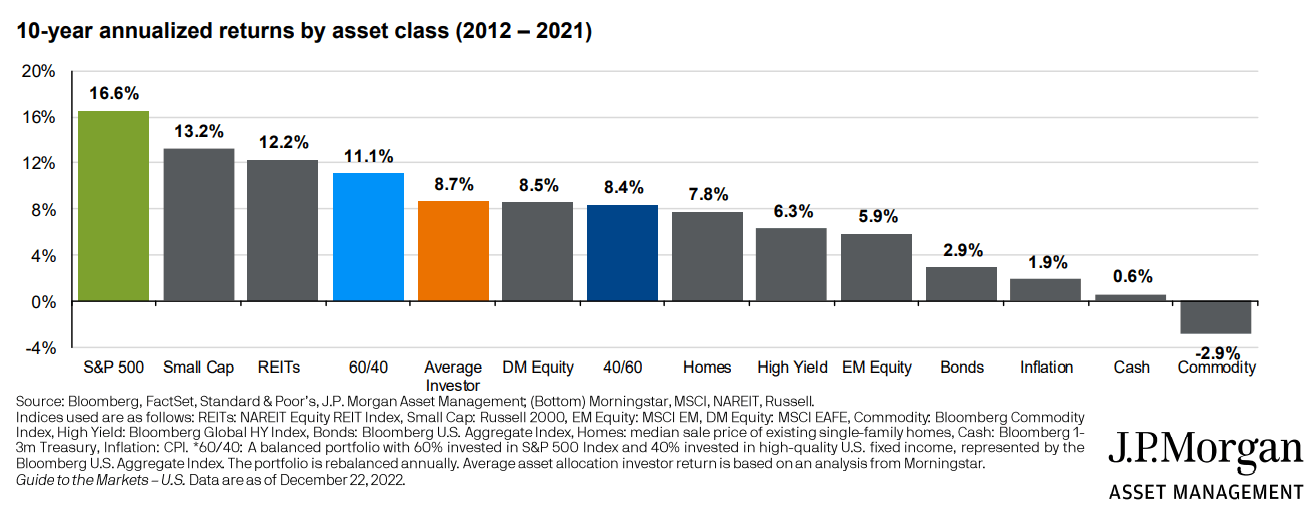
Over the last ten years, during one of the best bull markets in history, the average investor left 50% of the market’s returns on the table. They even lost to a 60/40.
- ZEUS beats a 60/40 and a 60/40 beats most investors
In other words, don’t worry about achieving the maximum possible return. Focus on what you need to achieve the best safe income and returns that work for your temperament and risk profile.
ZEUS Low Volatility Bear Market Peak Declines
| Bear Market | ZEUS Low Volatility | 60/40 | S&P |
| 2022 Stagflation | -9% | -21% | -28% |
| Pandemic Crash | -6% | -13% | -34% |
| 2018 | -2% | -9% | -21% |
| 2011 | 3% | -16% | -22% |
| Great Recession | -17% | -44% | -58% |
| Average | -6% | -21% | -33% |
| Average Decline vs. Benchmark | NA | 30% | 19% |
(Source: Portfolio Visualizer Premium)
4.2% yield, 9% long-term returns, 50% lower volatility than the market over time, and 81% smaller declines in even the most extreme market crashes.
This is what you can do when you combine the world’s best low-volatility, high-yield blue-chip assets.
Blue-Chip Bucket
- CLX
- WEC
- NVS
- FTS
- NWN
- LNT
- TU
- RBGLY
- UL
ETF Bucket
- SCHD
- VHT
- IYK
Hedging Bucket
- EDV
- DBMF
There are your 14 high-yield blue-chips that together can create the ideal high-yield portfolio for not just the rest of this bear market but every bear market we’re facing in the future.
Would you like to laugh at bear markets all the way to the bank? Sleep well at night while rolling in safe and growing dividends?
Well, my friends, this is how you do that. Not just in this bear market but in all the ones that are certain to come in the future.
What’s the secret to retiring rich and staying rich in retirement? It’s not market timing, it’s not speculative investment strategies; it’s these six fundamentals.
- the right asset allocation for your risk profile
- the right blue-chip assets for your risk profile
- sufficient yield for your goals
- sufficient growth for your goals
- reasonable to attractive valuation
- periodic rebalancing (annually is the most tax-efficient and works best for most people)
These are the fundamentals that drive 97% of long-term returns. If you master them, then retiring in safety and splendor isn’t a matter of luck, just time and patience.
Editor’s Note: This article discusses one or more securities that do not trade on a major U.S. exchange. Please be aware of the risks associated with these stocks.
Be the first to comment