


Deagreez
Like Warren Buffett, my investing strategies have evolved. Buffett began by hunting for “cigar butts” in the traditional deep-value style of Ben Graham, his mentor.
In the 1930s, 1940s, 1950s, and even 1960s, information was so scarce on Wall Street that he had to write to companies requesting their annual reports.
Many poorly managed companies had more net cash on their balance sheets than their market cap back then. This is Ben Graham’s original concept of “net net” investing, meaning that the company’s liquidation value was greater than its market cap.
Or, to put it simply, a company so cheap that if you buy all its shares, sell off all assets, and pay off all debts, you instantly make a profit.
This is why Graham’s first edition of The Intelligent Investor focused on book value. In the 1930s, there was no such thing as analyst consensus forecasts or the cornucopia of data we use today.
There was the past, the present, and a future no one even tried to predict. But when you could buy $1 in value for $0.50, or even $0.25 in some cases.
That’s how Ben Graham started, made his career, and taught his students at Columbia Business School, including Buffett?
Don’t speculate, find companies no one knows about, trading for steep discounts to book value, and then make a very low risk 100% to 400% gain by acquiring the company and liquidating its assets or just instituting dividends.
This is the strategy that “corporate raiders” used in the 1980s with leveraged buyouts: Borrowing money to buy a company with more net cash than the market cap for a quick profit.
The Problem With Cigar Butt Investing Today
Even Graham admitted that markets change over time. In the following editions of The Intelligent Investor, he switched from recommending book value cigar butt investing to a focus on price/fundamentals like cash flow, earnings, and dividend yields.
That’s because, by the 1970s, the world was a much different place. Wall Street had evolved with its professional class, with thousands of analysts covering companies for a living.
We now had relatively accurate forecasts (or at least reasonable ones), and participation in the stock market had soared.
Back in the 1930s and 1940s, we didn’t even have historical stock market data. If you want to know the stock market’s historical returns? No one could tell you. That’s why stocks historically yielded more than bonds. Because no one knew whether equity risk was worth it and so dividends were the only tangible way to measure potential future returns.
Ritholtz Wealth Management
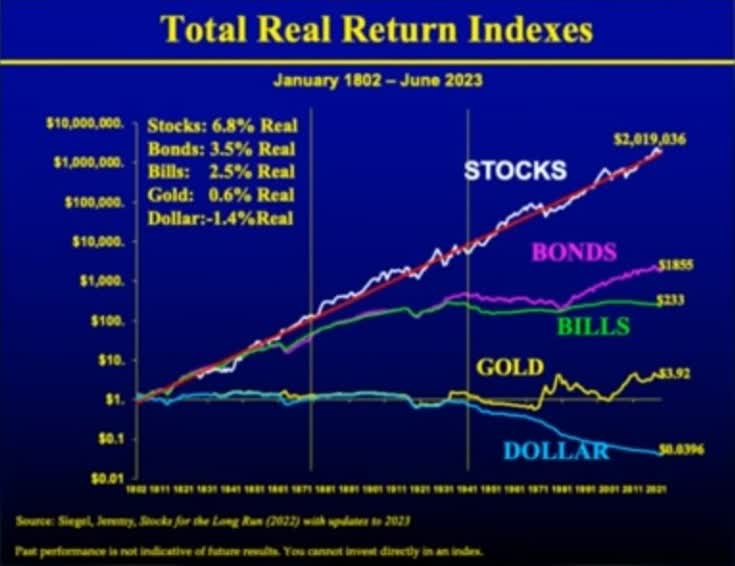
We later learned that stocks were the best-performing asset class in history, delivering 10% annual returns or 6.8% annual inflation-adjusted returns since 1802.
- $1 invested in 1802 (had the S&P index existed) would be worth more than $2.8 million today, adjusted for inflation.
- This is why Ben Franklin believed in “investing to give” and did so with Boston and Philadelphia in his will (though with bonds, not stocks).
OK, so today, we are awash in publicly available information. It’s illegal for someone to trade stocks with insider information, and theoretically, there is no way to earn “alpha” anymore.
- The Efficient Market hypothesis.
In reality, however, there still is because everyone’s goals differ.
Why Value Investing Isn’t Dead... Just Harder
If every investor in the world had the same goals, they would use almost identical strategies. Then, the efficient market hypothesis would be almost entirely correct.
At all times, the price of every stock would be nearly instantaneously priced in all available information. There would be no way to earn an advantage because every investor was a total return optimizing, emotionless robot acting on pure logic and running the same algorithms.
Humans are not emotionless robots running identical algorithms.
The day trader trying to earn 1% gains on dozens or hundreds of trades daily differs greatly from a pension fund trying to earn 7% per year over centuries.
The Yale Endowment Fund doesn’t have to impress its investors every quarter like Bridgewater, the world’s largest hedge fund, does.
The retiree living off dividends has a different goal than high-growth gunslingers like Cathie Wood, who seek to earn as much as 45% annual returns over the next five years with her investments.
And let’s not forget that in the short term, valuations often become disconnected from fundamentals due to momentum, sentiment, and luck.
Dividend Kings S&P Valuation Tool
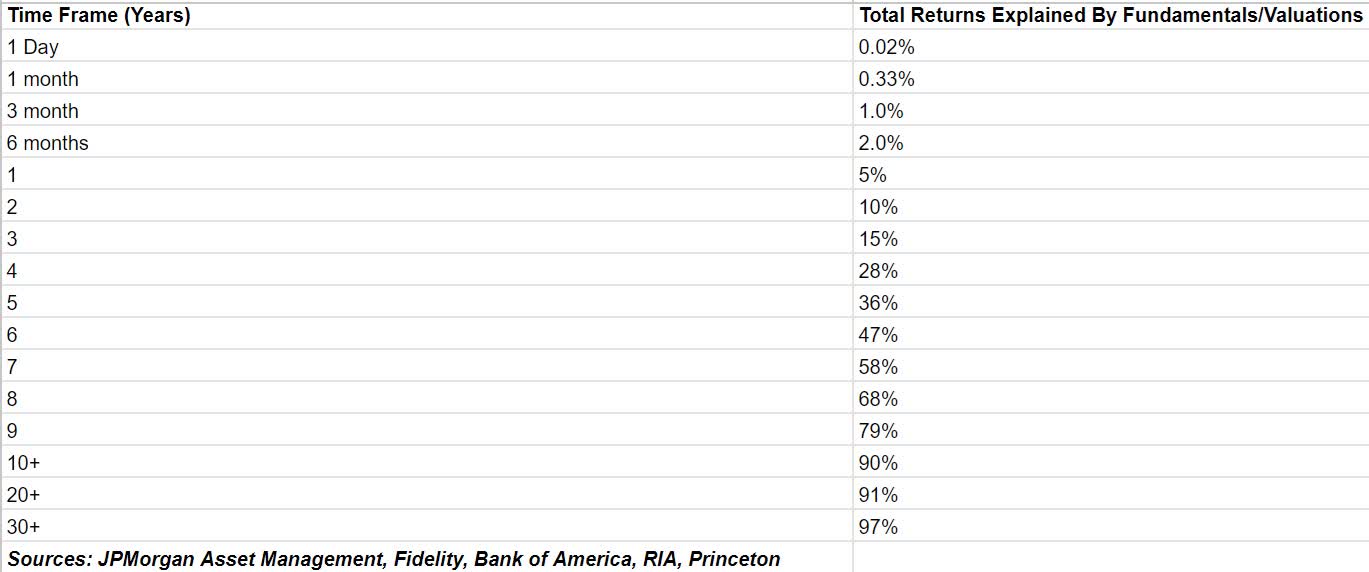
According to JPMorgan’s research, there’s a 95% chance that a stock return is based on luck and sentiment in any 12 months.
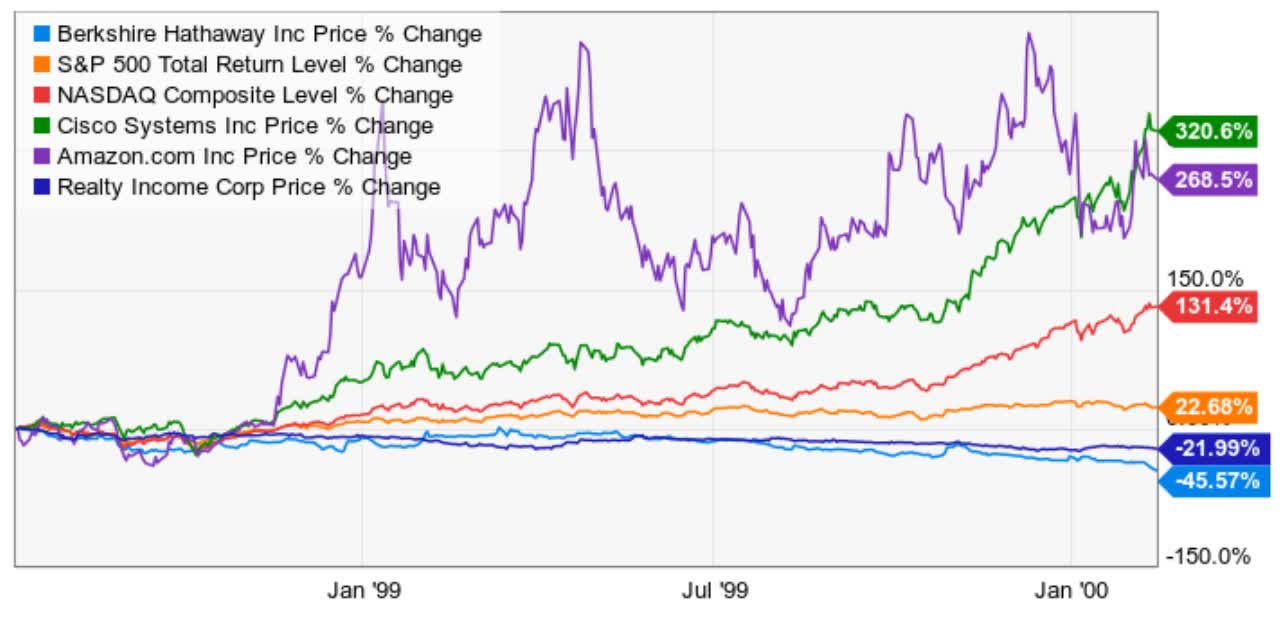
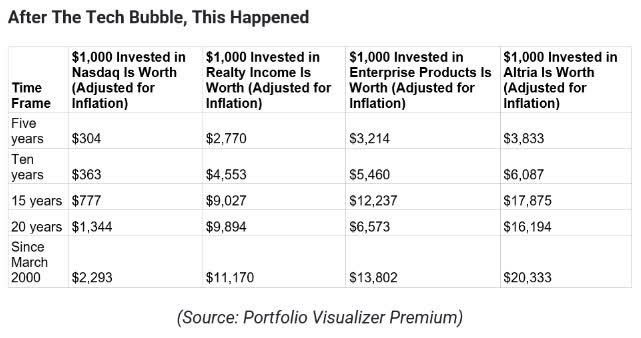
That explains why, during the tech bubble of the late 1990s, blue chips like Berkshire were cut in half while the Nasdaq tripled.
Ycharts
Did Berkshire (BRK.A) (BRK.B) or Realty Income’s (O) fundamentals collapse during the tech bubble? Did their earnings and cash flows contract? Did Realty run into tough times and have to cut its dividend?
Ycharts
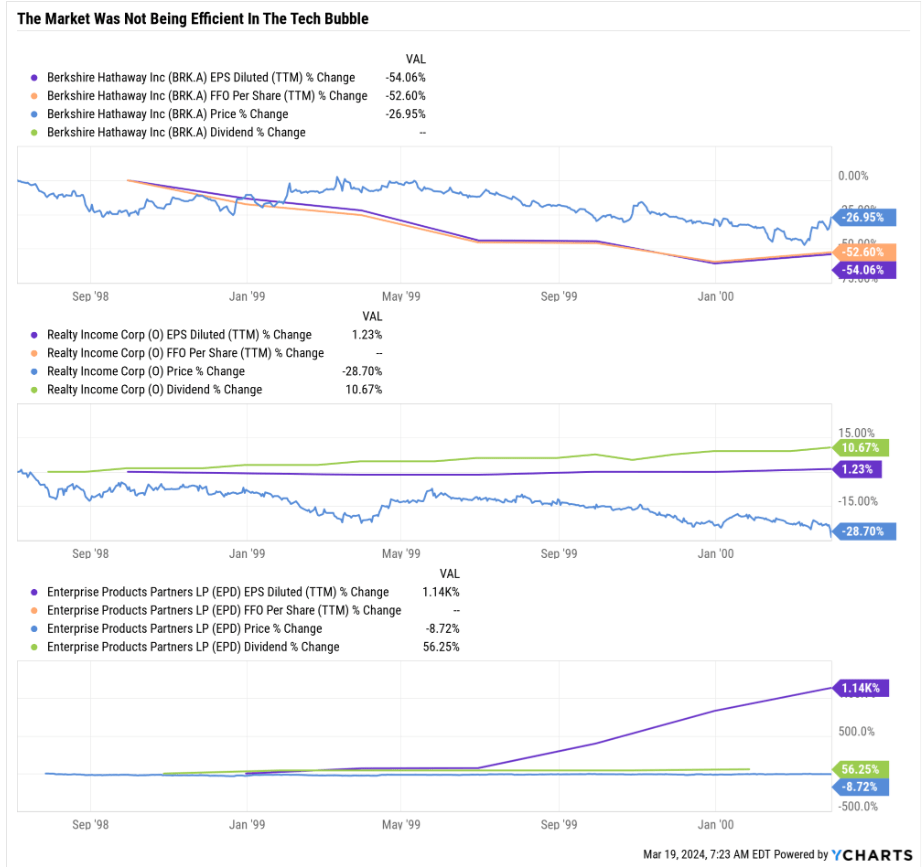
Berkshire’s operating cash flow fell 50% during the tech bubble, though that’s not abnormal for a conglomerate with large insurance holdings.
However, note that Realty Income and Enterprise Products (EPD), whose yield soared 13% in March 2000, did not see cash flow decline. Realty raised its dividend by 11% with stable cash flow, and EPD’s cash flow soared more than 11X, raising its distribution by 56%.
Yet the prices fell for two of the best-run hard-asset businesses in the country.
Yes, Realty Income wasn’t a legendary dividend aristocrat back in 2000. Nor was EPD famous for “being a chess master in an industry where others are playing checkers,” as Morningstar would later describe.
However, their business models were almost identical to today’s, and they did have strong track records of good leadership teams.
- Realty Income was founded as a private REIT in the 1960s and had been paying steadily rising distributions for decades.
- The Duncan family, legendary conservative and successful energy infrastructure investors, founded EPD.
There was nothing to justify O and EPD falling to such absurd valuations as these in March 2000.
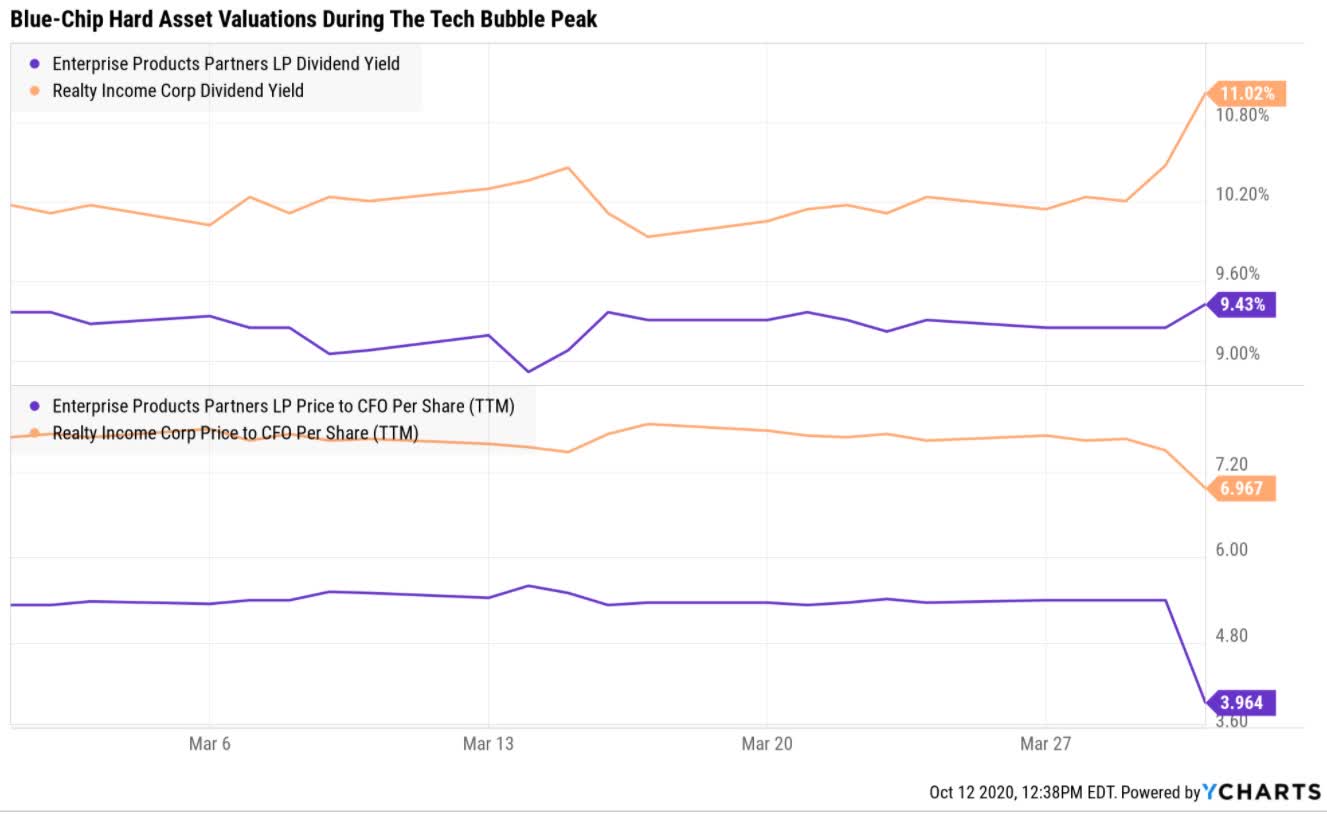
Ycharts
Realty Income at 7X FFO and EPD at 4X operating cash flow?! Were interest rates 20% like in 1981? Nope, 6% rates are not much higher than today.
The only significant difference was investor sentiment.
The tech bubble saw companies with no sales IPO for billions and then soar 2, 3, or even 4X in a day.
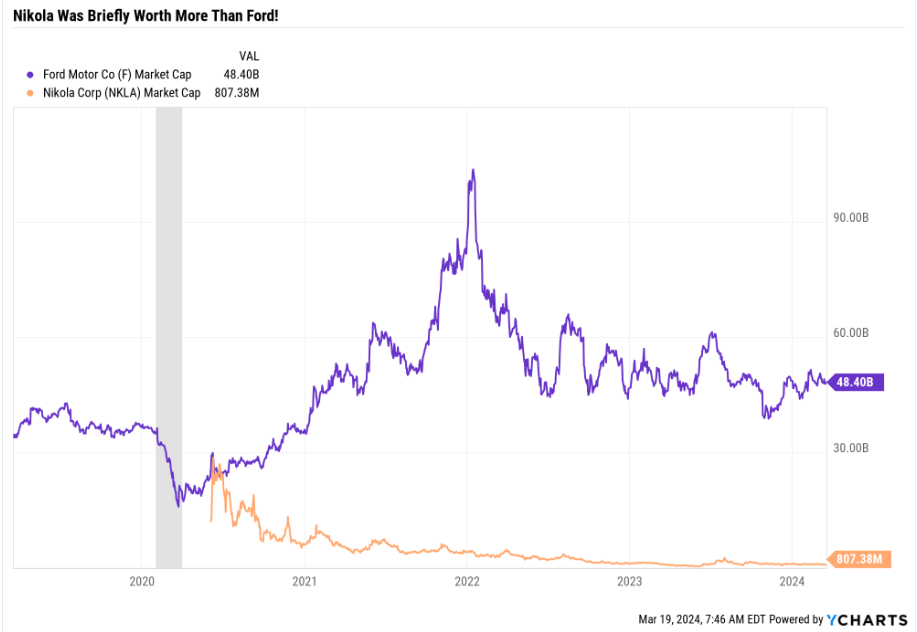
RedHat hit a record of 1,080 sales, a record that was surpassed in the pandemic speculation mania when EV maker Nikola (NKLA) hit $30 billion in market cap on no sales.
Ycharts
That’s one of eight non-Tesla (TSLA) pure EV makers that went to IPO during the pandemic. Most investors are familiar with what happened next.
Sanity Returns To Wall Street
Like Warren Buffett, I used to strive for cigar butt investments. Every investment should be 50% undervalued and be able to double on valuation alone.
But I learned over time that high yield and deep value could be a trap and that safety and quality first, prudent valuation, and sound risk management are always the true keys to retiring rich and staying rich.
Time is the friend of a wonderful business and the enemy of the mediocre.”
It is far better to buy a wonderful company at a fair price, than a fair company at a wonderful price.” – Warren Buffett
The late, great Charlie Munger taught Buffett these principles and elevated his business partner from a great investor to the greatest investor of all time (20.5% annual returns since 1965).
However, even today, Buffett still has a passion for deep-value blue chips, especially high-quality ones. Occidental (OXY) and Chevron (CVX) are just two of Buffett’s biggest holdings that mint free cash flow and have been doing very well in recent years. And it’s not just those two.
Ycharts
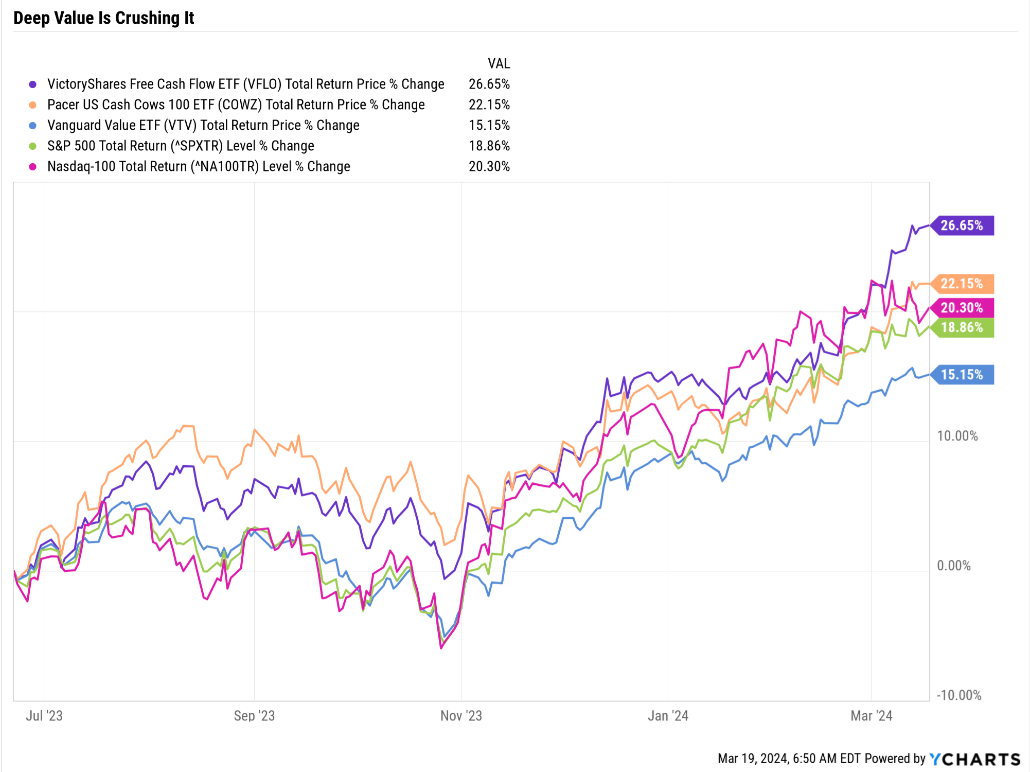
Value continues to underperform the S&P. What else is new? The Mag 7 levitates the S&P, especially the Nasdaq, and nothing can keep up.
Except that deep value, using the most potent valuation metric of all, free cash flow yield, is keeping up. As shown by the ETFs COWZ and VFLO, which I’ll do an updated compare and contrast tomorrow, have beaten the Nasdaq for nearly a year.
The Best Valuation Metric Of The Last 33 Years
Pacer
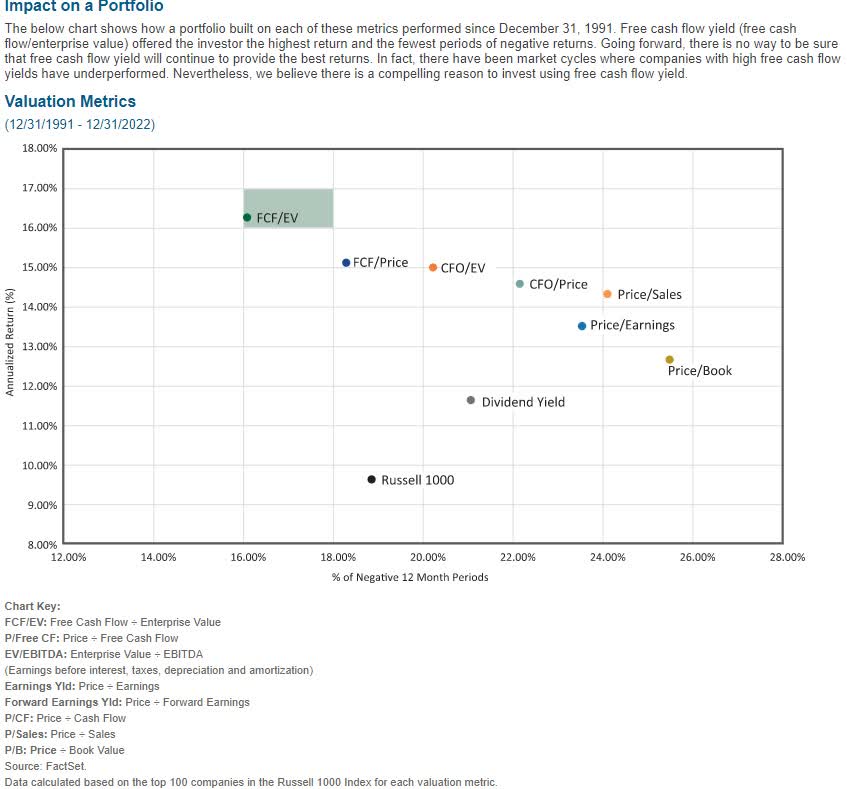
Trailing FCF to enterprise value or free cash flow/(market cap + net debt) has been the best valuation metric since 1990.
The inverse of that is free cash flow yield, Buffett’s favorite valuation metric.
- Free cash flow is “owner earnings,” which business owners can withdraw to spend or buy other companies.
- What Berkshire has been doing for over 50 years.
Today, I wanted to apply the power of free cash flow yield to the Dividend Aristocrats. What are the most Buffett-like, deep-value aristocrats, based on the best value metric? Let’s find out together.
Today’s article is an excellent example of how rules-based investing can be applied to almost any strategy.
I show the power of Joel Greenblatt’s Magic Formula, which beat the market for over 20 years and became even more powerful when enhanced by other quality screens in the above article.
As I’ll show in tomorrow’s article, the ETF VFLO is enhancing the principles of FCF yield with two important improvements. Thus far, the results have boosted the returns of an already proven strategy.
So, let’s do the same by combining the power of free cash flow yield with dividend aristocrats, the most dependable income investments in the world.
Finding The Highest Free Cash Flow Yield Aristocrats
Here’s the simple screen I did to find the ten highest free cash flow yielding aristocrats that are non-speculative blue-chip quality, investment grade, expected to deliver 10%-plus long-term returns.
| Screening Criteria | Companies Remaining | % Of Master List | |
| 1 |
Add ” EV/FCF and 12 month fundamentally justified upside” Under “Columns.” |
0.00% | |
| 2 | Under Lists “Dividend Champions” | 133 | 26.34% |
| 3 | BHS Rating “reasonable buy, good buy, strong buy, very strong buy, ultra value buy” | 80 | 15.84% |
| 4 | Blue-Chip Quality Or Better(10+ Quality) | 72 | 14.26% |
| 5 | Credit Rating Investment Grade (BBB- or better) | 55 | 10.89% |
| 6 | LT Total Return Potential 10+% | 27 | 5.35% |
| 7 | Non-Speculative | 25 | 4.95% |
| 7 |
Sort By FCF Yield |
0.00% | |
| 8 | Use the 10th highest FCF yield (5%) as the cutoff in “FCF Yield” to isolate these companies | 13 | 2.57% |
| Total Time | 2 minutes |
So what are these 13 deep-value aristocrats?
13 Buffett-Style Deep Value Dividend Aristocrats Yielding As Much As 9%
First, let’s look at these impressive companies’ fundamentals.
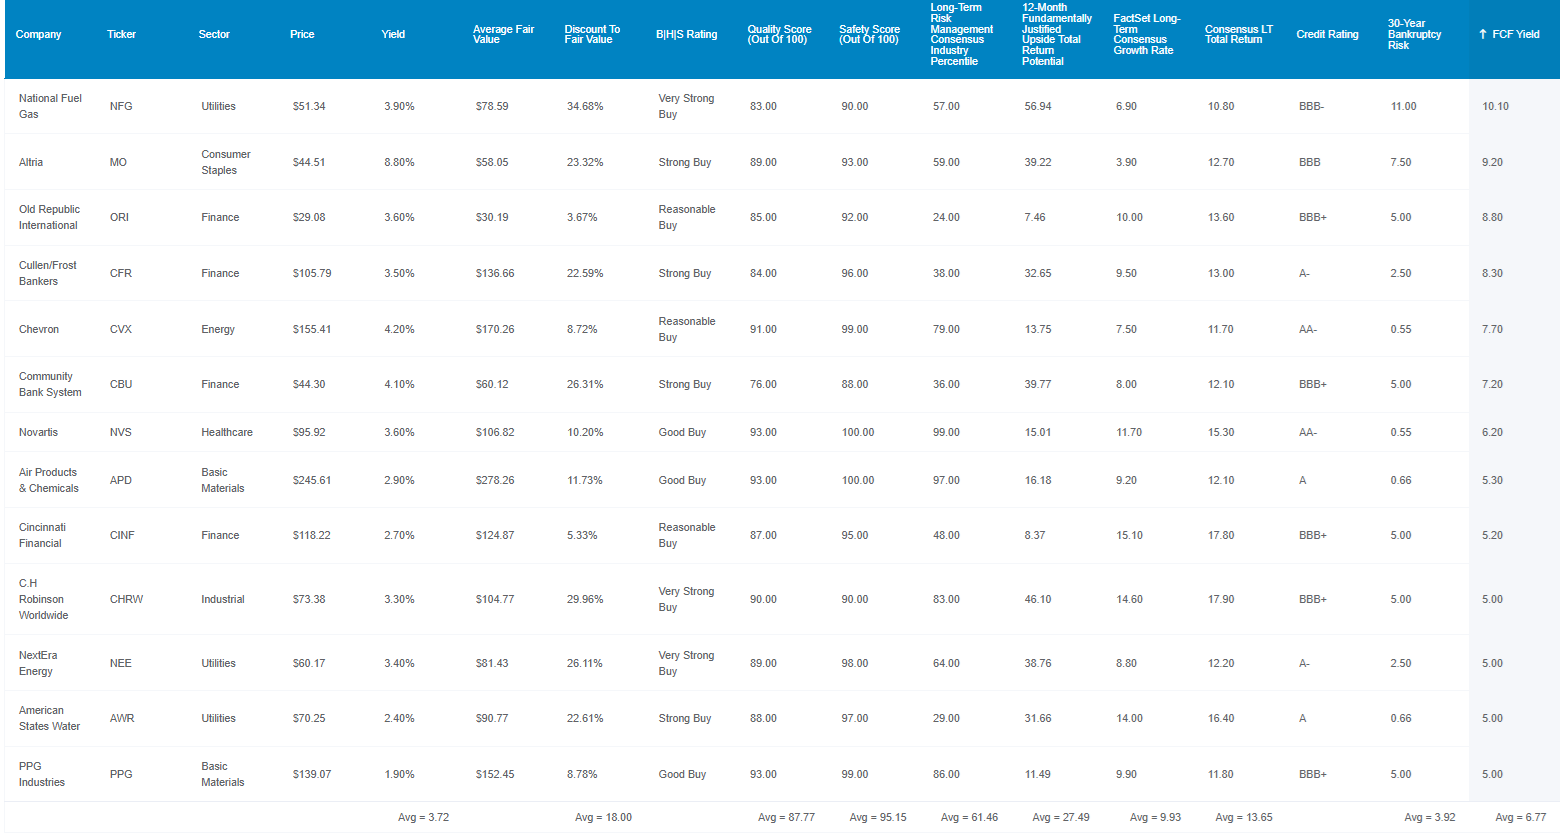
Dividend Kings Zen Research Terminal
The yield of 3.7% is on par with popular high-yield ETFs like SCHD.
The discount to fair value averages 18%, while the S&P is 4% overvalued.
The dividend safety score of 95% indicates a less than 2% probability of a dividend cut even in another Great Recession-level downturn and just a 0.5% risk of a cut in a normal economy.
The S&P 61st percentile long-term risk management score indicates that based on 1,000 metrics, these companies are in the top 39% of companies worldwide in risk management (above average).
They collectively have a 28% fundamentally justified 12-month return potential.
- Not a forecast.
- If these companies grow as expected for the next 12 months and if and only if they return to historical, market-determined average valuation multiples, you would expect this return.
- 28% return in 12 months is 100% justified by today’s fundamentals.
9% to 10% earnings and dividend growth is the analyst consensus. And 13% to 14% long-term total returns and income growth for those reinvesting dividends.
That’s better return potential than the Nasdaq’s historical 37-year returns of 13.5%.
3.9% 30-year bankruptcy risk is a BBB+ stable average credit rating, and the 6.7% free cash flow yield compares very favorably to today’s market.
- 6.6% FCF yield vs 5.1% dividend aristocrats vs. 3.3% S&P 500
- 14.9 EV/FCF (cash-adjusted free cash flow multiple) vs 15 private equity vs 20X dividend aristocrats and 30.7X S&P 500
You’re buying some of the world’s most dependable income growth stocks for the same valuations as billionaires getting sweetheart deals in private equity funds.
You’re paying half the valuation of the S&P 500.
And for companies that aren’t “cigar butts.” They aren’t dying businesses but steadily growing ones.
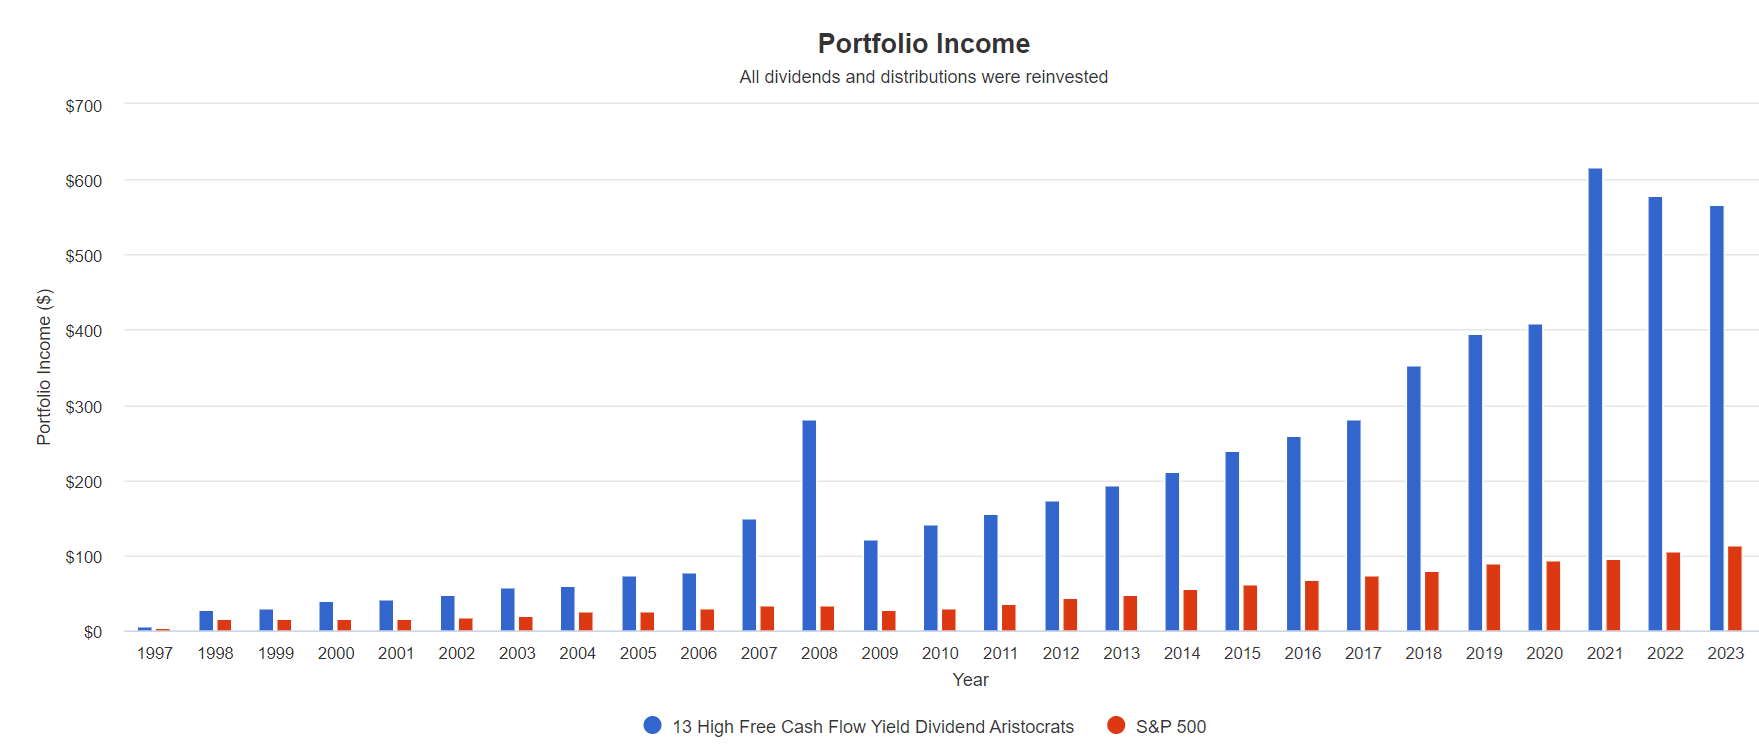
Historical Return Since 1998
Historical returns don’t forecast future returns, but they do give us an idea of whether current analyst consensus forecasts of 13% to 14% are reasonable and historically consistent.
- It also allows us to test the income growth forecast against historical norms.
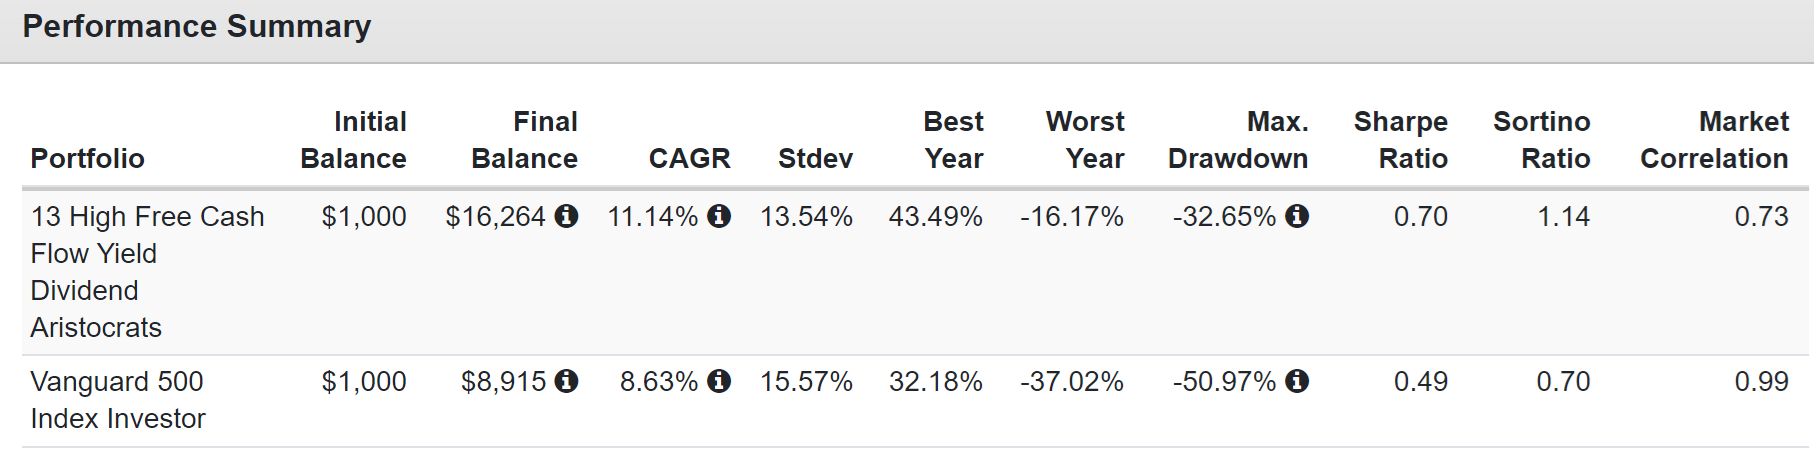
Portfolio Visualizer Premium
Higher returns, lower volatility, and far better negative volatility-adjusted excess returns (Sortino ratio).
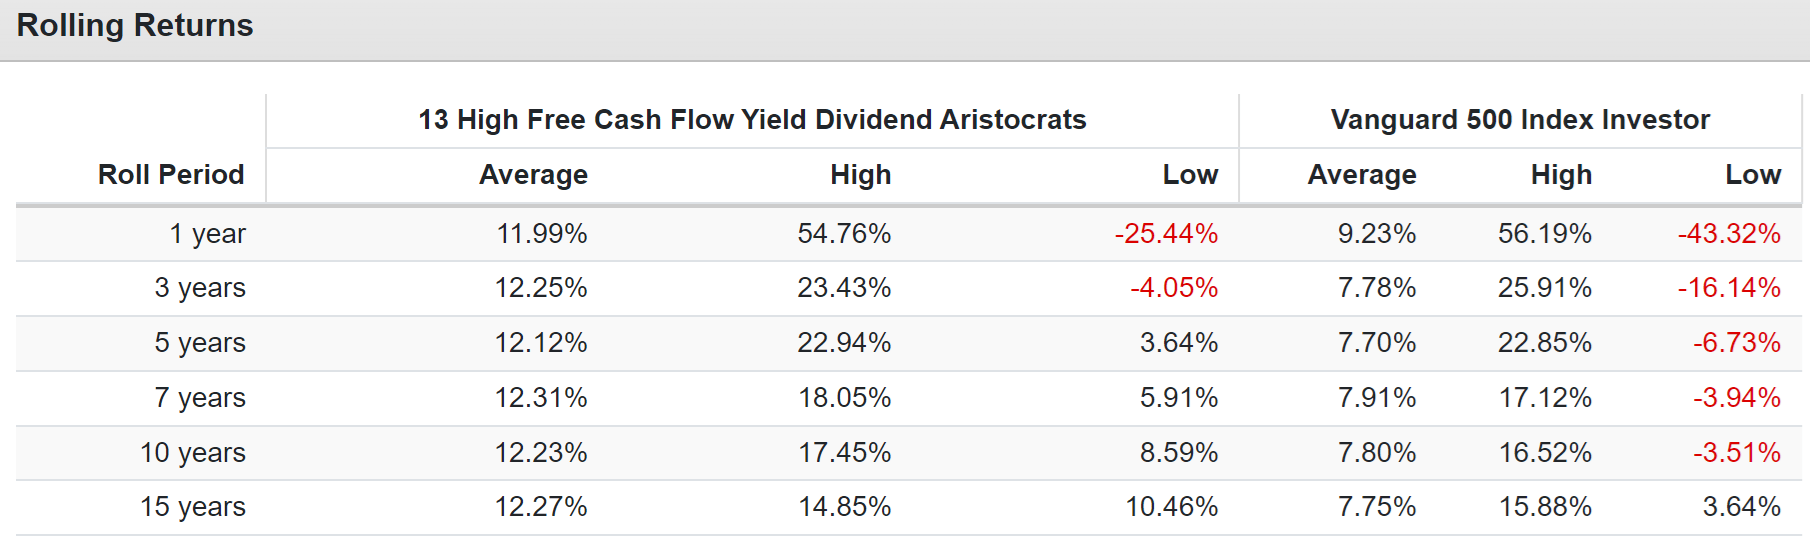
Portfolio Visualizer Premium
Average rolling returns smooth out bear markets (why these companies have such high FCF yields today) and show that current growth forecasts are historically consistent and reasonable.
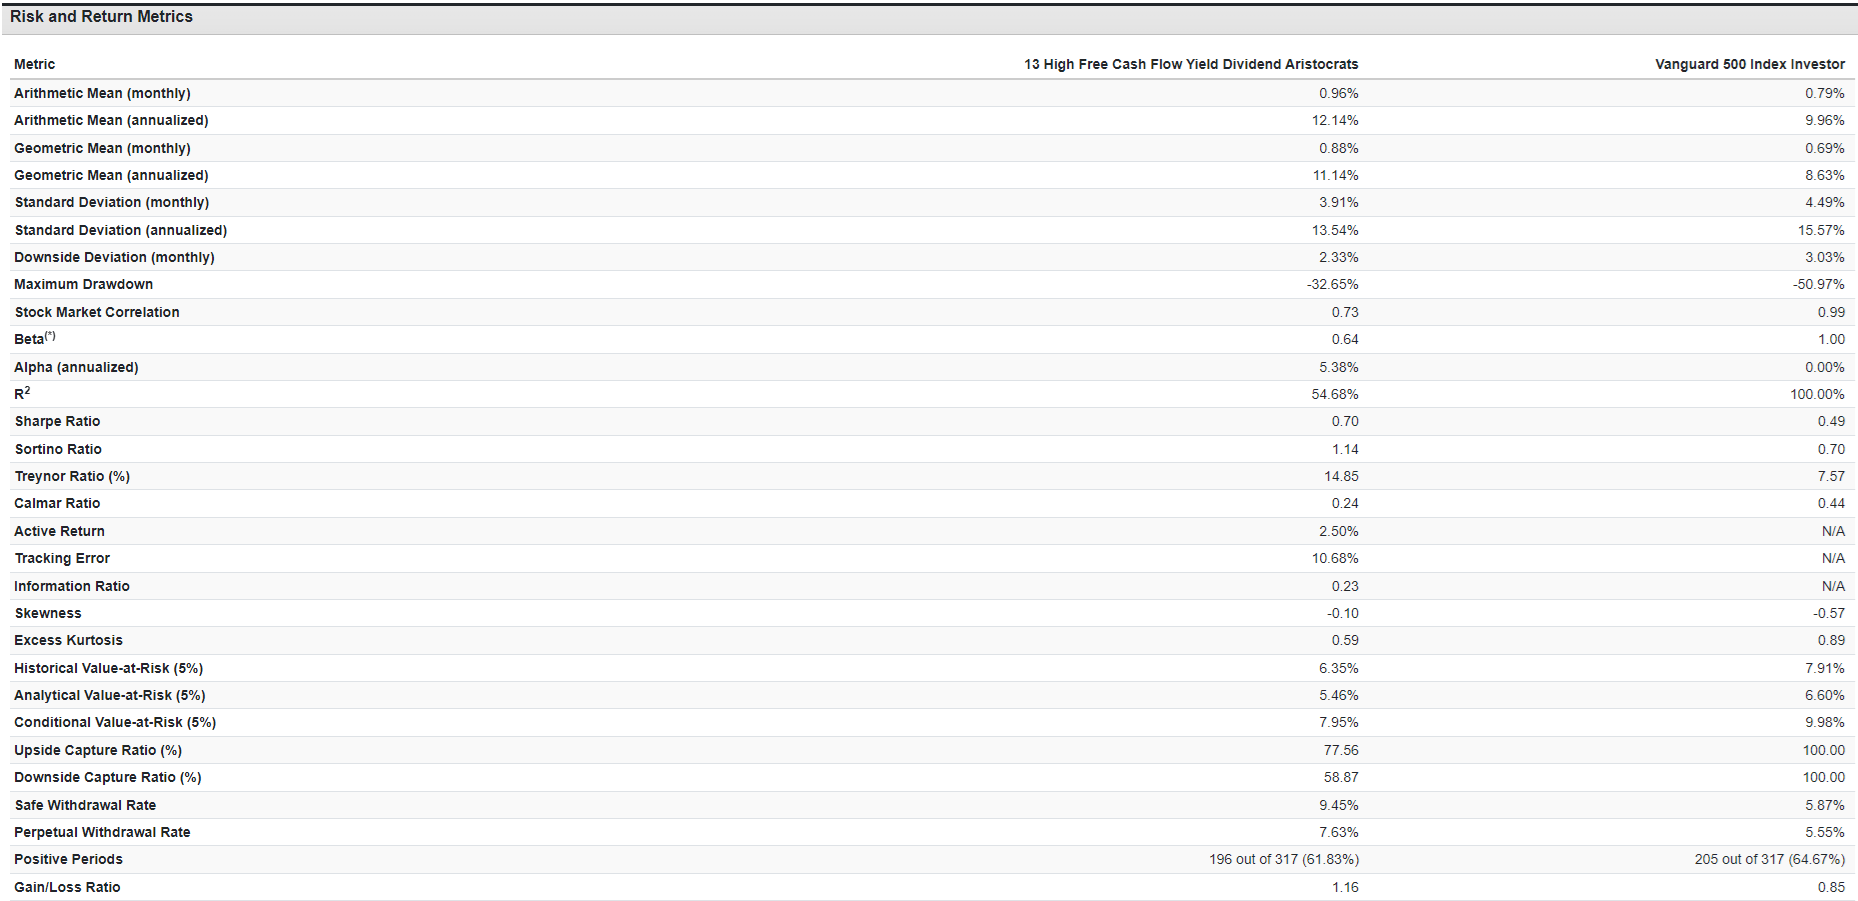
Portfolio Visualizer Premium
The key to these aristocrats outperforming the S&P by an average of 5% per year for decades is capturing 59% of the downside of corrections and 77% of the upside.
Due to that stability and lower volatility, they delivered twice the excess total returns per unit of volatility (Treynor ratio) as the S&P.
And generated a safe perpetual withdrawal rate of 7.4%.
Their annual income growth has been 13.5% CAGR, which is what analysts expect going forward.
13.5% Income Growth For A Quarter Century Vs. 8.5% S&P
Portfolio Visualizer Premium
But you don’t have to wait decades for potentially good returns in these companies.
Consensus Total Return Potential Through 2026
- If and only if each company grows as currently expected (consensus of all analysts) and returns to historical fair value by the end of 2026, these are the returns you could expect.
- It’s not a forecast, just fundamentally justified upside potential.
National Fuel Gas (NFG)

FAST Graphs, FactSet
Altria (MO)
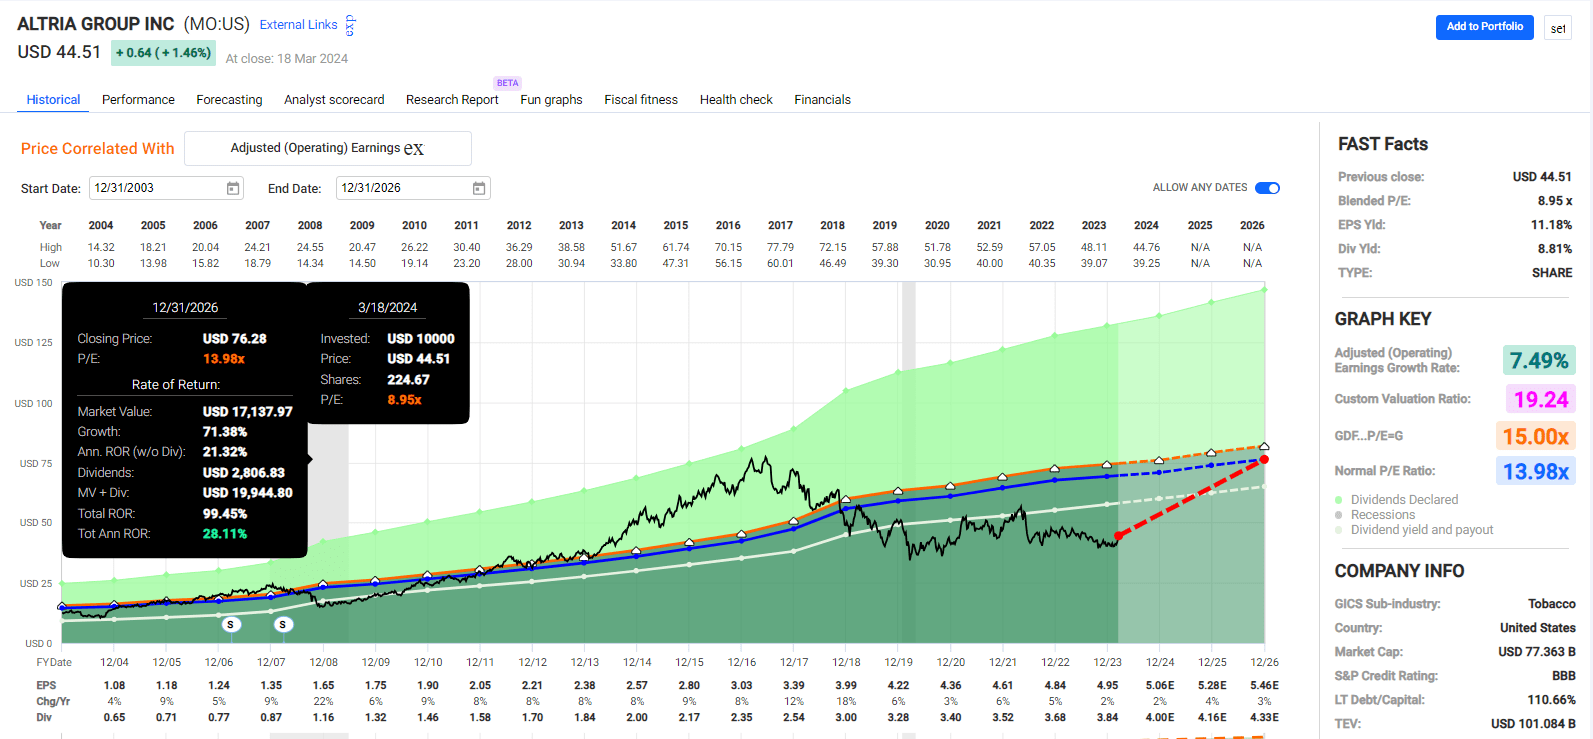
FAST Graphs, FactSet
Old Republic International (ORI)
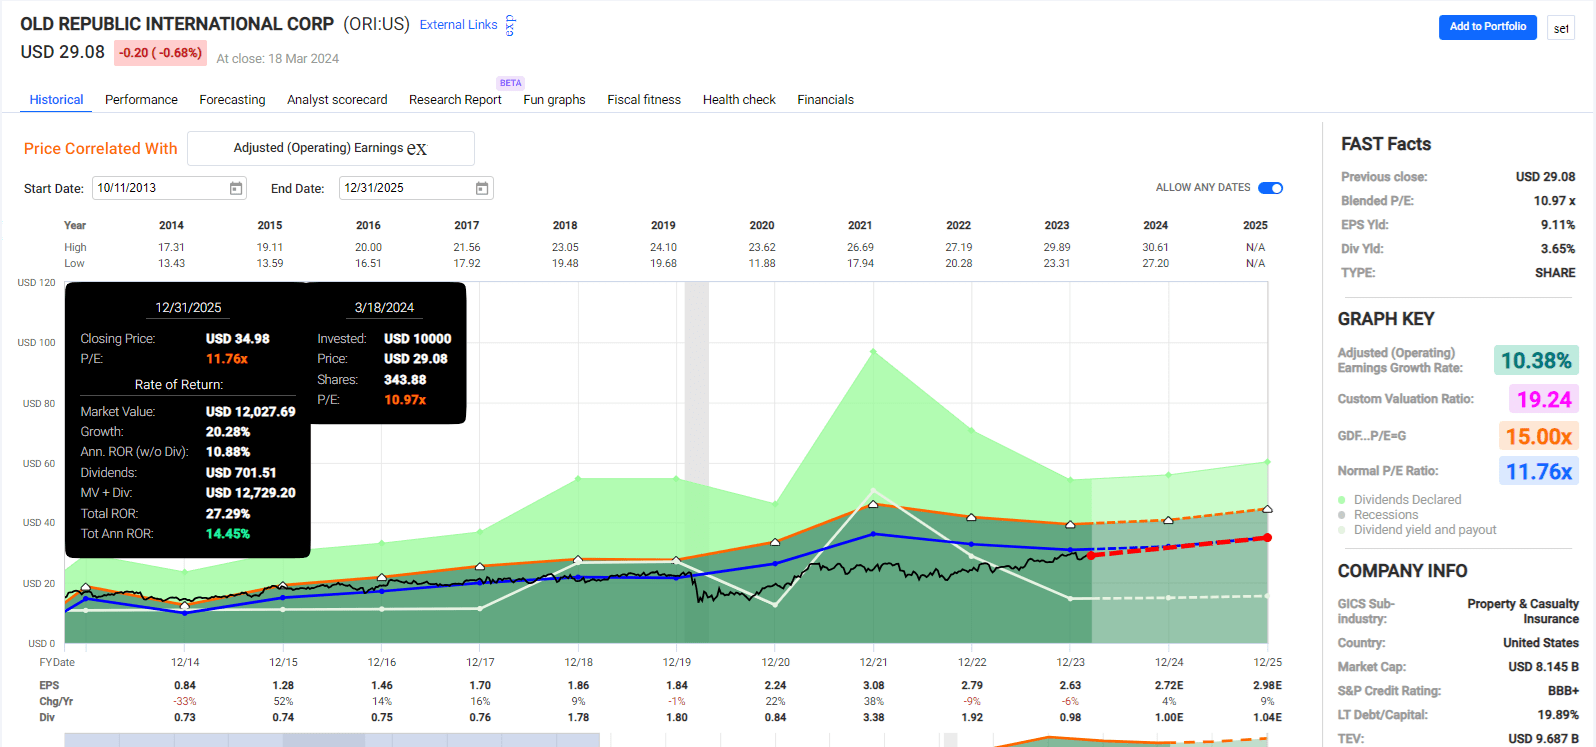
FAST Graphs, FactSet
Cullen & Frost Bankers (CFR)
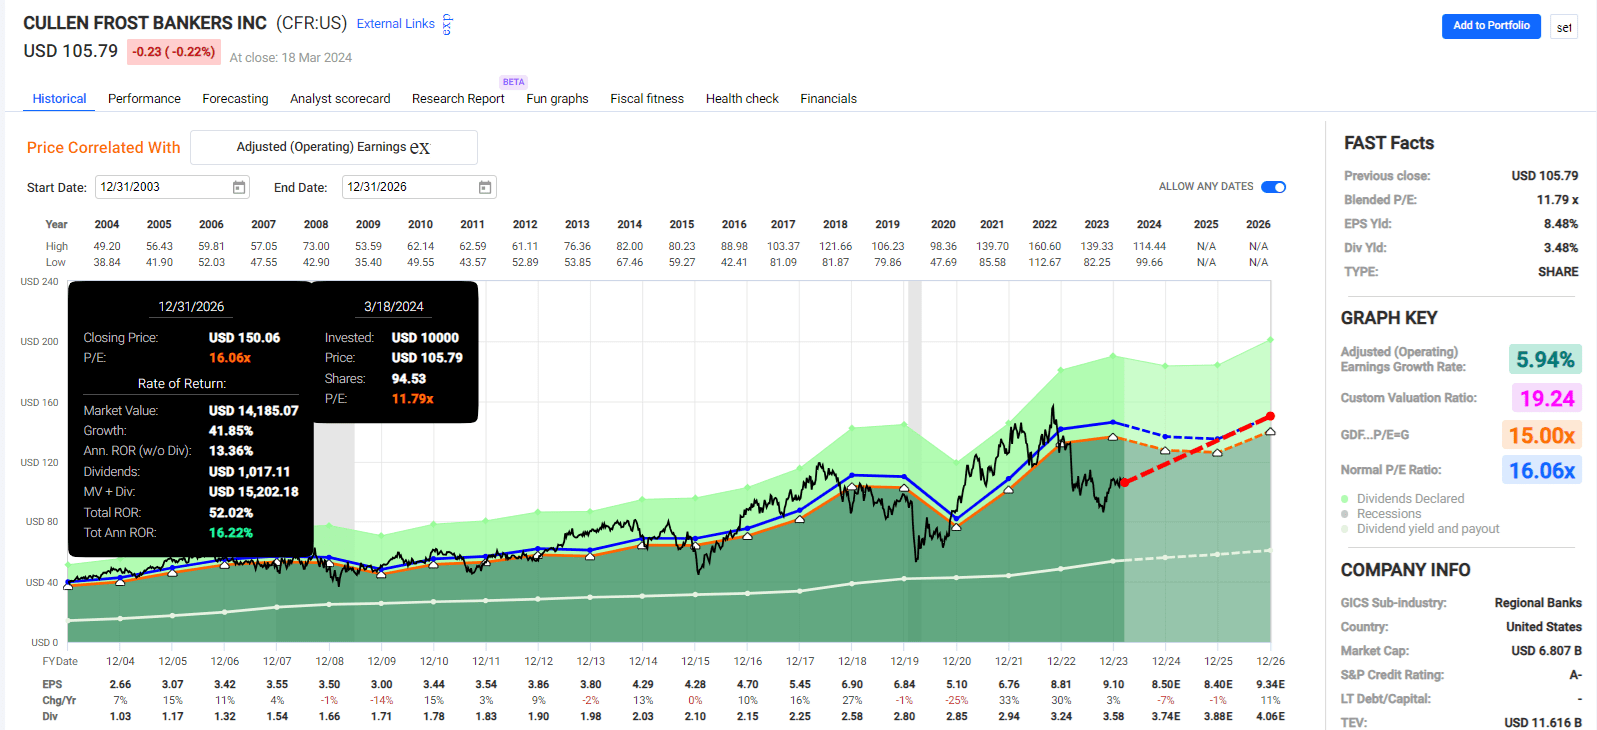
FAST Graphs, FactSet
Chevron (CVX)
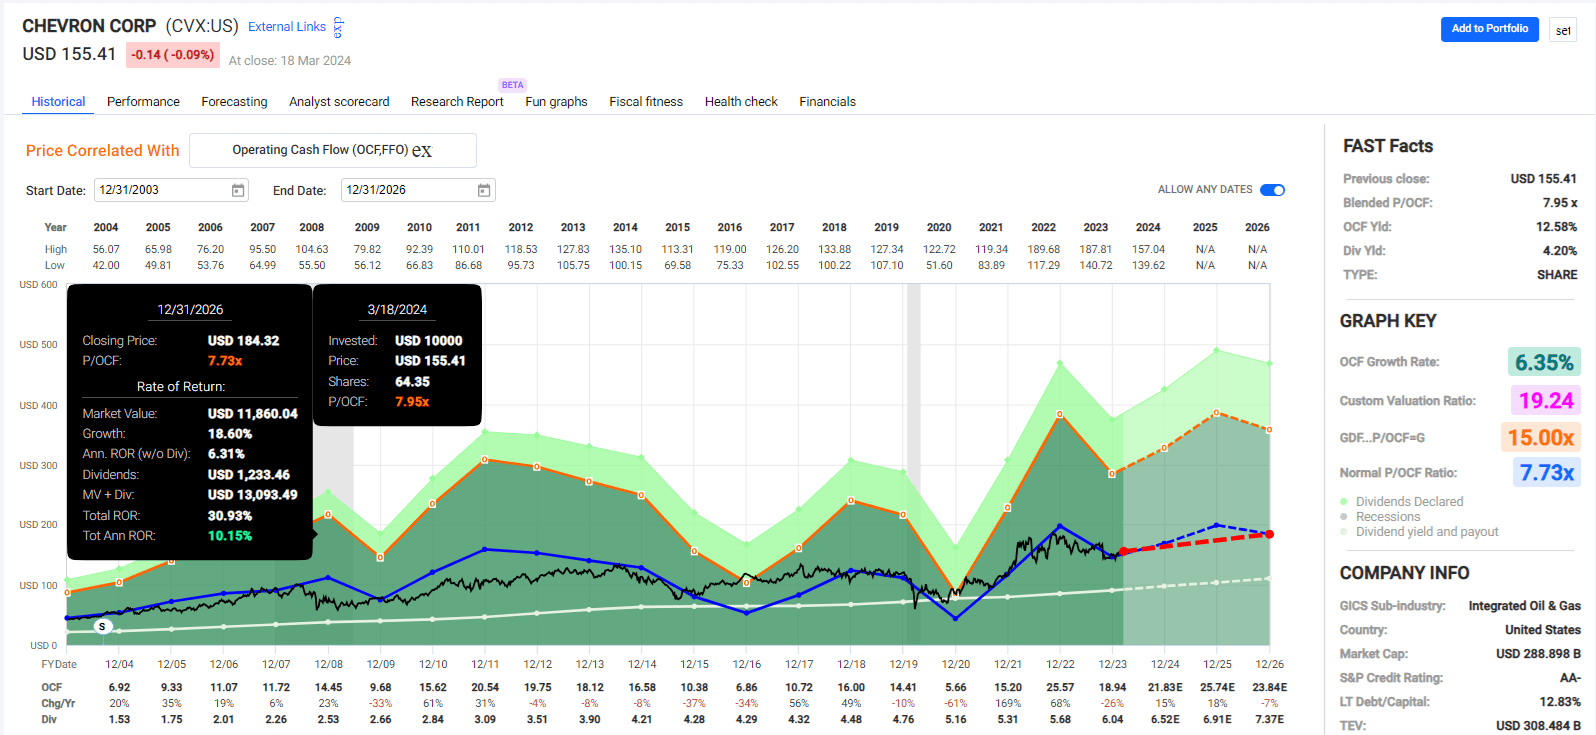
FAST Graphs, FactSet
Community Bank System (CBU)
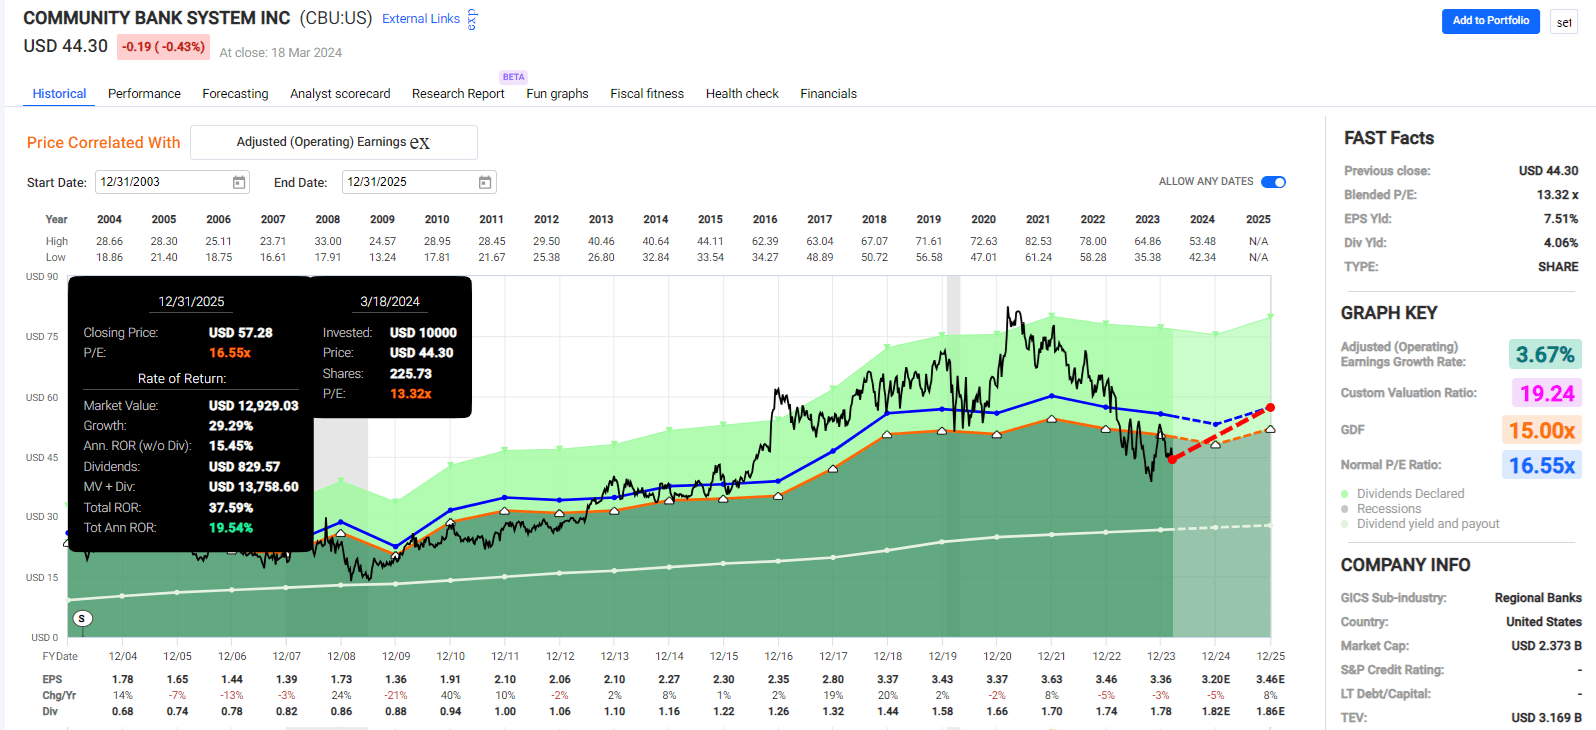
FAST Graphs, FactSet
Novartis (NVS)
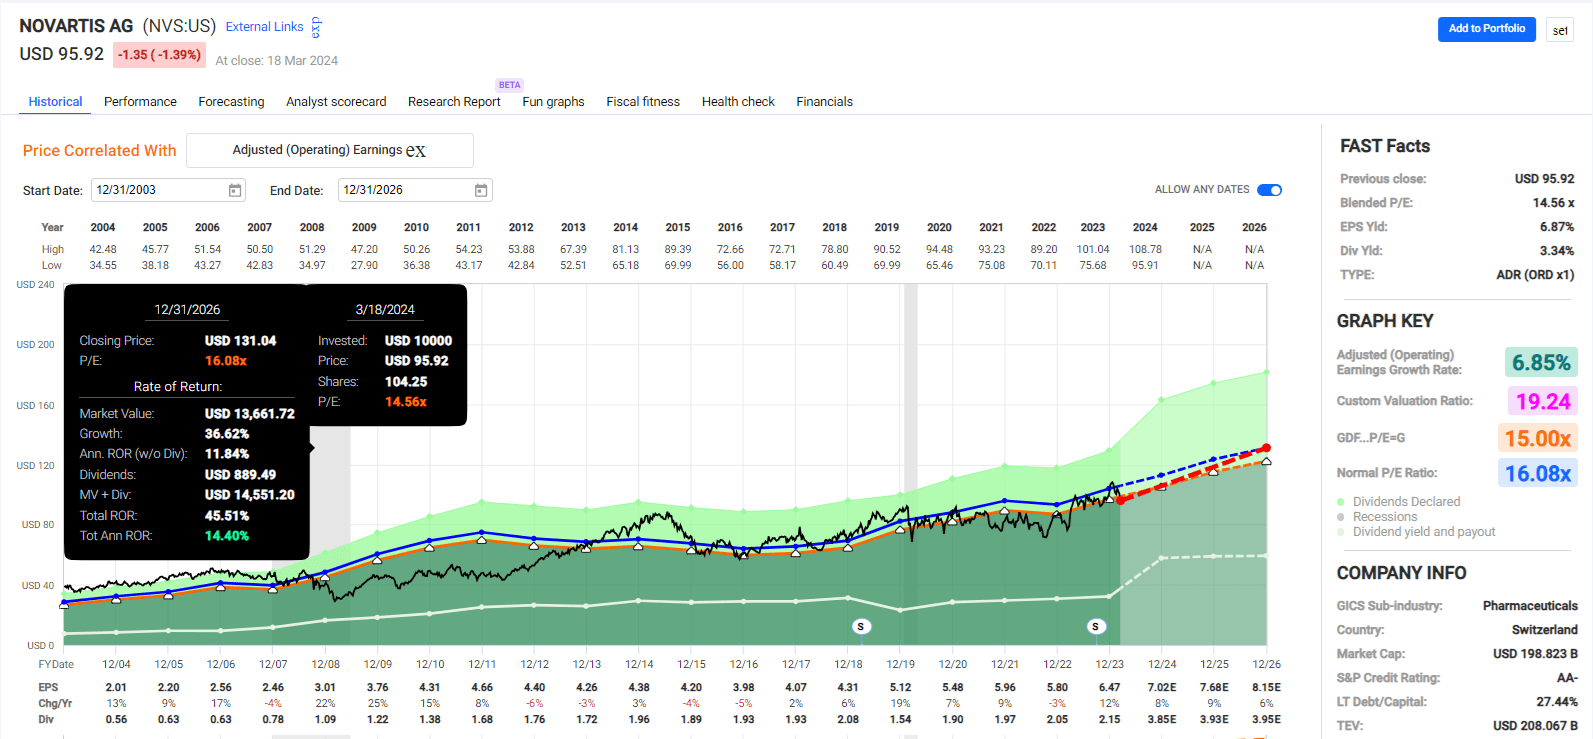
FAST Graphs, FactSet
Air Products and Chemicals (APD)
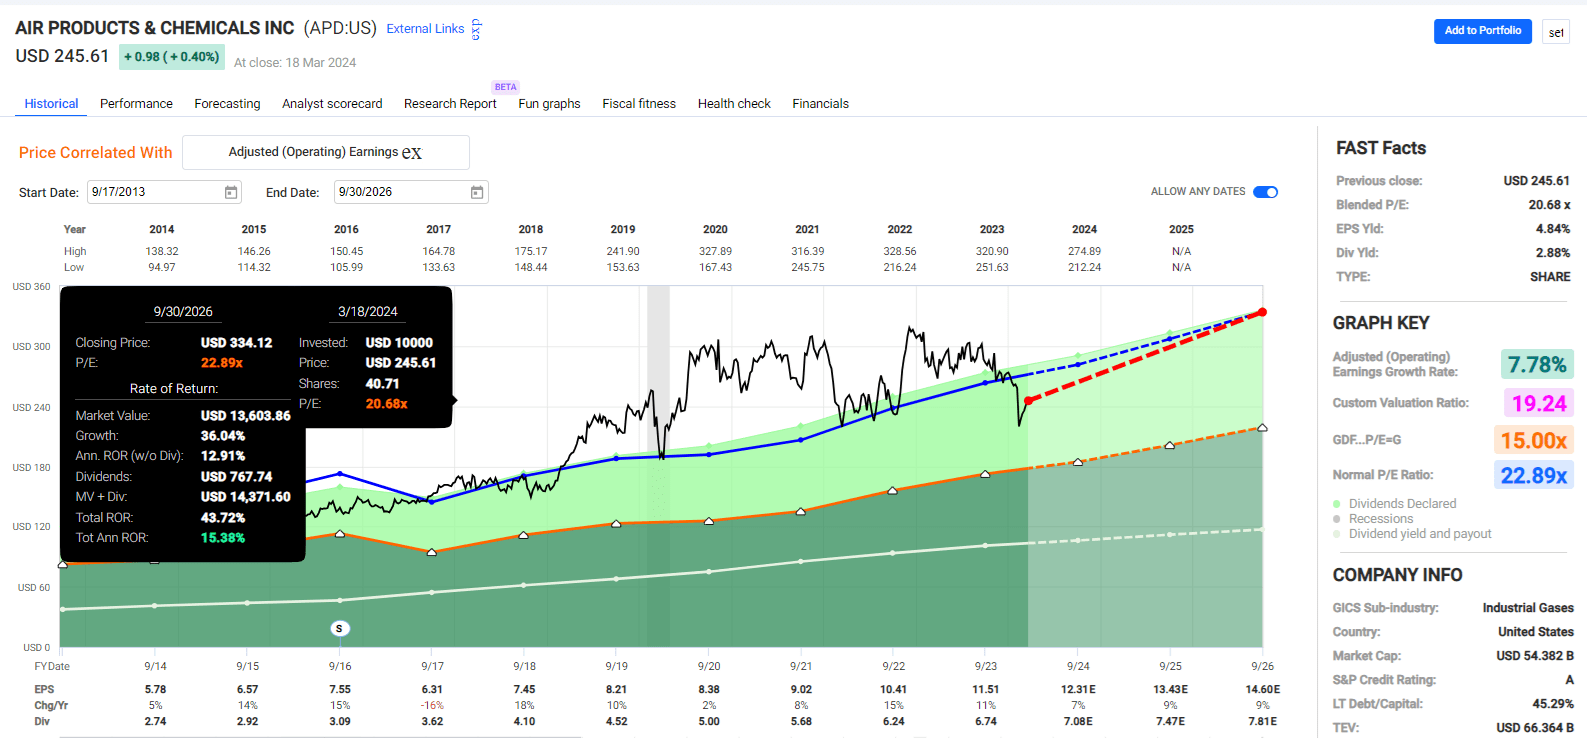
FAST Graphs, FactSet
Cincinnati Financial (CINF)
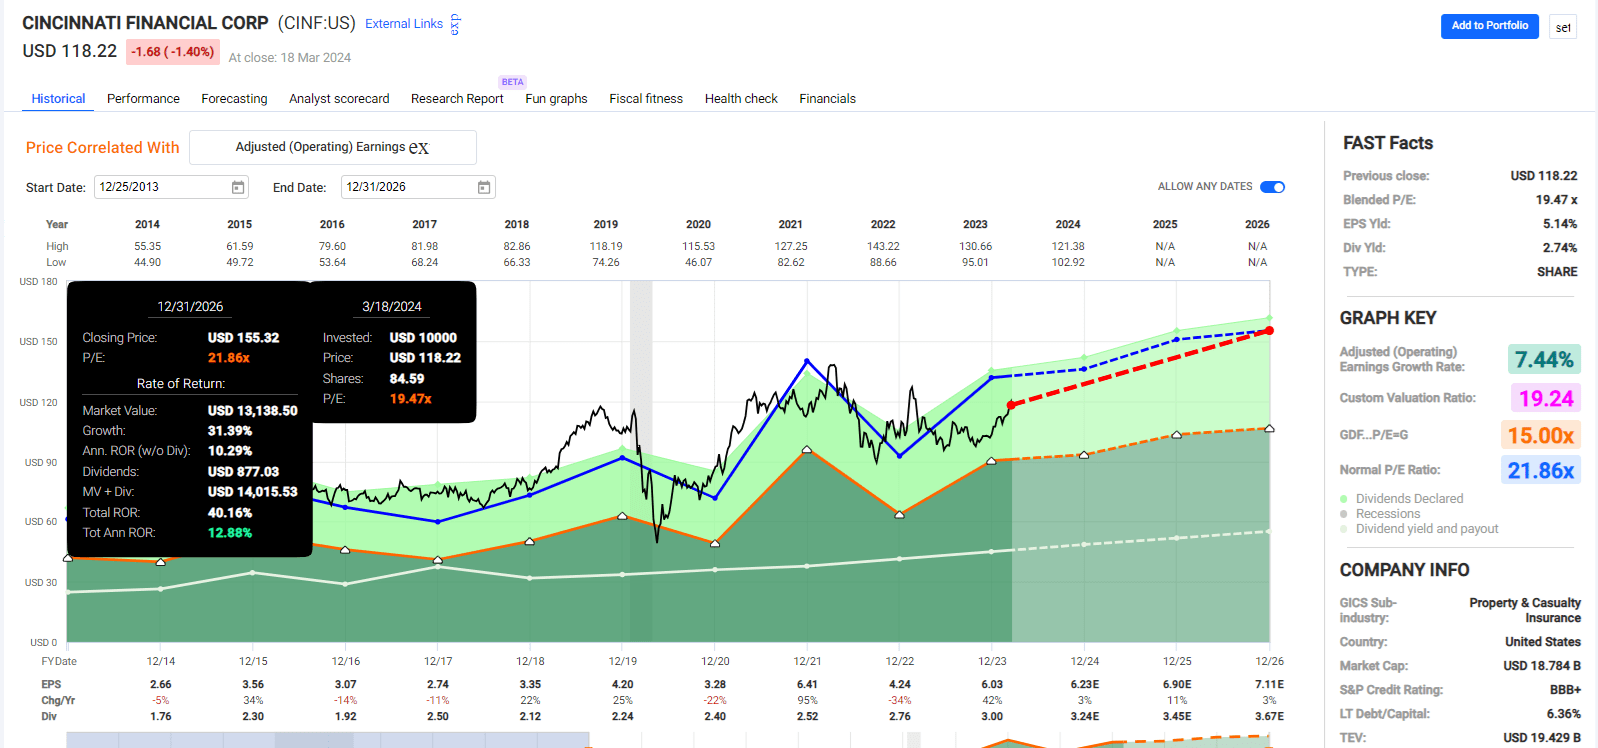
FAST Graphs, FactSet
C.H. Robinson Worldwide (CHRW)
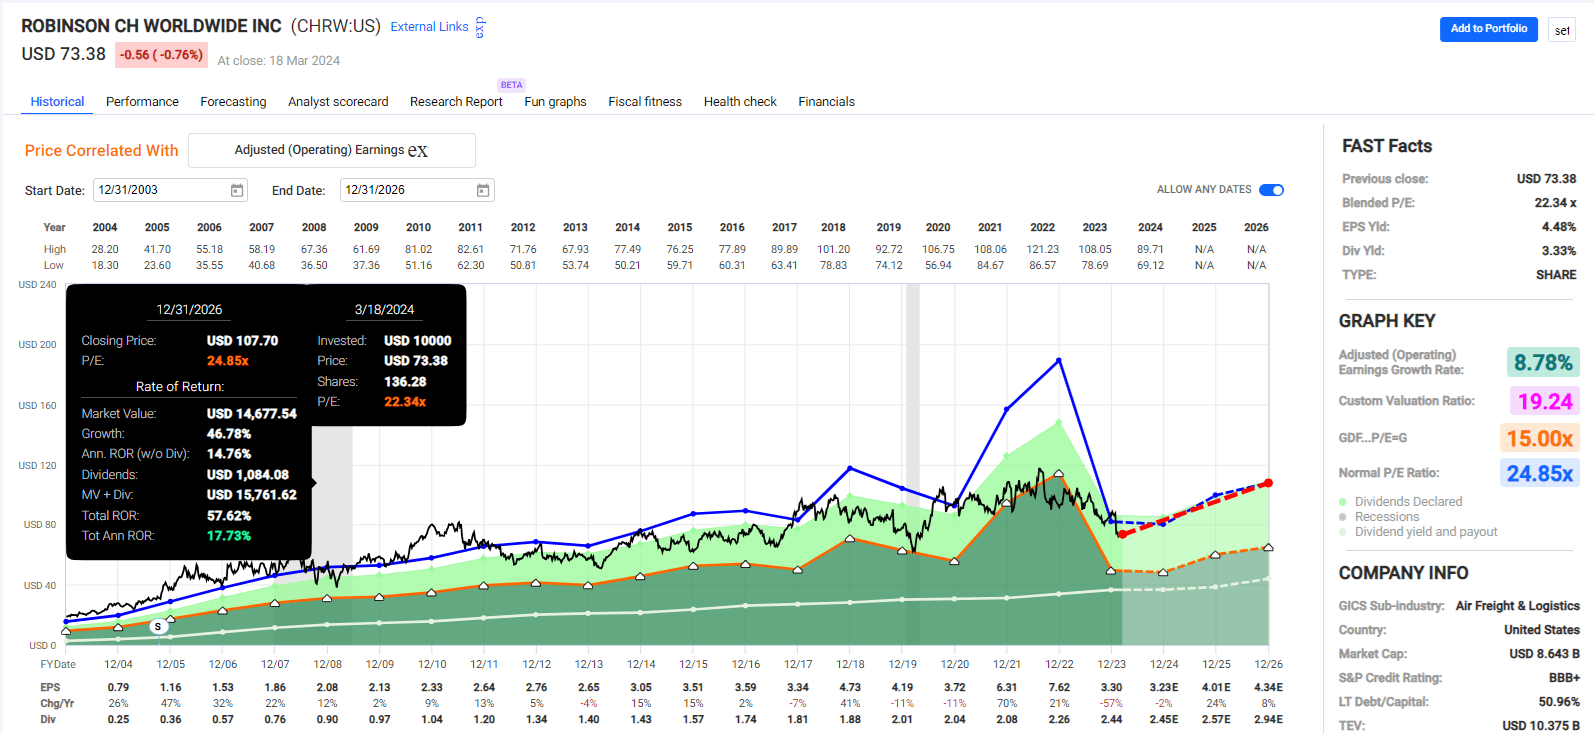
FAST Graphs, FactSet
NextEra Energy (NEE)

FAST Graphs, FactSet
American States Water (AWR)
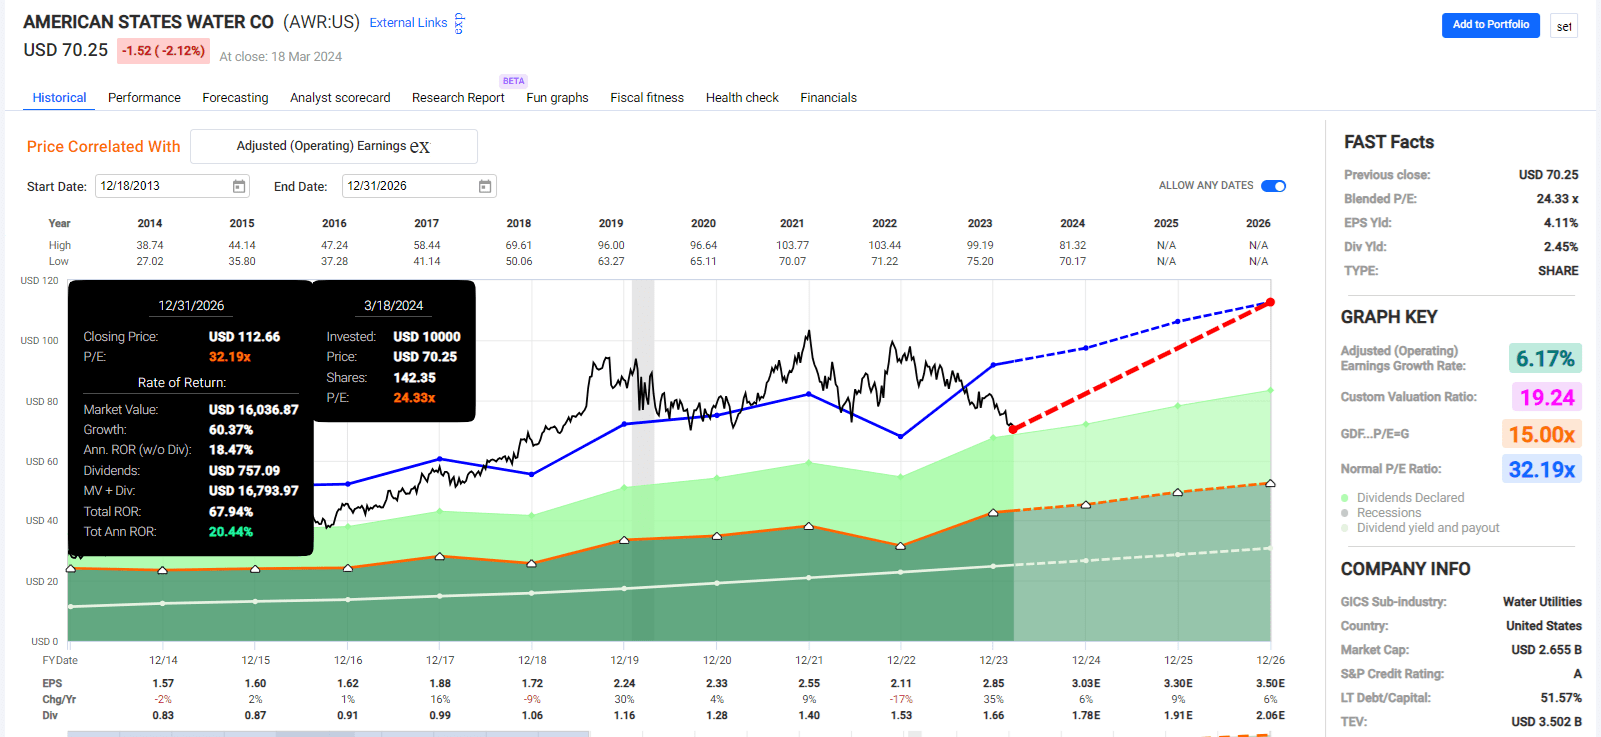
FAST Graphs, FactSet
PPG Industries (PPG)

FAST Graphs, FactSet
Risks To Consider
Note that this is not a complete portfolio. It will be highly sector-concentrated, like VFLO. In other words, don’t invest in a strategy like this because you’ll end up almost wholly invested in three sectors.
If you’re OK with that and the risks, that’s fine, but be aware that this is meant to showcase a bucket approach. High FCF Yield aristocrats + the opposite approach (like ROC/PEG super GARP) = diversified portfolio. We’re building a dividend aristocrat VFLO mini ETF with this article.
Also, note that while FCF yield is the best valuation metric of the last 33 years and the only one to beat the S&P in a raging tech bull market, that doesn’t mean that in any given year, one or all of these high FCF yield aristocrats will actually do well.
Remember that Realty Income and EPD were falling for years during the tech bubble despite rising fundamentals and the biggest US stock market bubble ever.
- The mania’s power caused investors to sell value to buy growth at any price.
Had Seeking Alpha existed, analysts like me would have been pounding the table about Realty Income at 9% yield, then 10%, and then finally at 11%.
We would have called EPD at 10% yield, 11%, 12%, and then 13% yield rich retirement dream stocks.
And for years, we would have looked like fools. The prices kept dropping despite soaring cash flow and dividends that went up double digits.
Wide Moat Research
Value investors and Buffett were vindicated. But it took much longer than most investors expected, and the pain was too much for many to bear. Many quality value fund managers closed their shops and retired in 1999, unable to stomach the constant outflows as clients abandoned fundamentals to chase vapor trading at several hundred times sales.
Bottom Line: Value Investing Never Stopped Working, You Need To Use The Right Metric
When value ETFs like VTV own a lot of Walmart (WMT) and Broadcom (AVGO), which are not value stocks, it’s not so hard to understand why “value” had underperformed.
However, when you use the most potent valuation metrics, EV/FCF and FCF yield, value never stops working, not even in the raging tech bull market of the FANG/Mag 7 era.
That doesn’t mean deep-value funds, portfolios, or even buckets will always perform well.
They are still equities, and no strategy is risk free or goes up in a bear market, at least not consistently. Any stock you happened to own that soared in the pandemic, like Clorox (CLX), was lucky, but it’s not a sign that some stocks are actual bond alternatives.
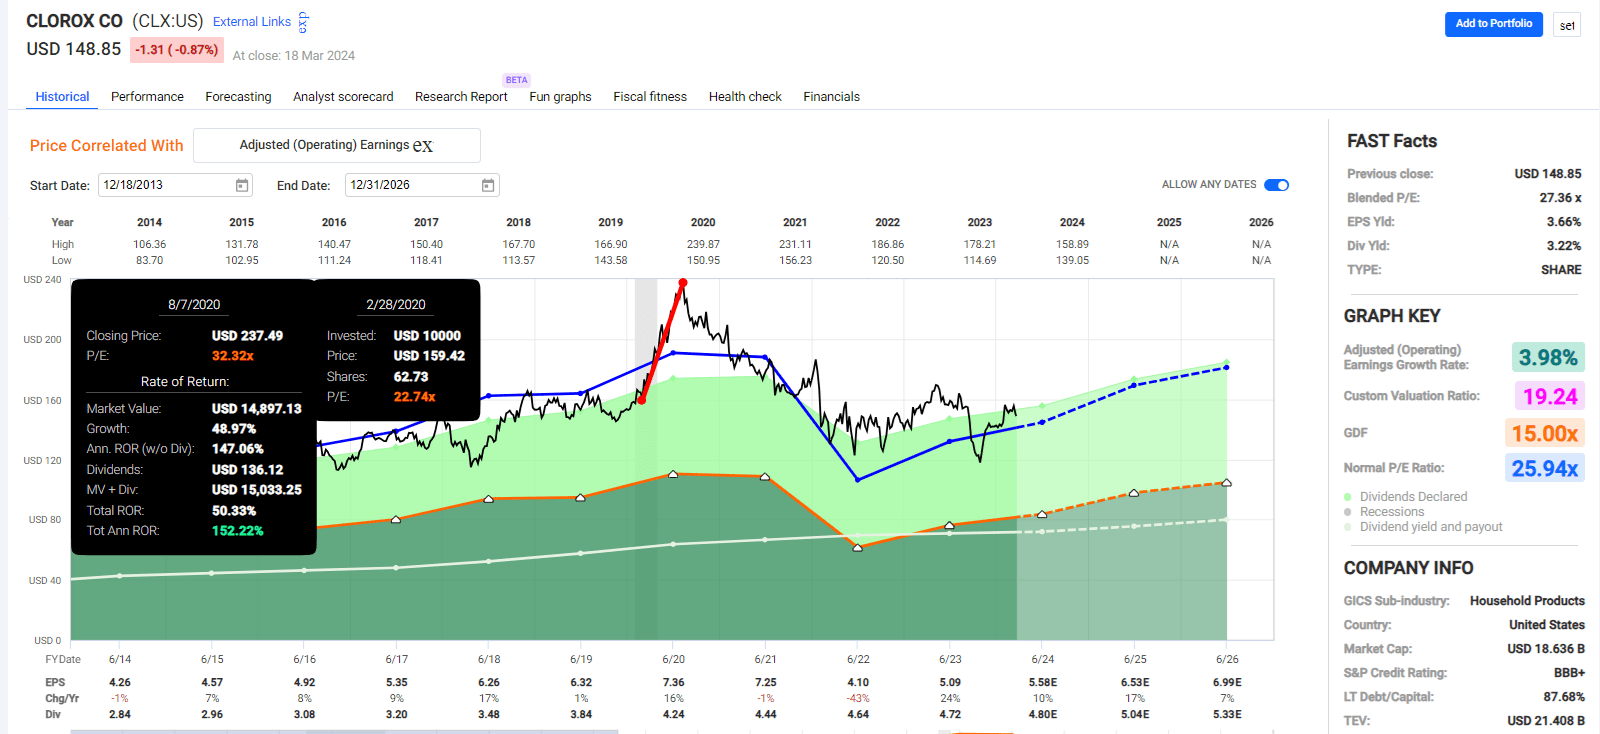
FAST Graphs, FactSet
However, the point is that applying the powerful tool of FCF yield to the dividend aristocrats and some other common sense quality screens is a great way to find truly attractive bargains today.
Bargains that yield 4% on average but up to 9% from companies with strong balance sheets, growing sales and cash flows, and above-average risk management, according to S&P.
And all for 50% lower valuations than the S&P. This is what I mean by “blue-chip bargains are always on sale if you know where to look.”
If I told you that I could give you 13 companies trading at half the market’s multiple, you’d think I were throwing out “cigar butts.”
But these aren’t cigar butts; they’re thriving dividend companies that have historically beaten the market and are expected to keep doing it in the future while delivering double-digit income growth in all manner of economic and market conditions.
Be the first to comment