


Pick the share that doesn’t send your money up in flames.
sbayram
Get ready for charts, images, and tables because they are better than words. The ratings and outlooks we highlight here come after Scott Kennedy’s weekly updates in the REIT Forum. Your continued feedback is greatly appreciated, so please leave a comment with suggestions.
Just a few notes today.
- New Residential (NRZ) is now Rithm Capital (RITM). However, thanks to Google Finance still using NRZ, I’m still going to use NRZ in our charts. I know you hate the name Rithm. Pretty much everyone does. However, I’ll deal with a dumb name to make money.
- About a week ago, I said NRZ / RITM was looking attractive under $10.00. On Wednesday, I picked up more shares of NRZ / RITM just under $10.00. I closed my position in common shares of PMT to fund the purchase (shares entered our neutral range). These shares are in a tax-advantaged account and I’m playing this for a short-term capital gain on a recovery in the price-to-book ratio.
- Dynex Capital (DX) carries a higher price-to-projected book value than their agency mortgage REIT peers. That’s hilarious.
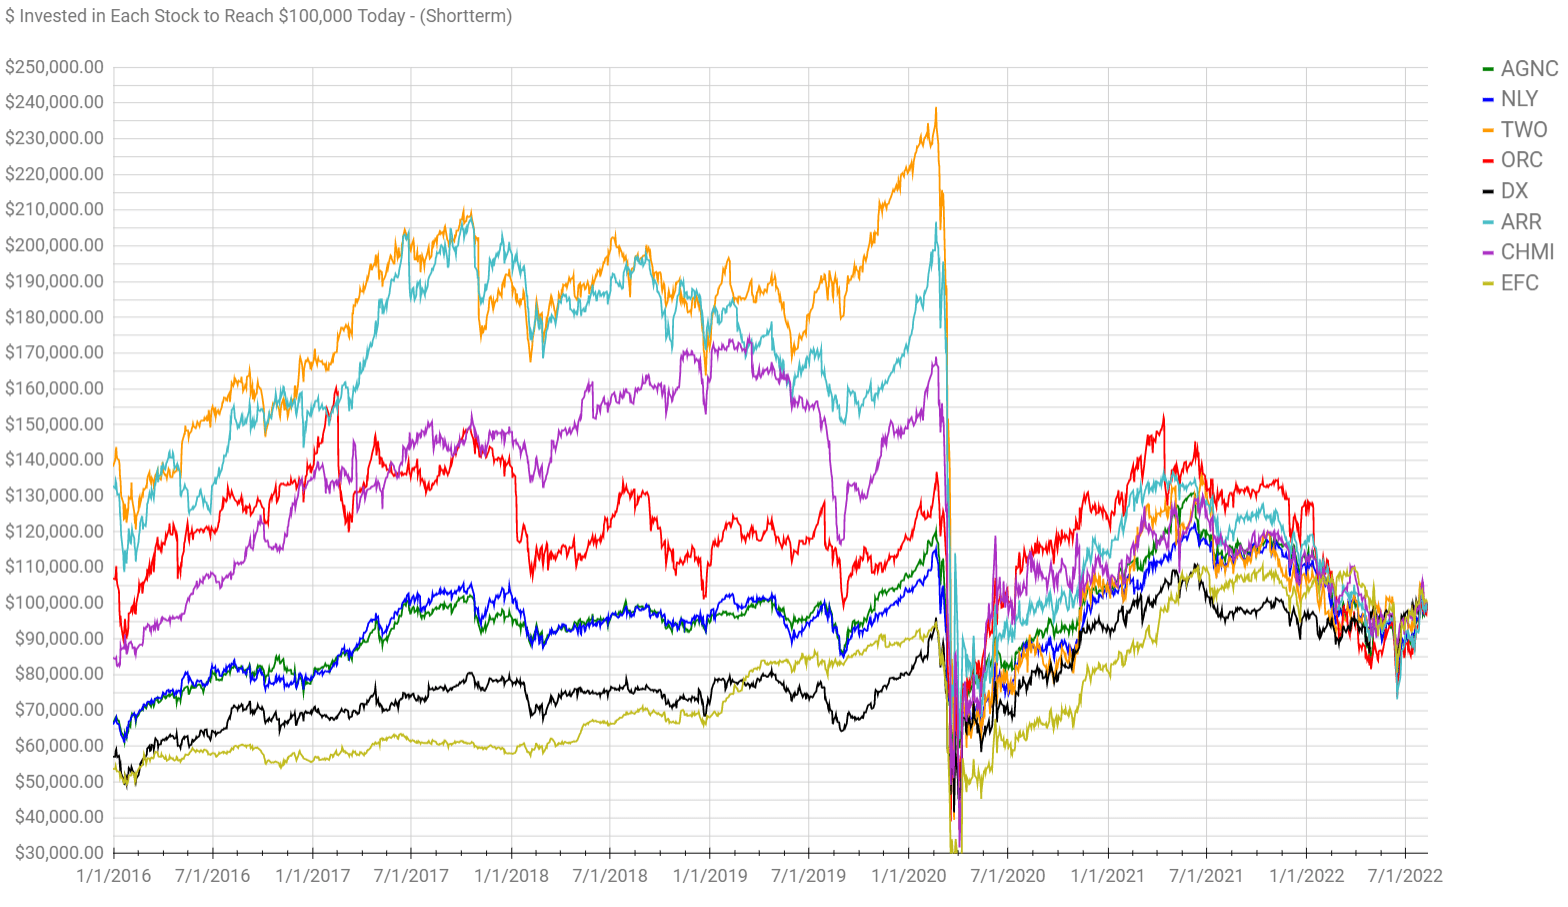
Okay, you’re probably wondering how point 3 is so funny. Allow me to share the $100k chart, which shows the amount invested on any prior day (with dividend reinvestment) to reach $100K today:
The REIT Forum
DX is the black line. See how it tends to be near the bottom? Do you know why that is? Because they refrained from obliterating book value. They took far less risks and it paid off in a huge way. Across the board, shares for these mortgage REITs will rarely trade above 1.1x book value or below 0.75x book value. Some will tend to be higher in that range than others, but it’s rare to see them cross outside that range.
Today, using our projected book values the range for price-to-current-book (using BV estimates as of last Friday) runs from .92 to 1.07. That’s a material gap, but the point I want to make is that the connection between share prices and book value remains. So, when DX outperformed in the $100k chart, it was a reflect of protecting book value better than most peers throughout that period.
The top 4 lines in the chart from the start of 2016 through the start of 2020 are TWO, ARR, CHMI, and ORC. If investors began their holding period prior to the start of 2020 and simply sat there with dividends reinvested, any of those 4 REITs would’ve materially underperformed. If a buy-and-hold investor bought DX or EFC on any day between January 1st, 2016, and January 1st, 2020, they would still be sitting on a positive total return. Those are the only two REITs in the batch where we can make that statement. Prices are down compared to early 2016, but for those REITs the dividends easily overcame the decline in share price.
Why are investors ignoring DX? Is it because they’ve outperformed over the last year and investors think they should get something with more “bounce back potential”. I’ve got news for you, when the book value gets destroyed, it’s destroyed. Think it will recover? Another mortgage REIT could buy equivalent positions and have the same potential for recovery. The $100k chart is useful for spotting recent deviations in performance and in evaluating long-term performance. To really make sense of it, you’ve got to recognize which mortgage REITs destroyed book value. For instance, one might have lost less than 10% of book value while another lost 30% or so. When that’s the case, the one that lost 30% deserved to fall much harder.
Investors can take this lesson one of two ways:
- Recognize that it’s very strange for investors to bid a higher price-to-book ratio for REITs with a history of weaker decisions.
- Claim book value doesn’t matter and continue to throw their money away chasing yield.
A Bold Prediction
Starting from today, I predict that over the next 12 months we will see a better total return performance (change in share price + dividends) for DX than for ORC, ARR, CHMI, or NLY.
I think the odds of DX beating all 4 is pretty good. The odds of DX beating the average of that group is excellent.
For the one guy who failed out of math class and came up with his own method for calculating “returns”, I’ll demonstrate how that works.
Imagine if DX delivered 11% while ORC, ARR, CHMI, and NLY delivered 4%, 7%, 1%, and 10%, respectively.
DX would have beaten all four and smashed the average of 5.5%.
Why would I say something so blatantly obvious? Because high yield articles will always get one or two readers who think “all four” means “4% + 7% +1% + 10%”.
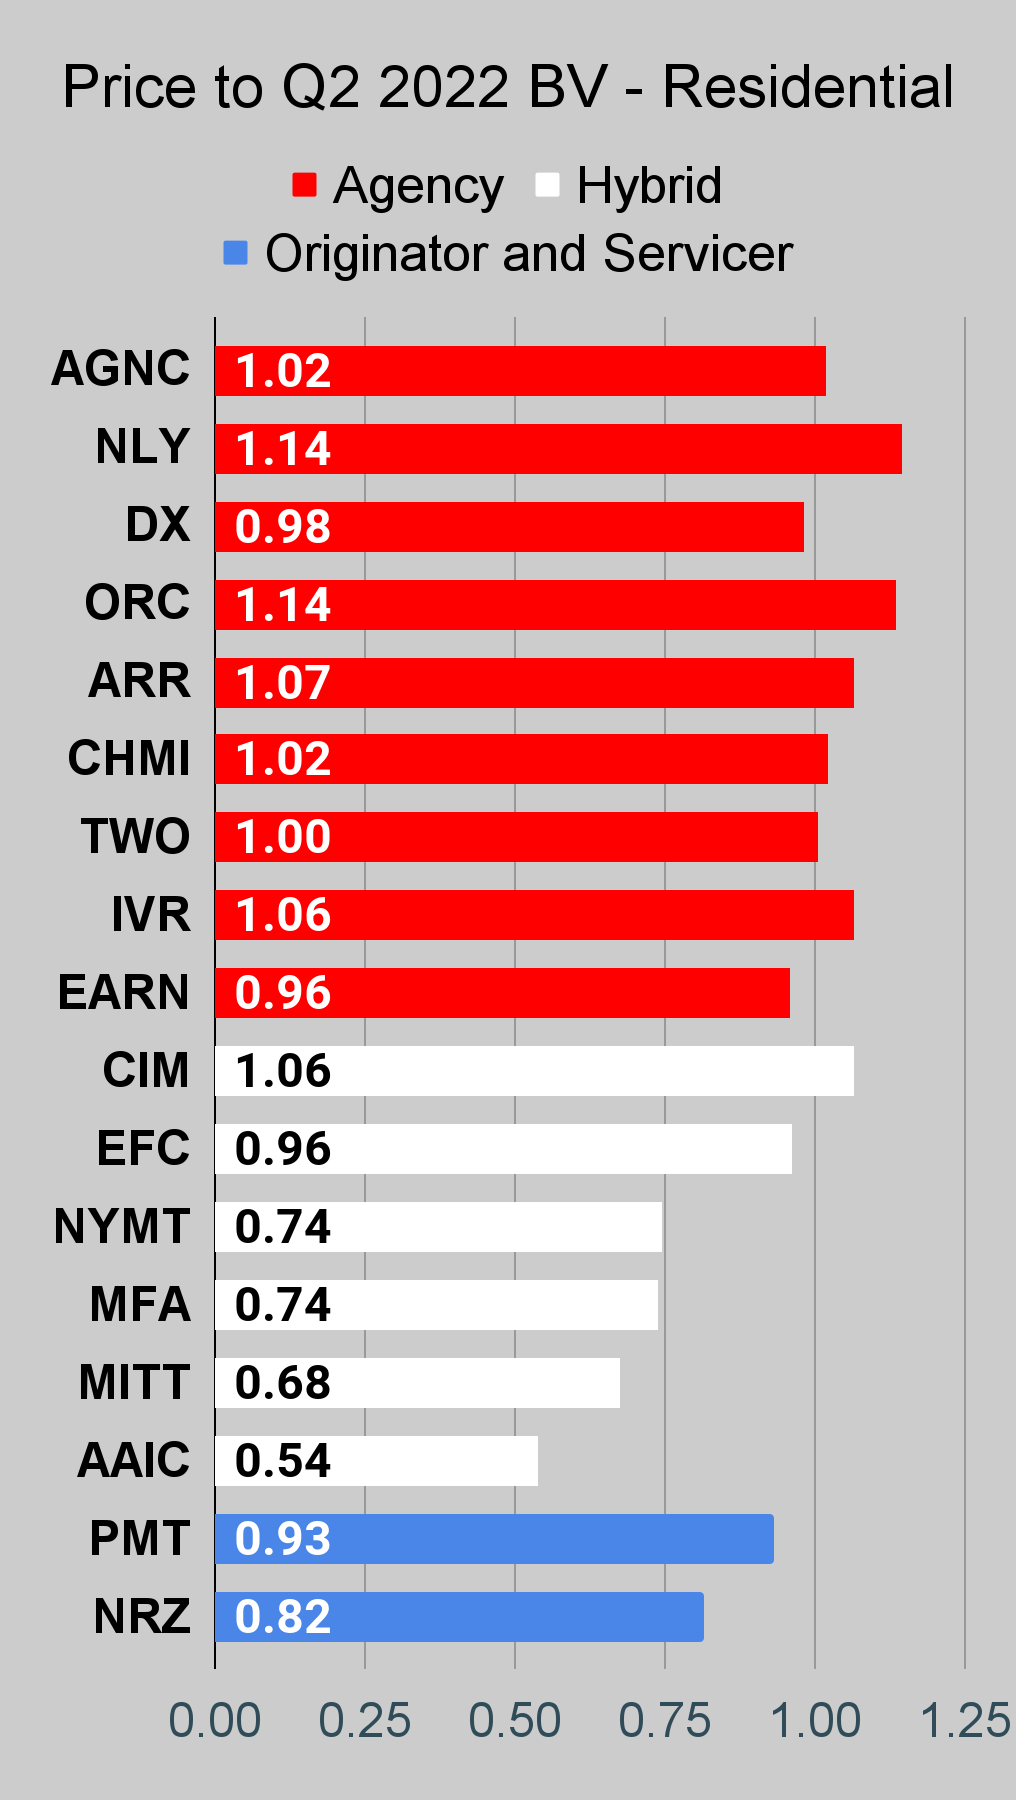
How can I make such a prediction? Let’s use ORC for an example. At $3.26, ORC trades at 1.07x our estimate for book value. ORC should really be looking to issue new shares ASAP because that’s a nice premium. At $16.48, DX trades at only .92x our estimate for book value. If these two equalized out to each trade at 1.0x book value, it would give DX about 8% to 9% upside while it would be nearly 7% downside for ORC.
For future reference, here are today’s prices for the prediction:
- DX: $16.48
- ORC: $3.26
- ARR: $7.73
- CHMI: $6.88
- NLY: $6.75
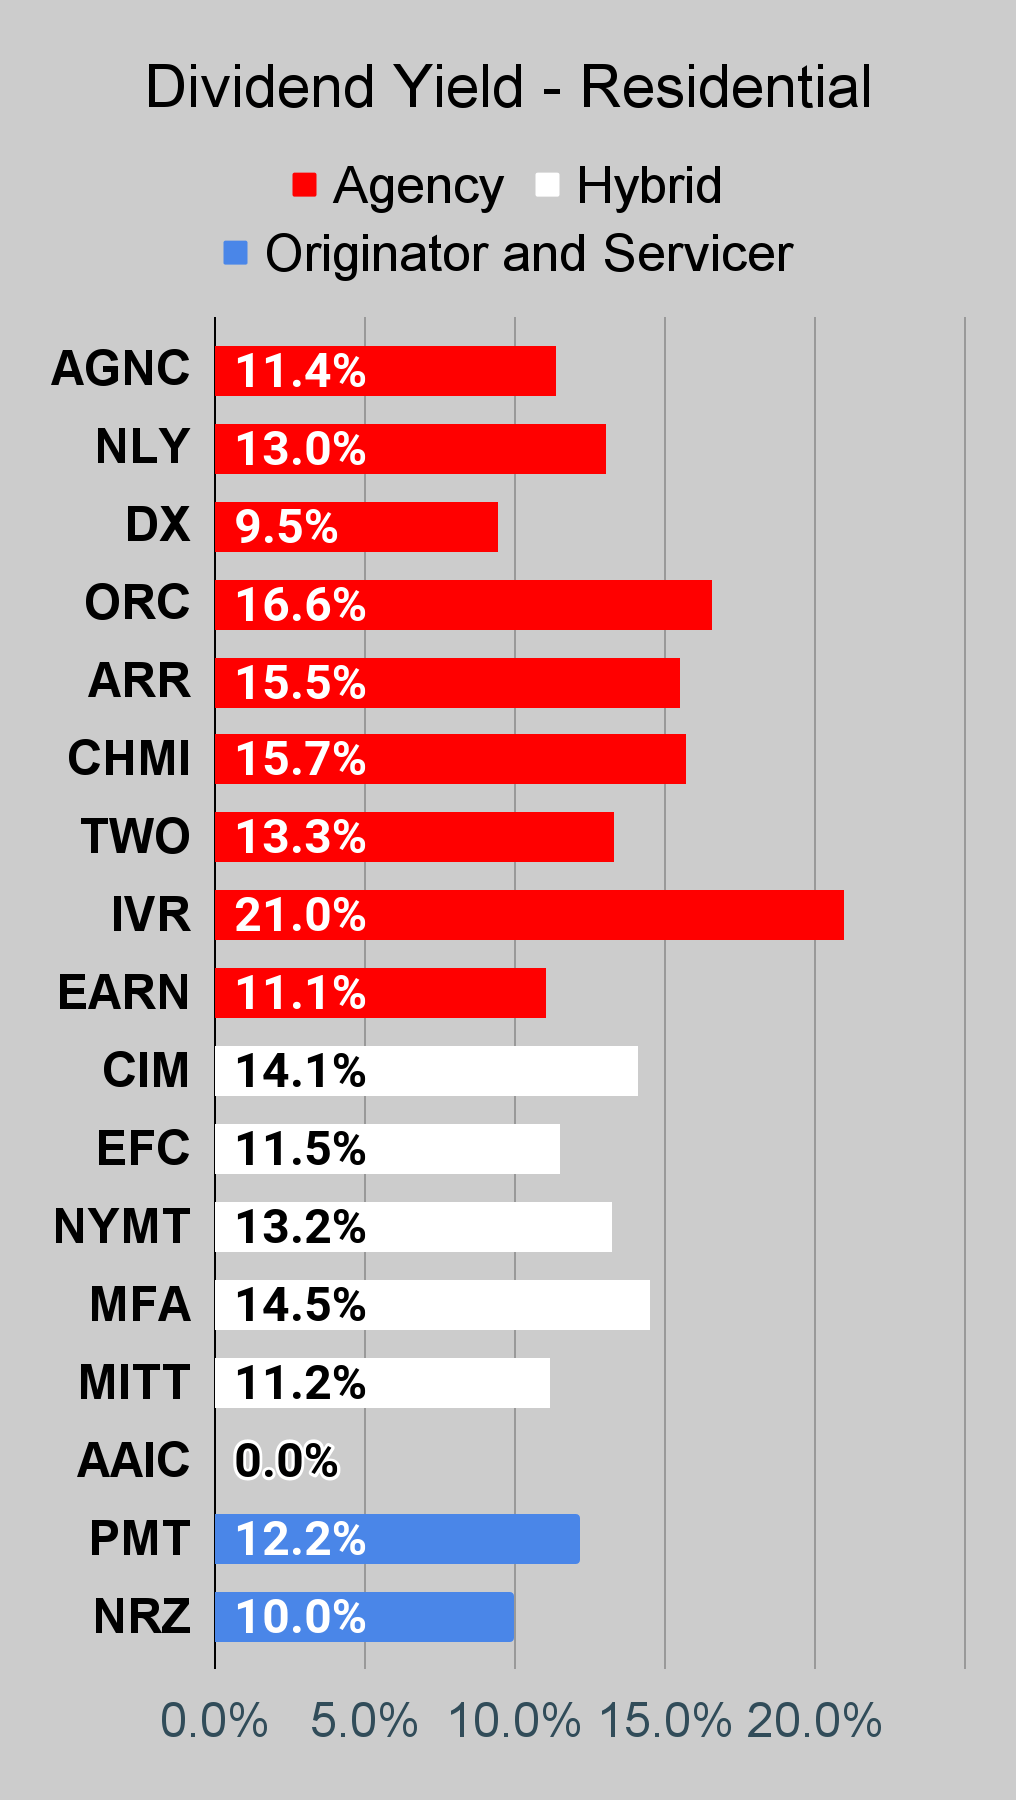
If you think dividend yields are going to make the difference, think again. The 9.5% dividend yield on DX is materially lower than the dividend yields on the others, which range from 13% to 16.6%. Need a chart? Seriously, this series always has a chart. It’s further down.
The amount a REIT paid out in dividends for the prior quarter doesn’t tell you how much a share is worth. That’s simply not how investing works. No, it’s not. If you buy a sucker yield, that’s on you. It’s not on the board that reduced an obviously unsustainable dividend. It’s on the investor who looked at the dividend yield and declared themselves the next Warren Buffett for coming up with an investing technique no other person had ever considered before. That sarcasm coming through clearly enough? You never know on the internet.
I think there’s a strong chance ORC announces a new share issuance soon. I wouldn’t blame them. They really should at this price.
NLY also trades at 1.07x book value. However, NLY issued shares less than 2 weeks ago. If the price-to-book remains this high, they should see how soon they can do another offering.
Besides being bullish on DX, I’m also bullish on NRZ / RITM, which is probably pretty obvious since we just raised our position. Shares closed at $10.01 today, just to give investors an easy reference point.
Perhaps I should add in another chart that just lists the share prices so investors checking the article in the future can immediately see the price from the date of my comment? Let me know what you think in the comments. Overkill or a useful addition?
Why Don’t You Talk About NRZ / RITM
Seriously, I did that in the last article. It was most of the article. I’m not going to repeat myself after only a week. I should wait at least ten days for that!
Why did we buy more? Big discount. Recent weakness relative to peers. Market may misunderstand name change and/or internalization.
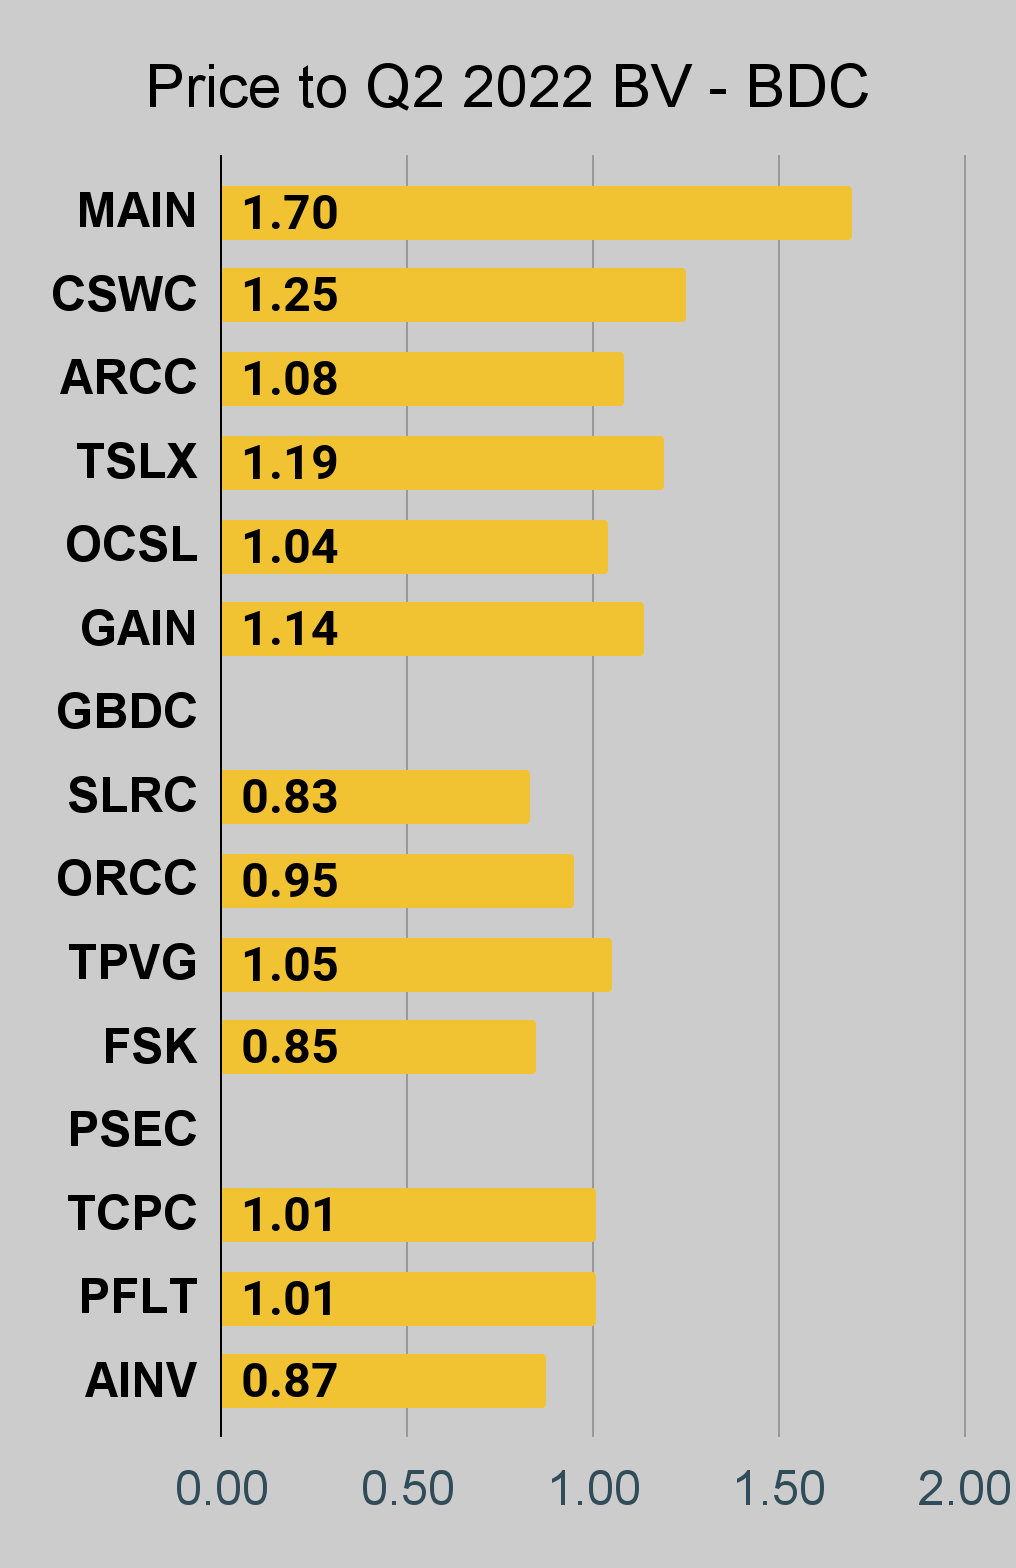
One last note. We’re waiting on PSEC to report and I don’t have the values plugged in for GBDC yet. Consequently, those two BDCs won’t have a price-to-book value ratio in the charts today.
The rest of the charts in this article may be self-explanatory to some investors. However, if you’d like to know more about them, you’re encouraged to see our notes for the series.
Stock Table
We will close out the rest of the article with the tables and charts we provide for readers to help them track the sector for both common shares and preferred shares.
We’re including a quick table for the common shares that will be shown in our tables:
Let the images begin!
Residential Mortgage REIT Charts
Note: The chart for our public articles uses the book value per share from the latest earnings release. Current estimated book value per share is used in reaching our targets and trading decisions. It is available in our service, but those estimates are not included in the charts below.
 The REIT Forum |
 The REIT Forum |
 The REIT Forum |
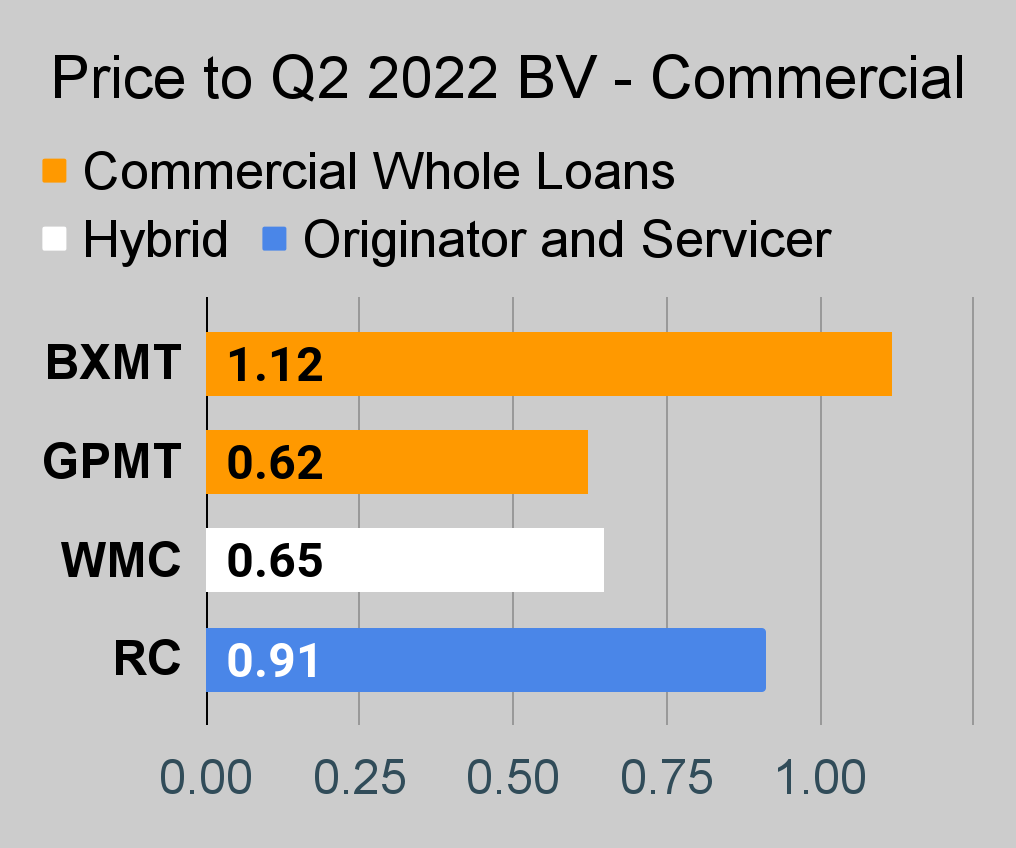
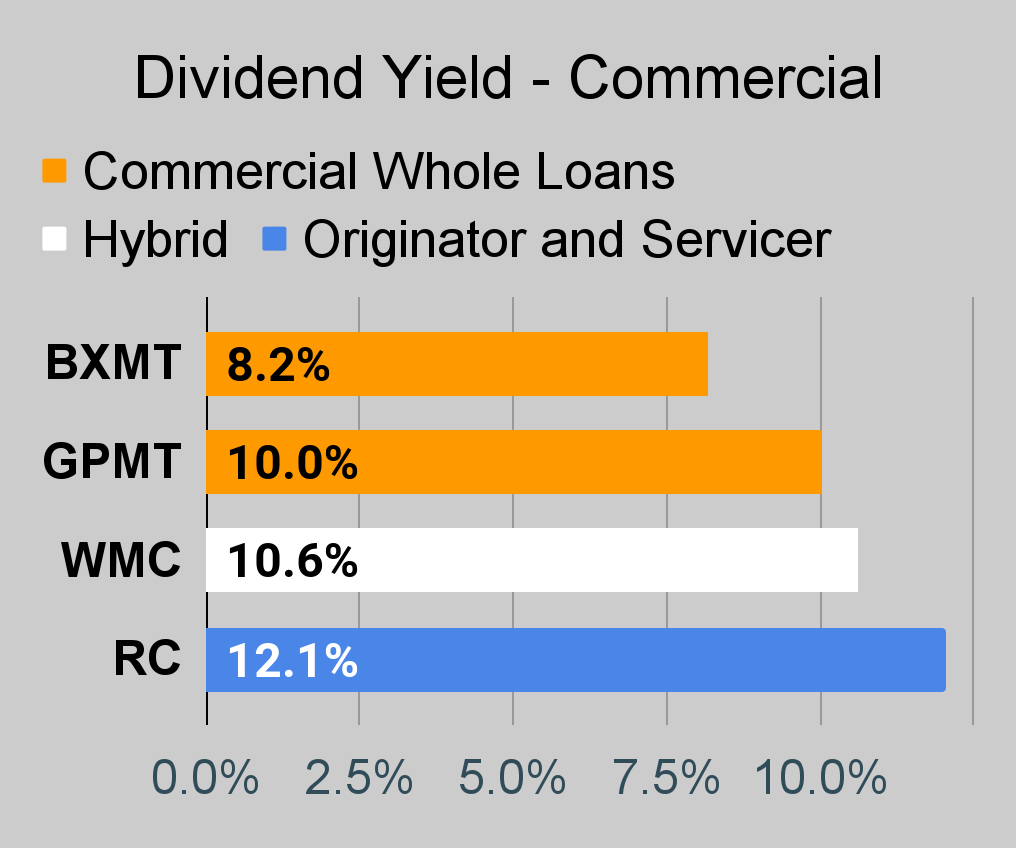
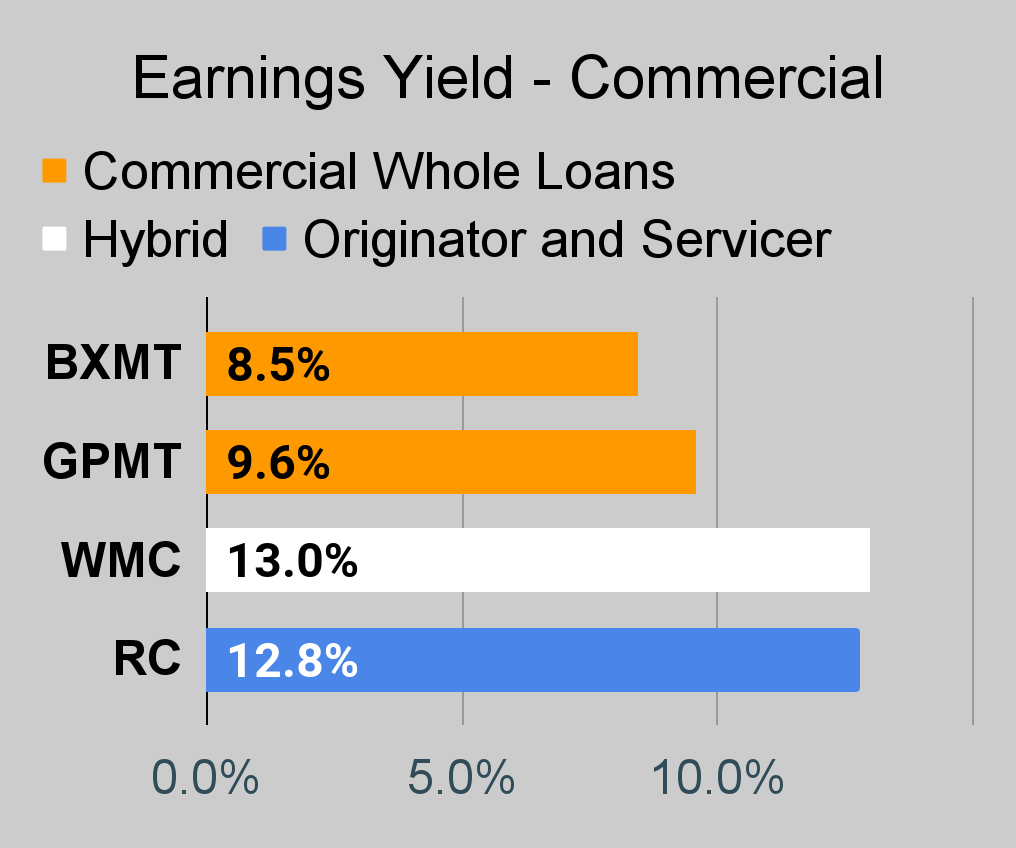
Commercial Mortgage REIT Charts
 The REIT Forum |
 The REIT Forum |
 The REIT Forum |
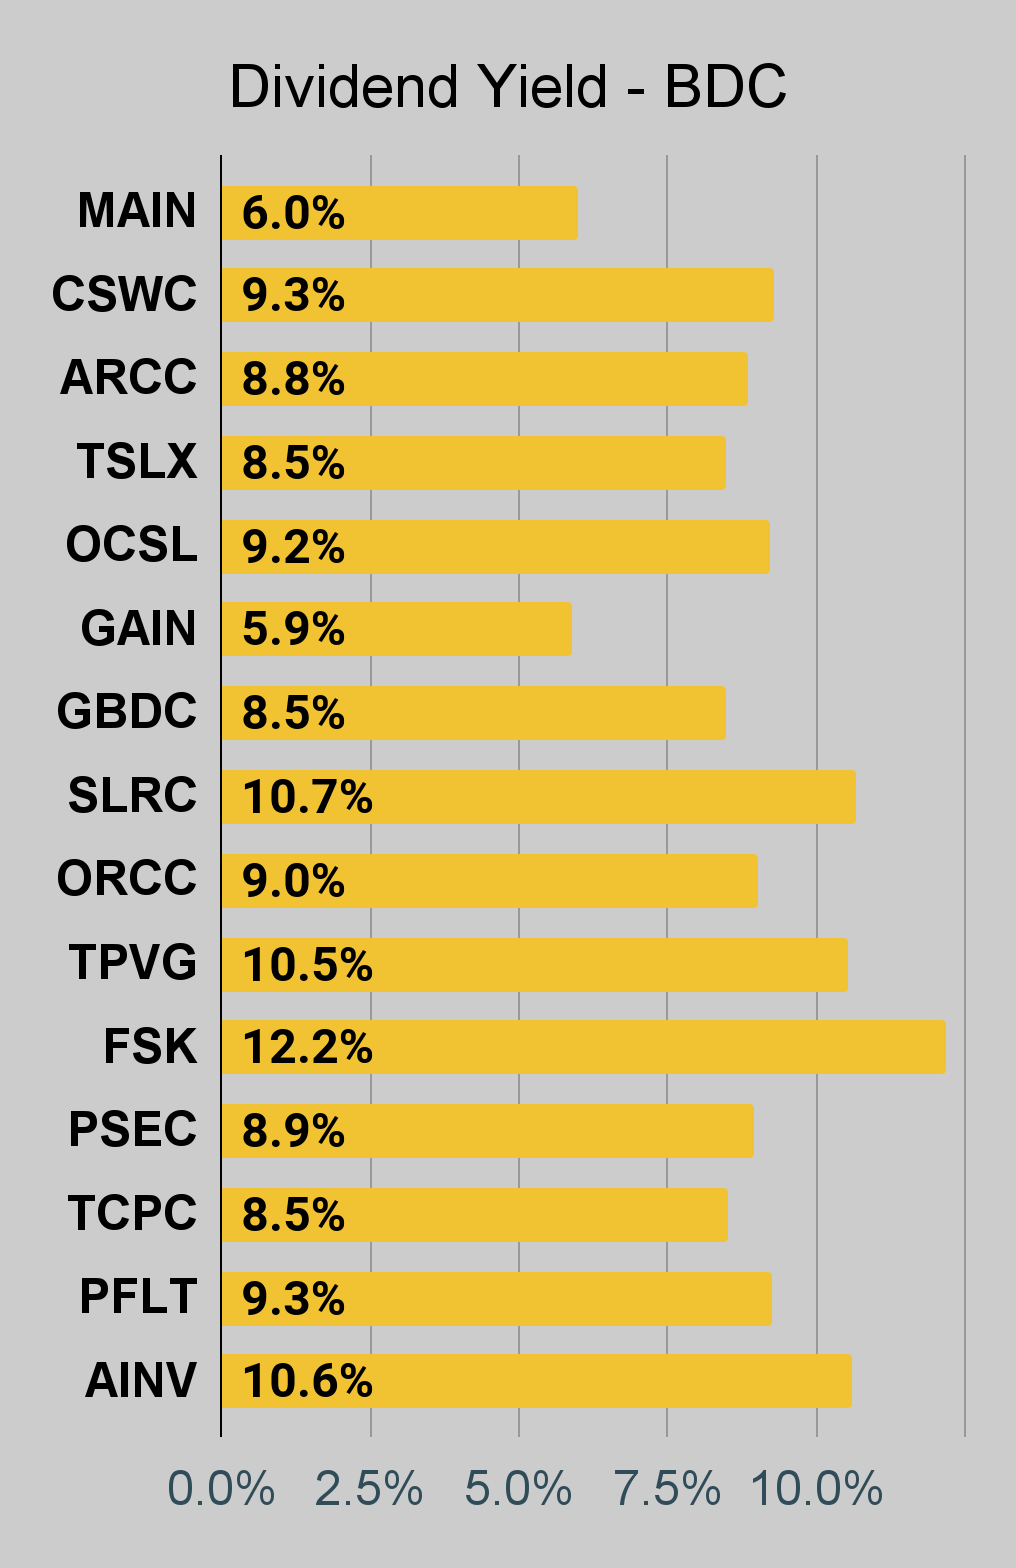
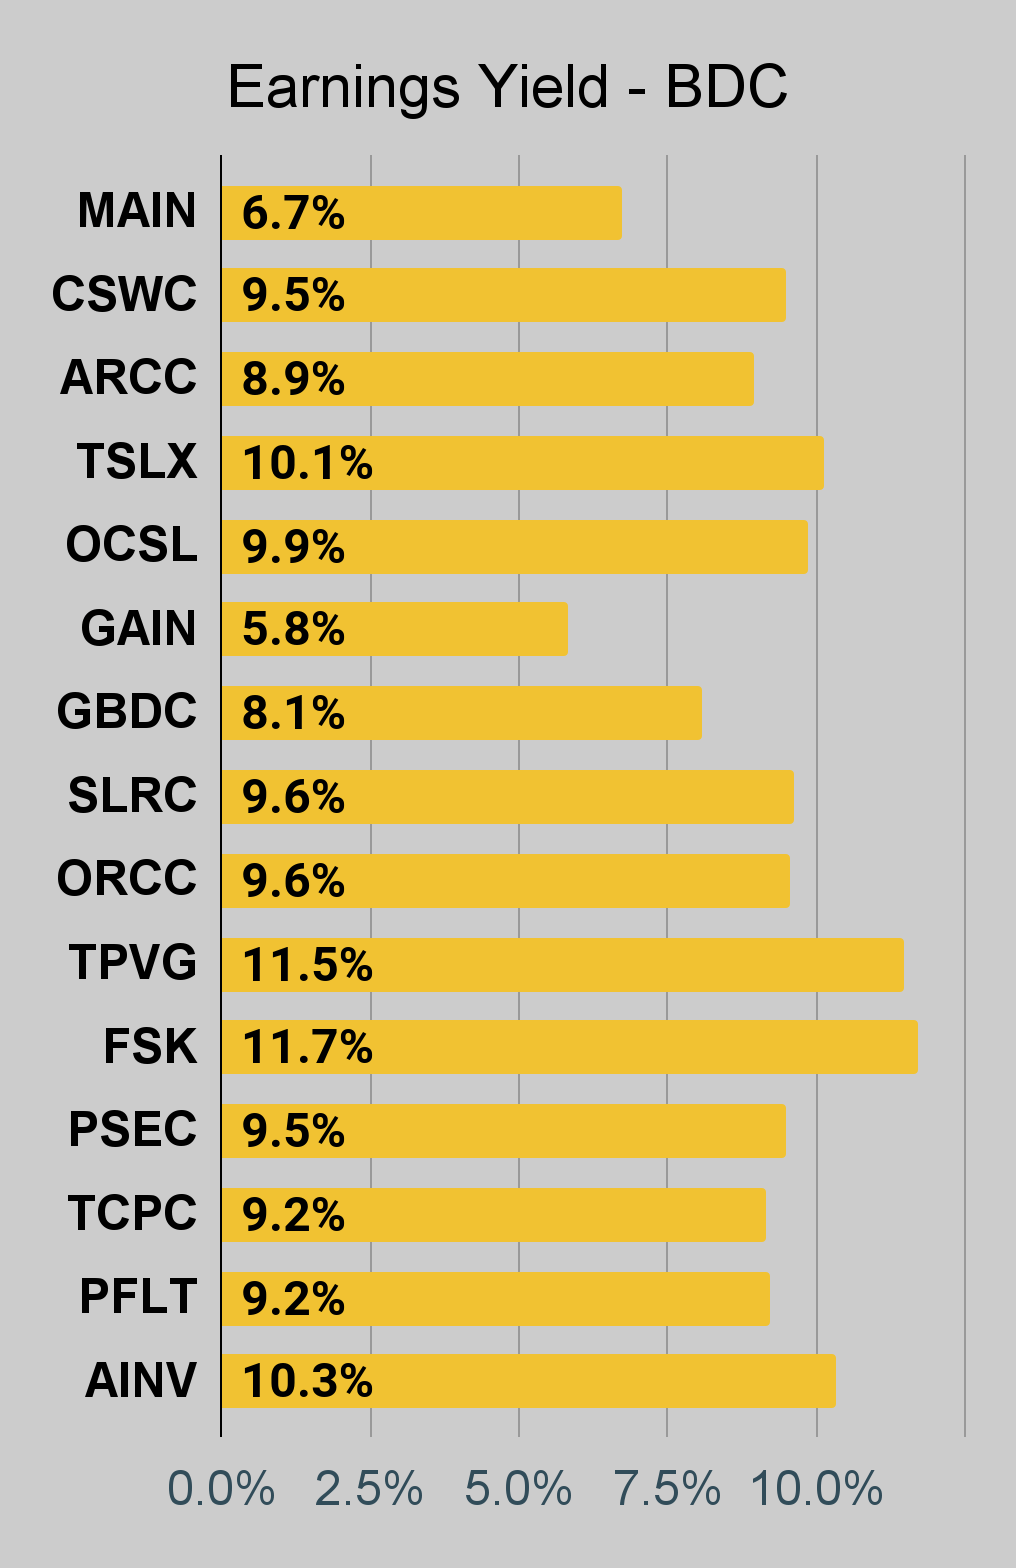
BDC Charts
 The REIT Forum |
 The REIT Forum |
 The REIT Forum |
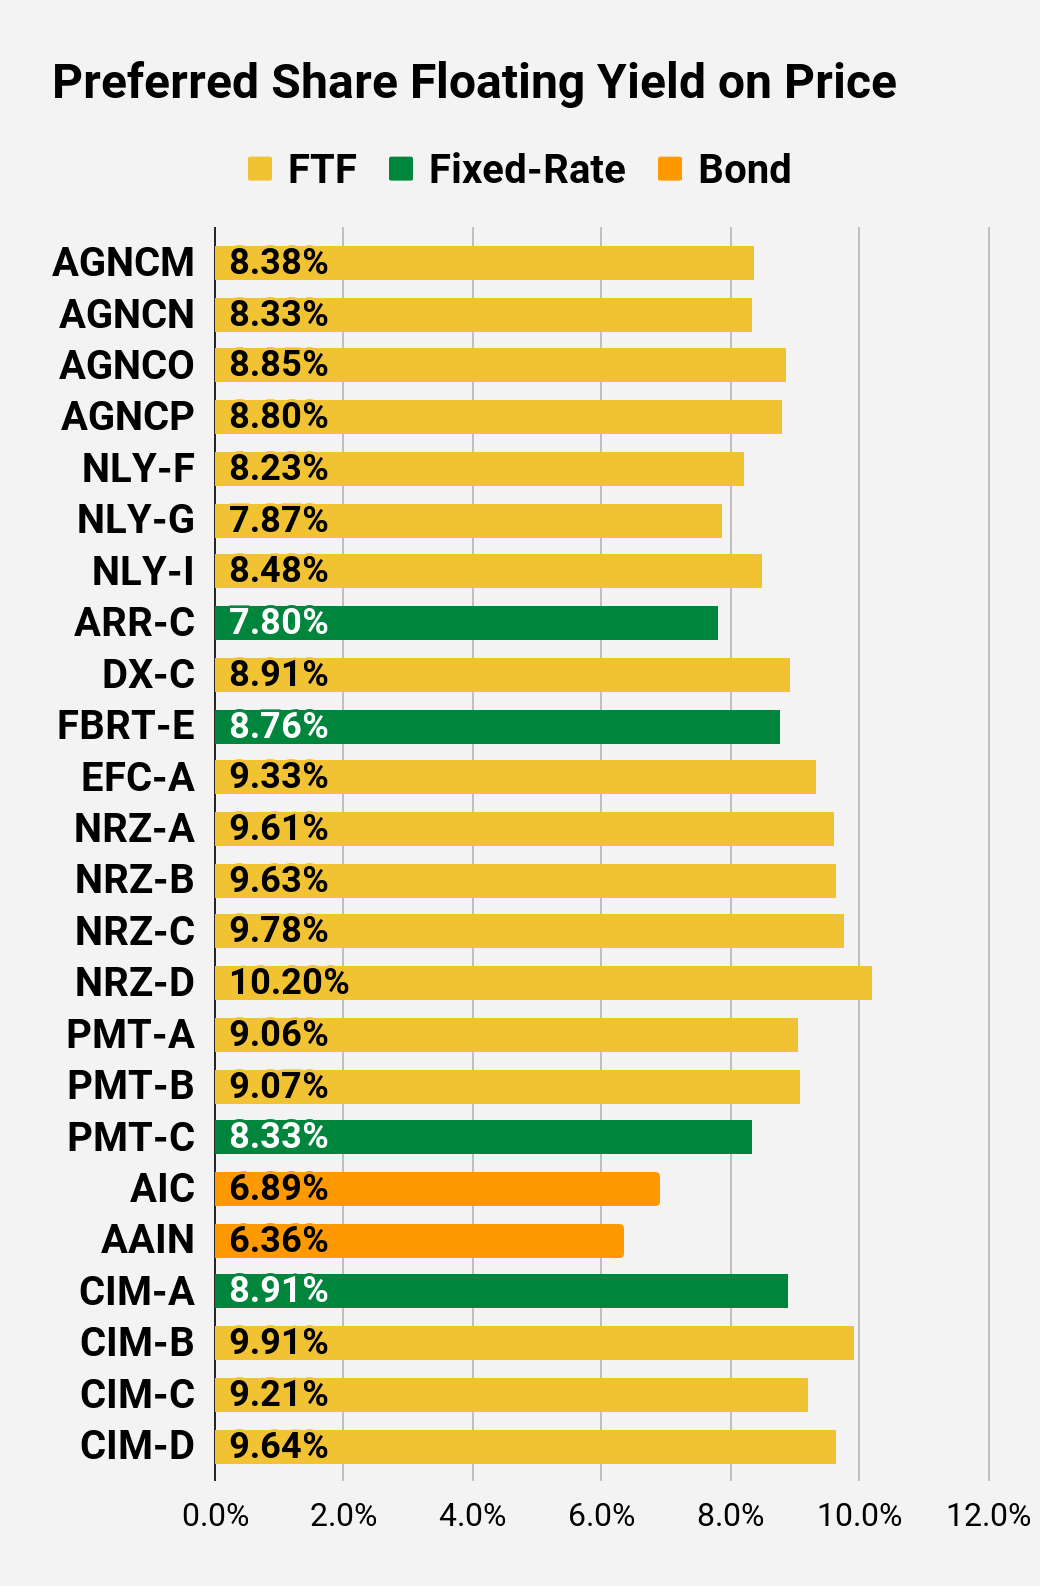
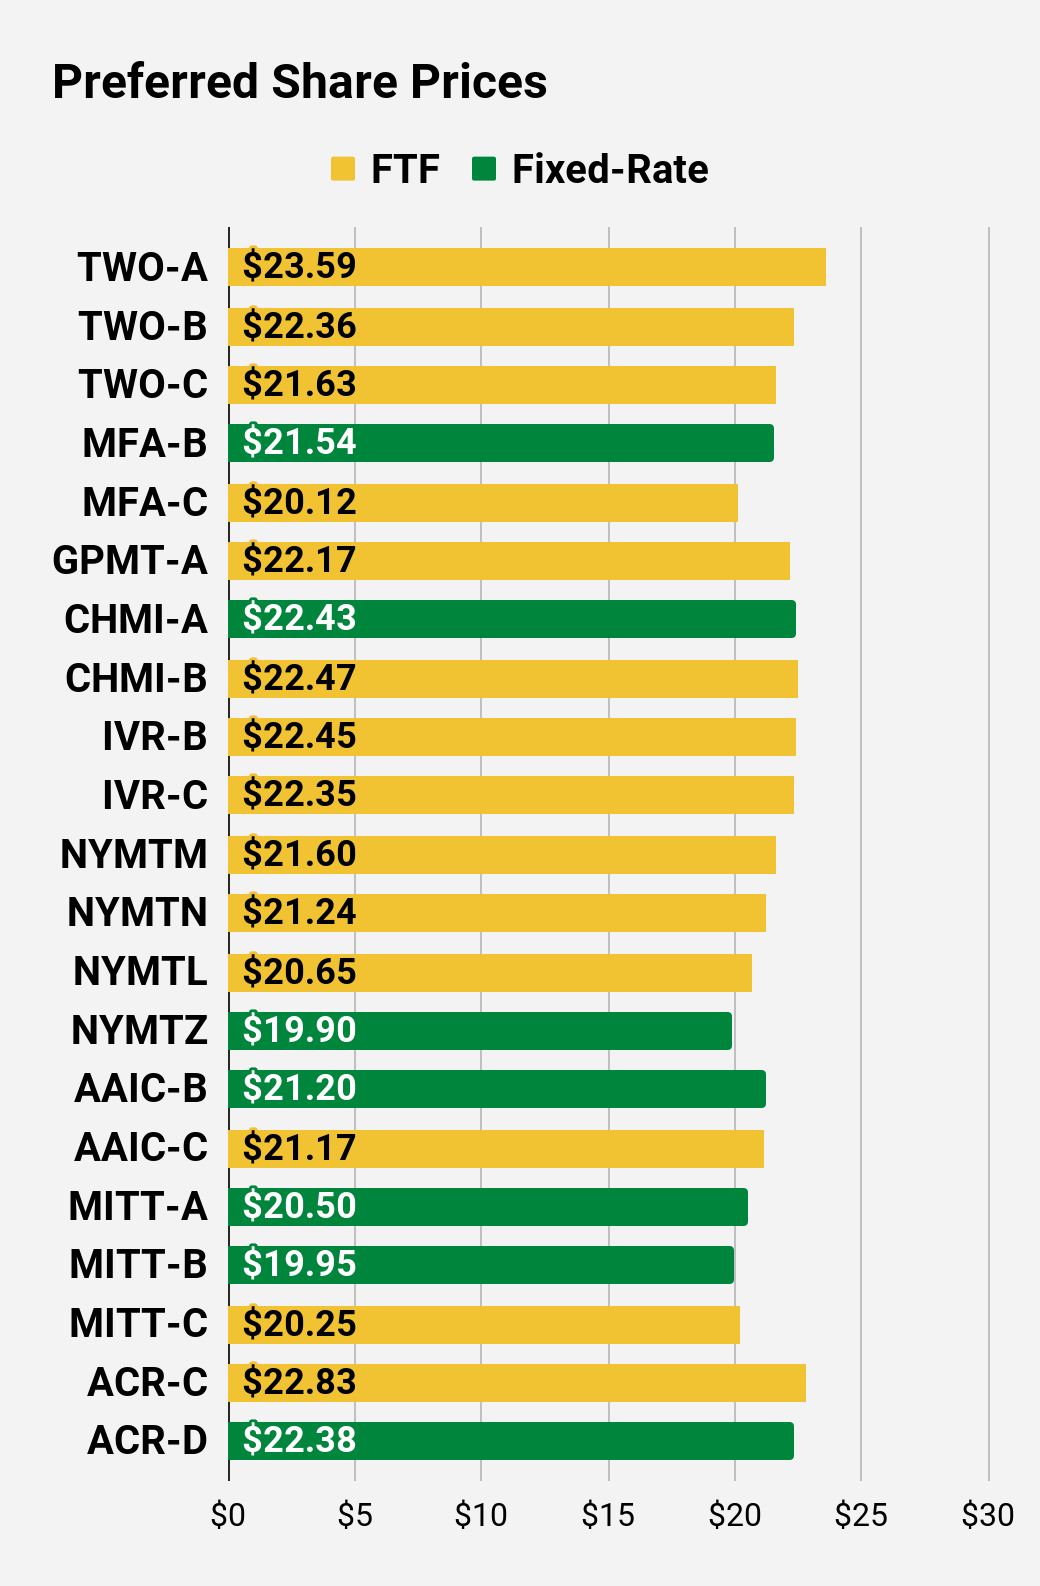
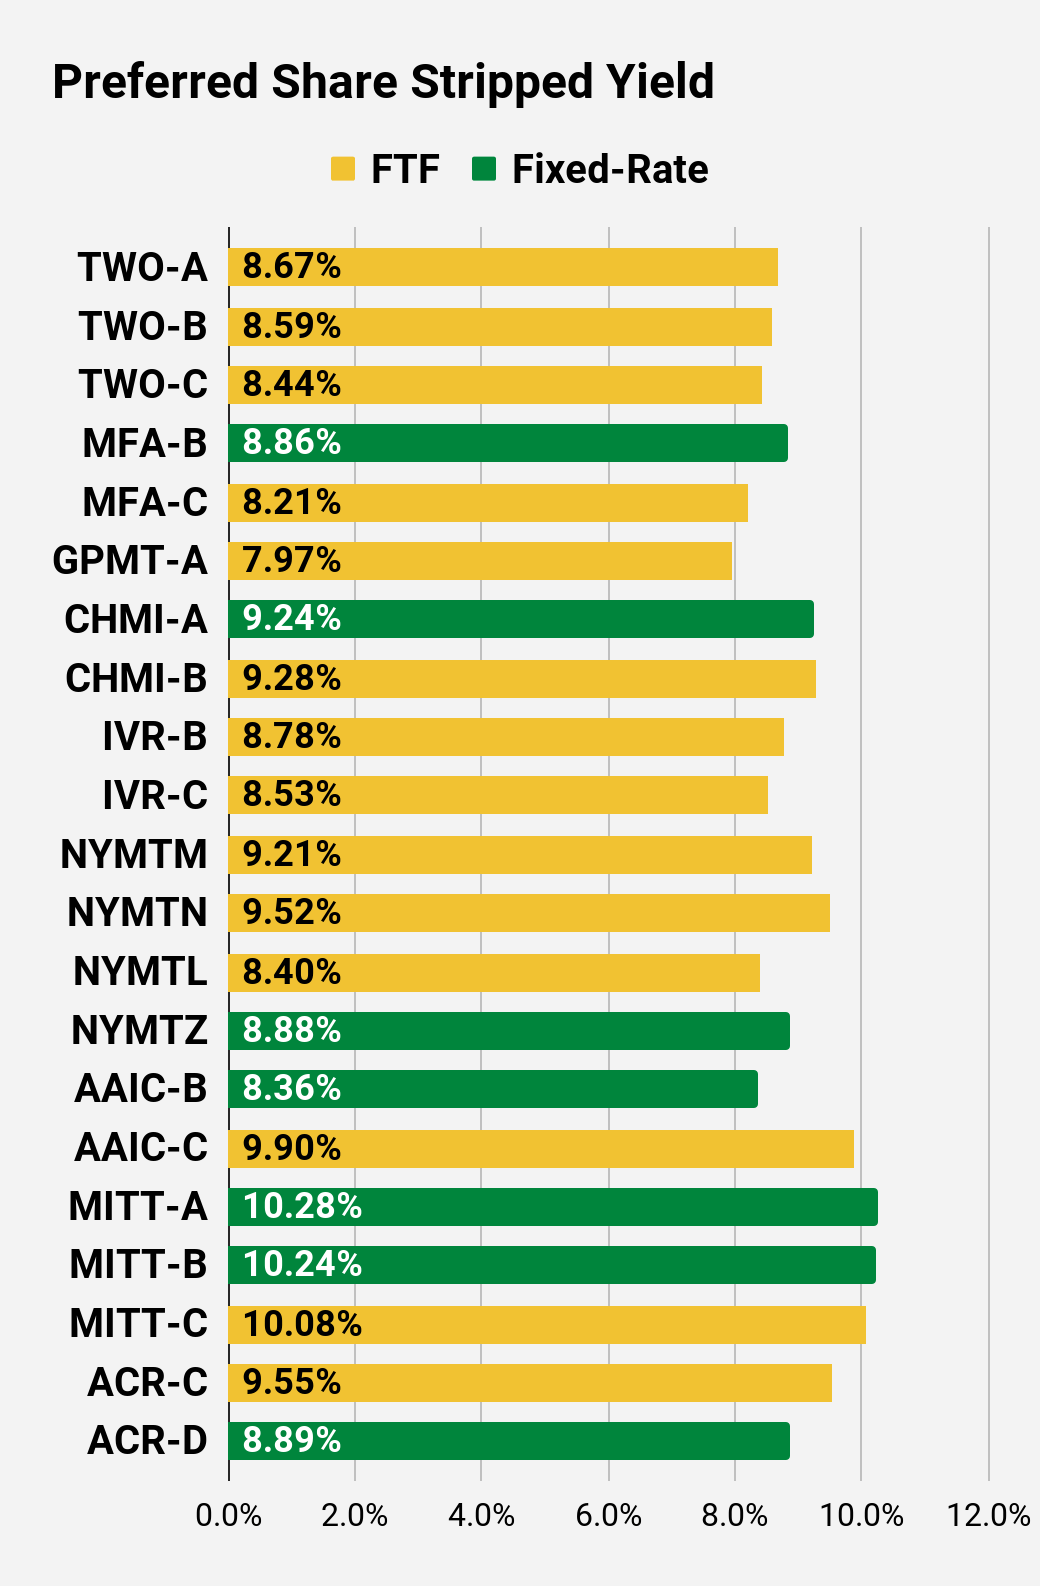
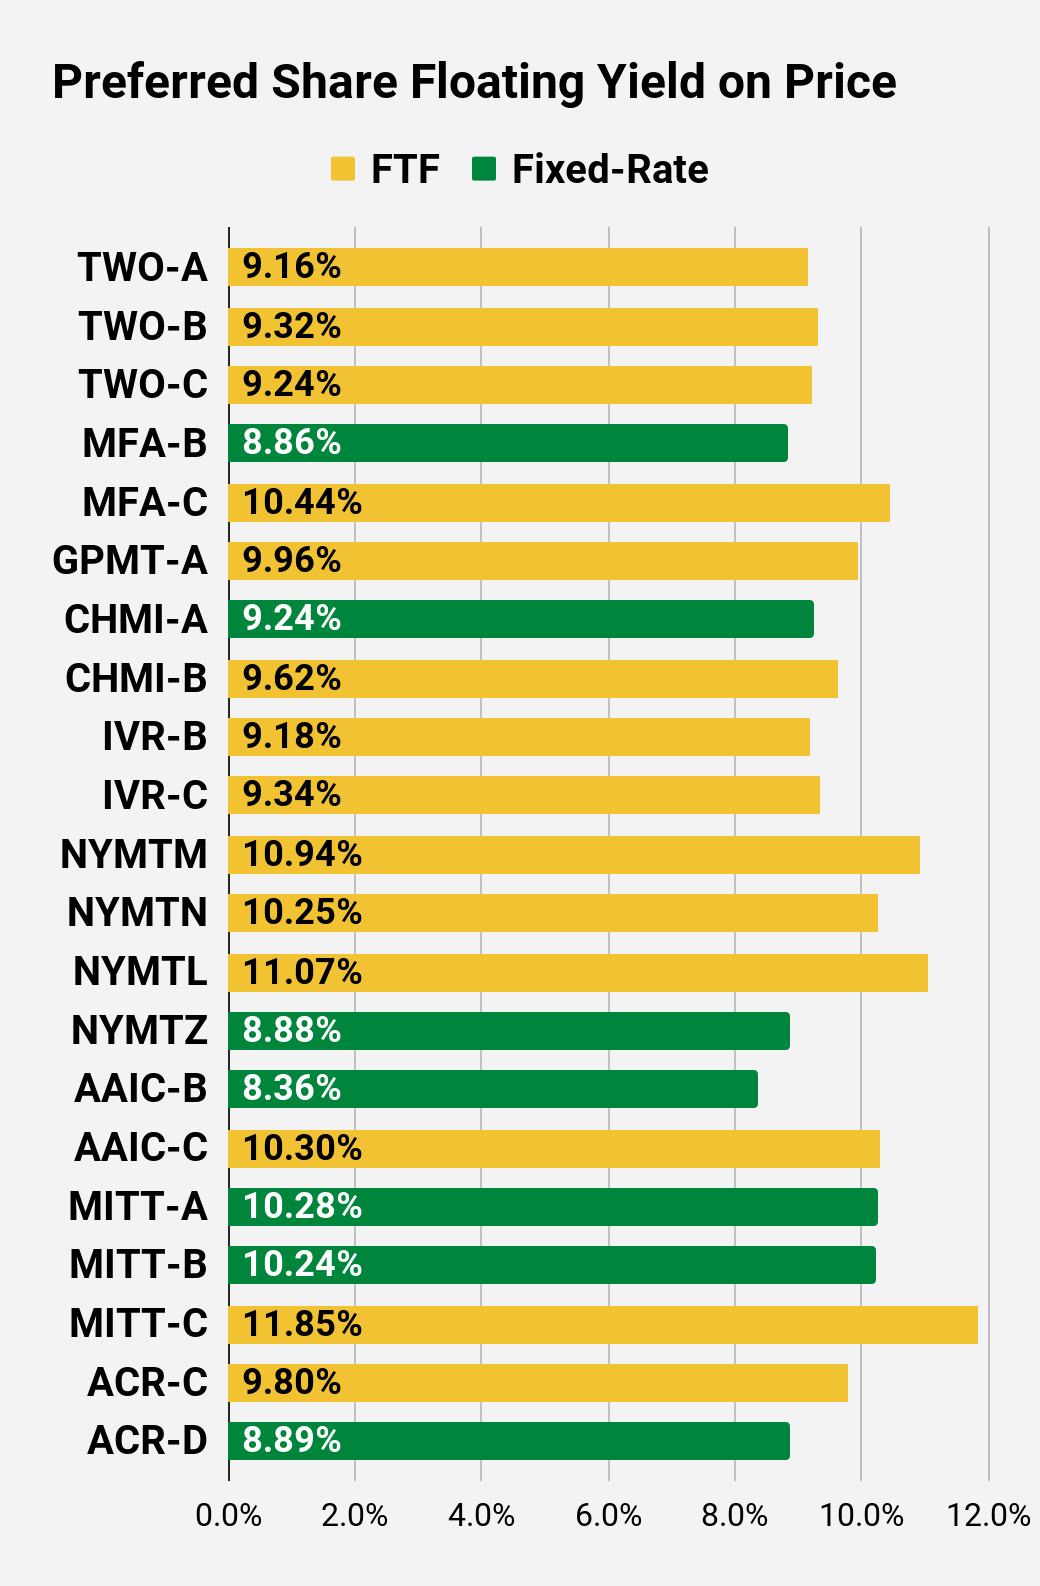
Preferred Share Charts
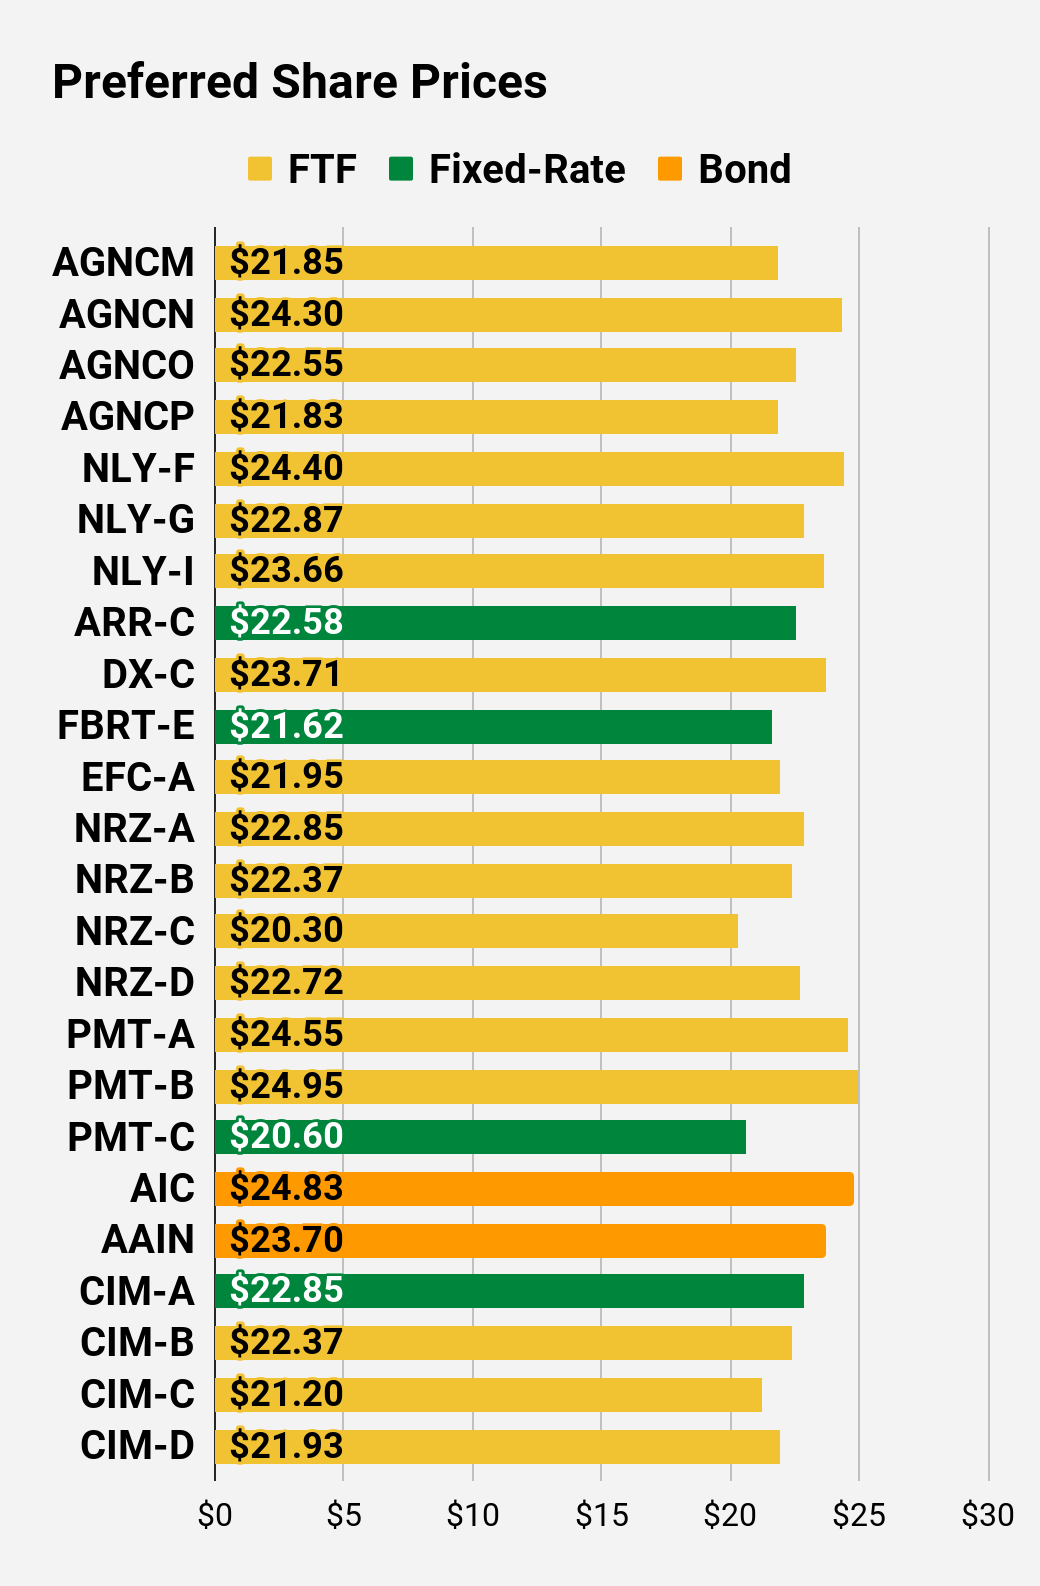 The REIT Forum |
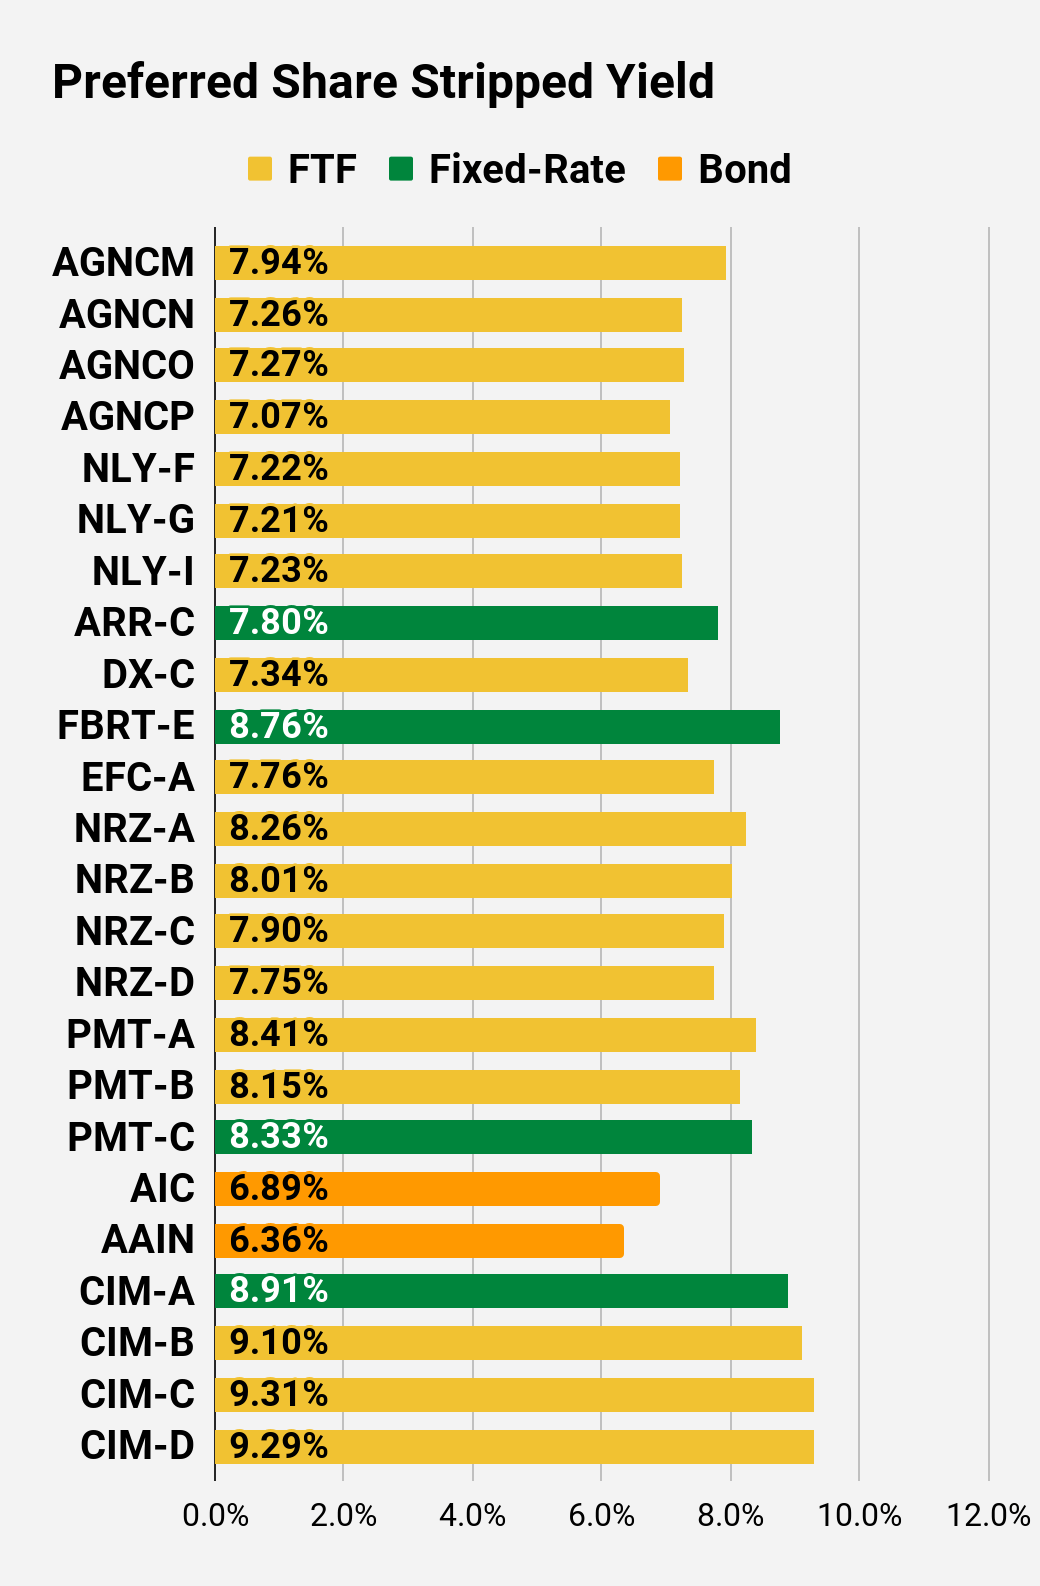 The REIT Forum |
 The REIT Forum |
 The REIT Forum |
 The REIT Forum |
 The REIT Forum |
Preferred Share Data
Beyond the charts, we’re also providing our readers with access to several other metrics for the preferred shares.
After testing out a series on preferred shares, we decided to try merging it into the series on common shares. After all, we are still talking about positions in mortgage REITs. We don’t have any desire to cover preferred shares without cumulative dividends, so any preferred shares you see in our column will have cumulative dividends. You can verify that by using Quantum Online. We’ve included the links in the table below.
To better organize the table, we needed to abbreviate column names as follows:
- Price = Recent Share Price – Shown in Charts
- BoF = Bond or FTF (Fixed-to-Floating)
- S-Yield = Stripped Yield – Shown in Charts
- Coupon = Initial Fixed-Rate Coupon
- FYoP = Floating Yield on Price – Shown in Charts
- NCD = Next Call Date (the soonest shares could be called)
- Note: For all FTF issues, the floating rate would start on NCD.
- WCC = Worst Cash to Call (lowest net cash return possible from a call)
- QO Link = Link to Quantum Online Page
Second Batch:
Strategy
Our goal is to maximize total returns. We achieve those most effectively by including “trading” strategies. We regularly trade positions in the mortgage REIT common shares and BDCs because:
- Prices are inefficient.
- Long-term, share prices generally revolve around book value.
- Short-term, price-to-book ratios can deviate materially.
- Book value isn’t the only step in analysis, but it is the cornerstone.
We also allocate to preferred shares and equity REITs. We encourage buy-and-hold investors to consider using more preferred shares and equity REITs.
Performance
We compare our performance against 4 ETFs that investors might use for exposure to our sectors:
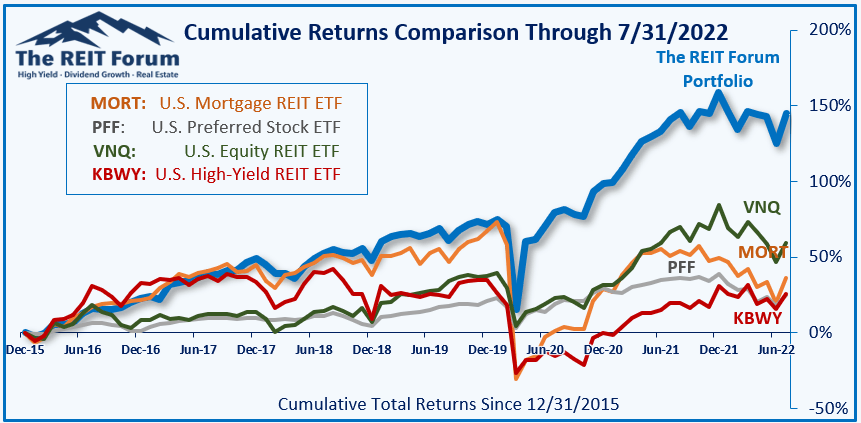
The REIT Forum
The 4 ETFs we use for comparison are:
|
Ticker |
Exposure |
|
One of the largest mortgage REIT ETFs |
|
|
One of the largest preferred share ETFs |
|
|
Largest equity REIT ETF |
|
|
The high-yield equity REIT ETF. Yes, it has been dreadful. |
When investors think it isn’t possible to earn solid returns in preferred shares or mortgage REITs, we politely disagree. The sector has plenty of opportunities, but investors still need to be wary of the risks. We can’t simply reach for yield and hope for the best. When it comes to common shares, we need to be even more vigilant to protect our principal by regularly watching prices and updating estimates for book value and price targets.
Ratings:
- Bullish on DX and NRZ / RITM
- Neutral on PMT
- Bearish on ORC, ARR, CHMI, and NLY
Be the first to comment